Loading subject page…
- Statistics
- Distributions
- Determination of Expected Frequency
Micro-course: Distributions
70,000 views
Learn key concepts and earn your certificate.










Determination of Expected Frequency

00:00
01:08
Video Summary: What Is Determination of Expected Frequency
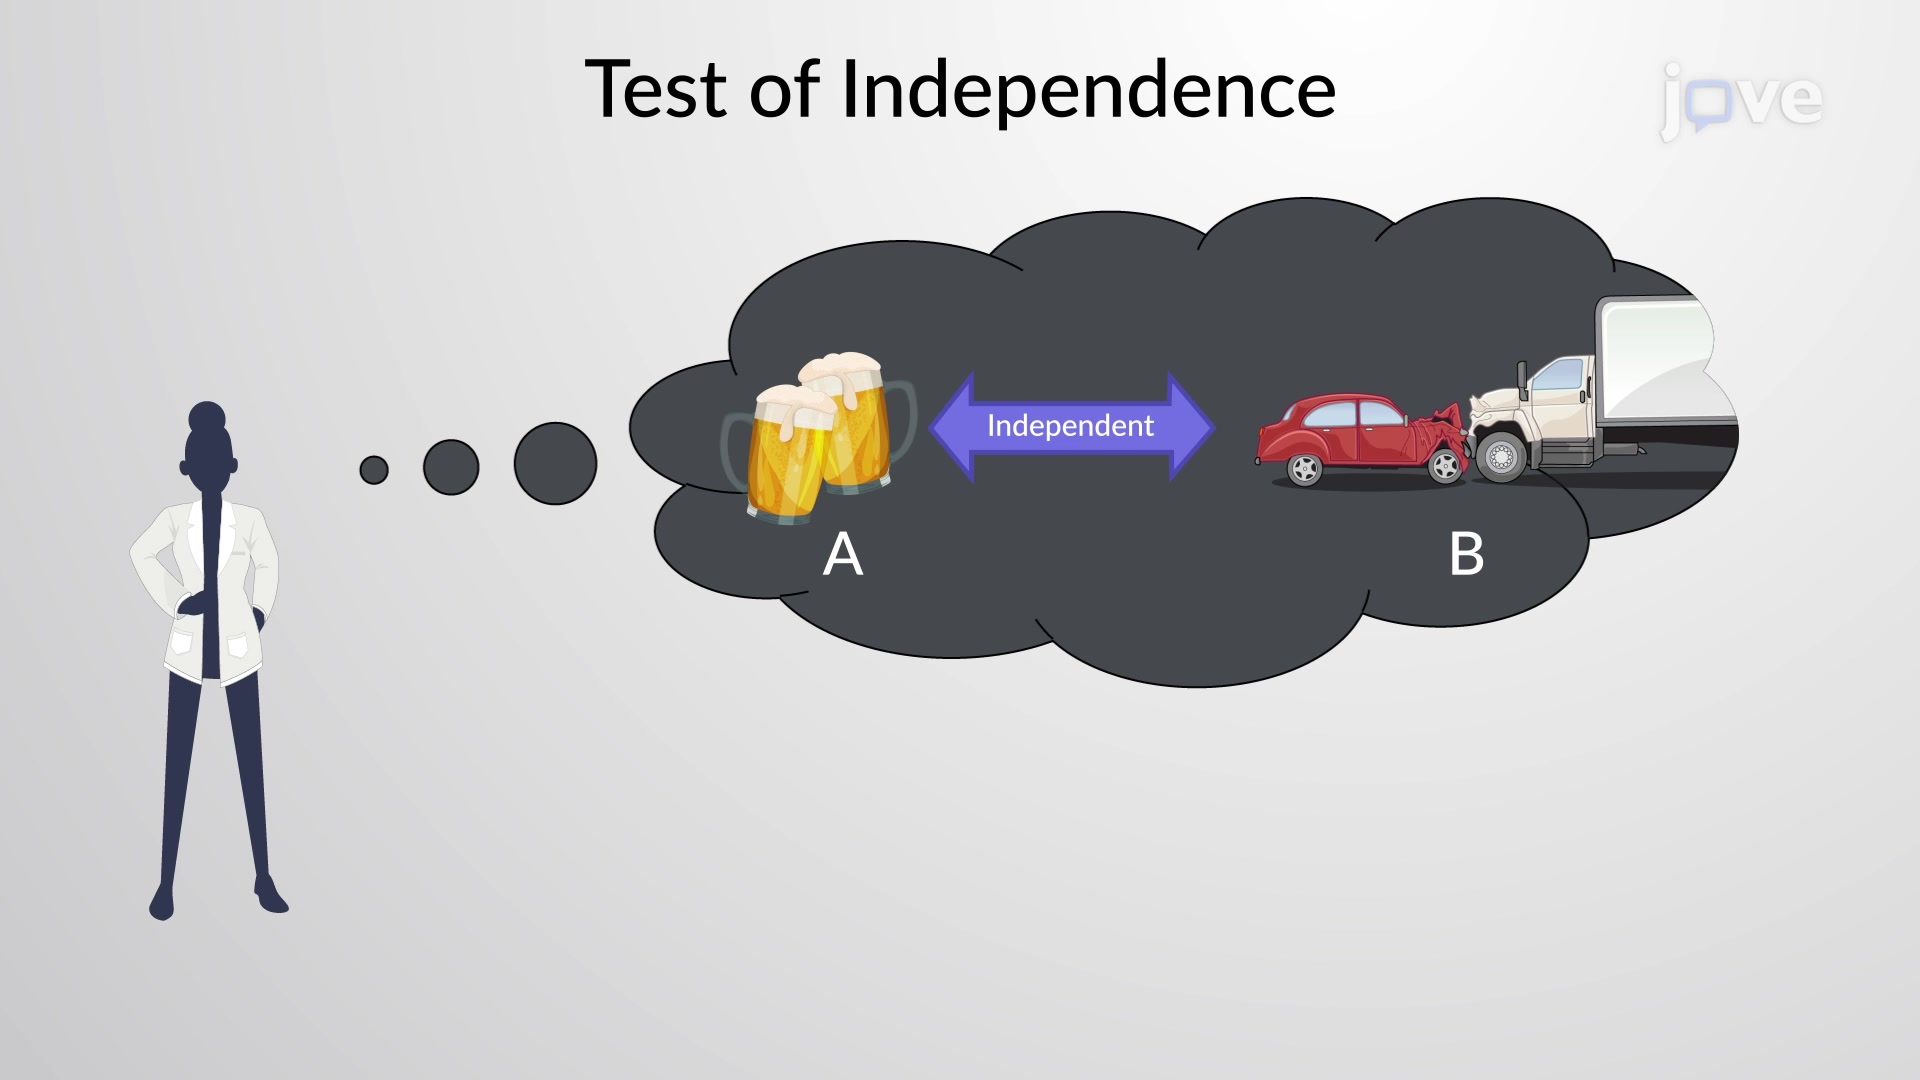
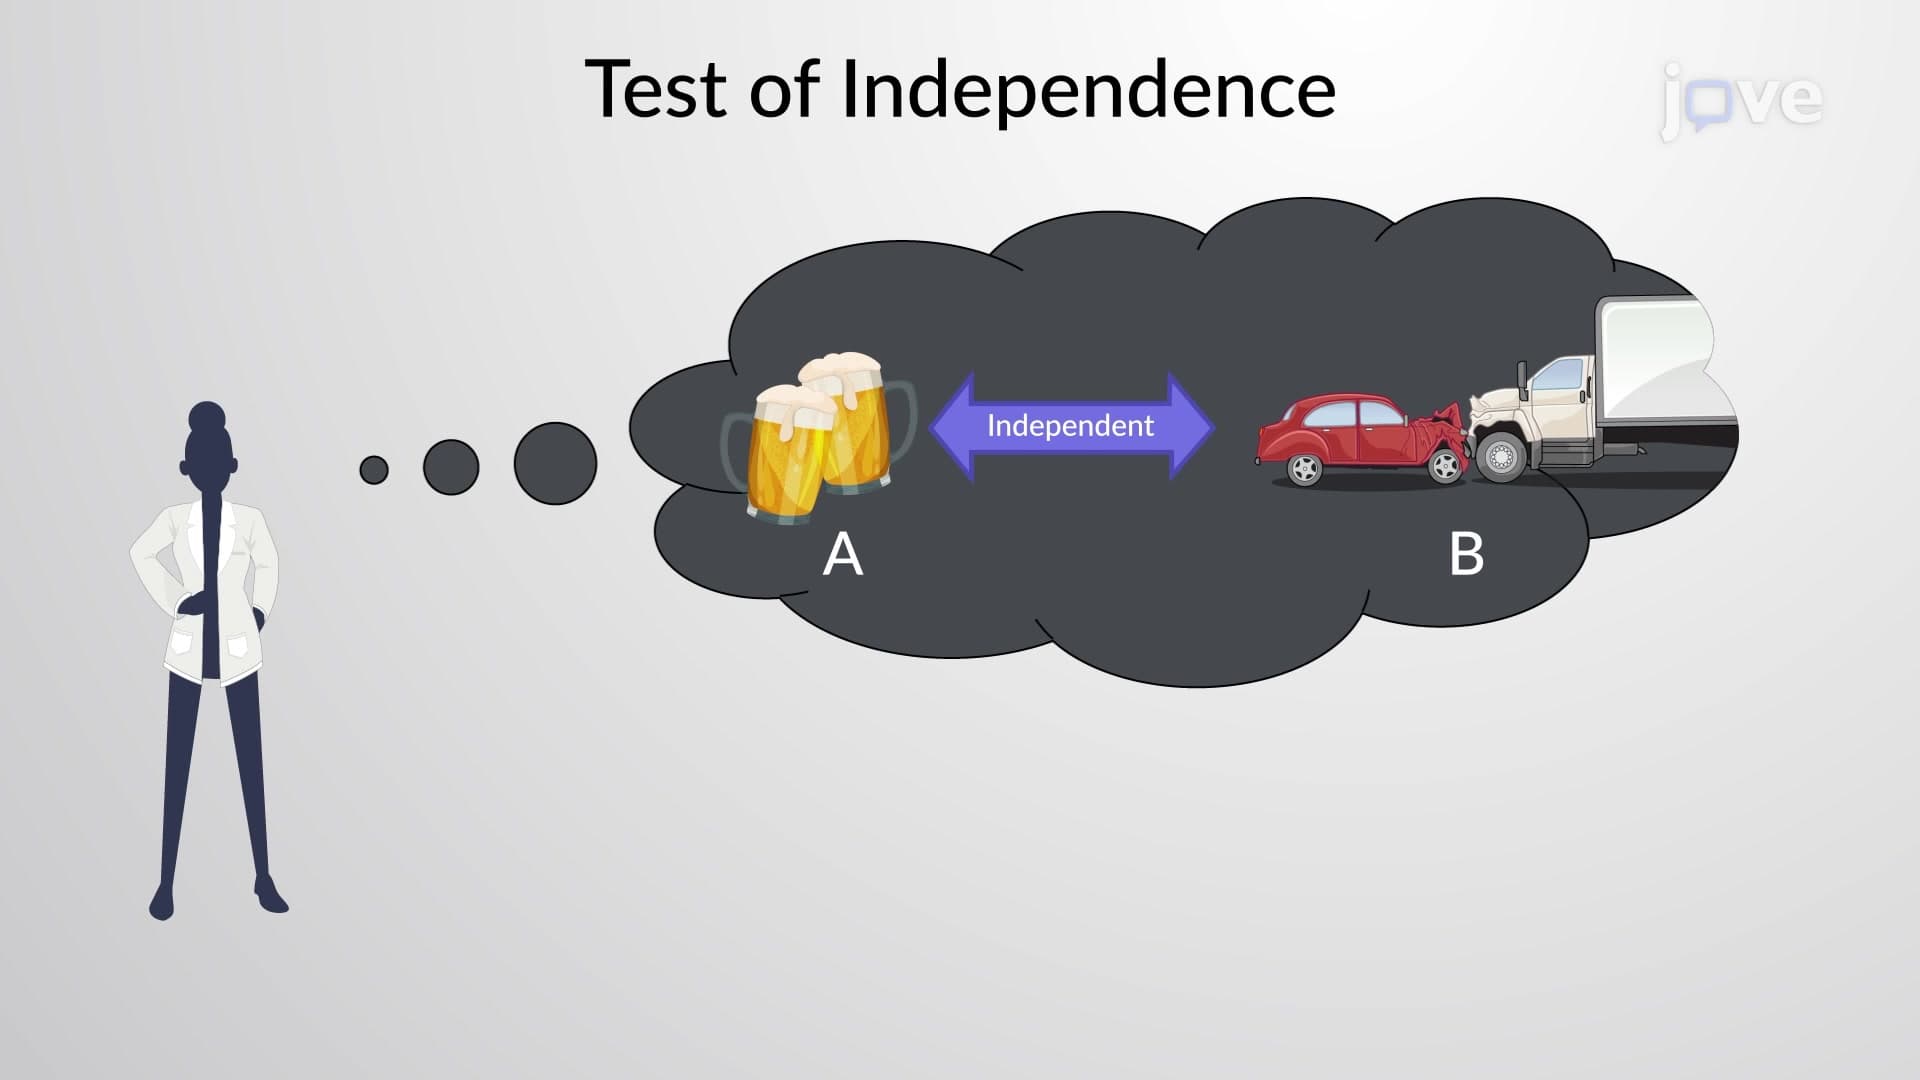
Ever wondered how epidemiologists at the CDC predict disease patterns or how market researchers analyze consumer behavior? The determination of expected frequency is the statistical foundation that makes these predictions possible. This concept involves calculating theoretical frequencies in contingency tables by assuming independence between variables, such as determining expected rates of traffic accidents based on alcohol consumption patterns in US traffic safety studies. Watch the full video on JoVE Coach to master this concept with expert-led visuals and step-by-step explanations.
- Understand what is determination of expected frequency and its role in chi-square tests of independence
- Identify the assumptions required for calculating expected frequencies in statistical analysis
- Analyze contingency tables to determine expected frequencies using the multiplication rule for independent events
- Apply the simplified formula: Expected Frequency = (Row Total × Column Total) / Grand Total
- Evaluate the difference between observed and expected frequencies in real-world datasets
- Recognize how expected frequency calculations support hypothesis testing in various fields
- Explore the connection between probability theory and statistical inference through expected frequency determination
- Compare observed versus expected patterns to draw meaningful conclusions from data
Understanding Determination of Expected Frequency
The determination of expected frequency forms the cornerstone of chi-square analysis, a statistical method widely used across medical research, social sciences, and business analytics. When researchers examine relationships between categorical variables-like studying connections between smoking habits and lung disease rates in American patients-they need a baseline for comparison. Expected frequencies provide this crucial reference point by representing what we would observe if no relationship existed between the variables.
The Mathematical Foundation
The process begins with a fundamental assumption: the two variables under investigation are independent. This independence assumption allows us to apply the multiplication rule from probability theory. For any cell in a contingency table, the expected frequency equals the product of the marginal probabilities multiplied by the total sample size.
The general formula simplifies to: Expected Frequency = (Row Total × Column Total) / Grand Total. This elegant equation emerges from probability principles but becomes remarkably practical for real-world analysis. For instance, if analyzing 1,000 patients where 300 are smokers and 150 have lung disease, the expected frequency of smoking lung disease patients would be (300 × 150) / 1,000 = 45 cases.
Practical Applications in Research and Testing
Expected frequency determination appears frequently in standardized tests like the AP Statistics exam and college-level statistics courses. Students encounter problems involving everything from analyzing voter preferences across different demographics to studying treatment effectiveness in clinical trials. The FDA regularly uses these calculations when evaluating drug safety data, comparing observed adverse events against expected background rates.
Real-World Implementation
Consider a public health study examining vaccination rates and flu incidence across different age groups in the United States. Researchers would calculate expected frequencies for each age-vaccination combination, assuming independence. If the observed frequencies significantly deviate from expected values, this suggests a meaningful relationship between vaccination status and flu outcomes-information crucial for policy decisions and resource allocation.
This statistical tool proves invaluable in business contexts too. Retail companies analyze customer purchasing patterns, calculating expected frequencies for different product combinations to optimize inventory and marketing strategies.
Frequently Asked Questions
Determination of expected frequency is the process of calculating theoretical frequencies for contingency table cells under the assumption that two categorical variables are independent. It provides the baseline values needed for chi-square tests of independence. This calculation uses row totals, column totals, and the grand total to determine what frequencies we would expect if no relationship existed between variables.
The AP Statistics exam frequently includes chi-square problems requiring expected frequency calculations. Students must demonstrate understanding of the independence assumption and apply the formula correctly. Practice problems often involve real scenarios like analyzing relationships between demographic factors and consumer preferences or medical outcomes.
Observed frequencies represent actual data counts from your sample, while expected frequencies show theoretical counts assuming variable independence. Large differences between observed and expected values indicate potential relationships between variables. The chi-square test statistic quantifies these differences to determine statistical significance.
The MCAT includes biostatistics questions involving expected frequencies, particularly in research methodology contexts. USMLE Step 1 tests this concept when evaluating epidemiological studies and clinical trial data. Nursing exams like NCLEX may include basic statistical inference questions requiring expected frequency understanding.
CDC epidemiologists calculate expected disease frequencies based on population demographics and known risk factors. This helps identify disease outbreaks by comparing observed cases against expected background rates. For example, monitoring flu cases across different regions and age groups to detect unusual patterns requiring public health intervention.
The concept becomes manageable once you understand the underlying logic of independence assumptions. The formula itself is straightforward multiplication and division. Focus on understanding why we calculate expected frequencies rather than memorizing complex equations. Most statistics courses introduce this topic with clear, step-by-step examples.
Practice with diverse real-world examples from different fields like healthcare, business, and social sciences. Create your own contingency tables using familiar scenarios. Work through the logic behind each calculation step rather than rushing to apply formulas. Use online chi-square calculators to verify your hand calculations.
Progress to chi-square test statistics, degrees of freedom, and p-value interpretation. Explore goodness-of-fit tests and more advanced contingency table analysis. Consider studying ANOVA for comparing means across groups and regression analysis for examining relationships between continuous variables.
Related Micro-courses