Loading video…

 15 Concepts
 70K views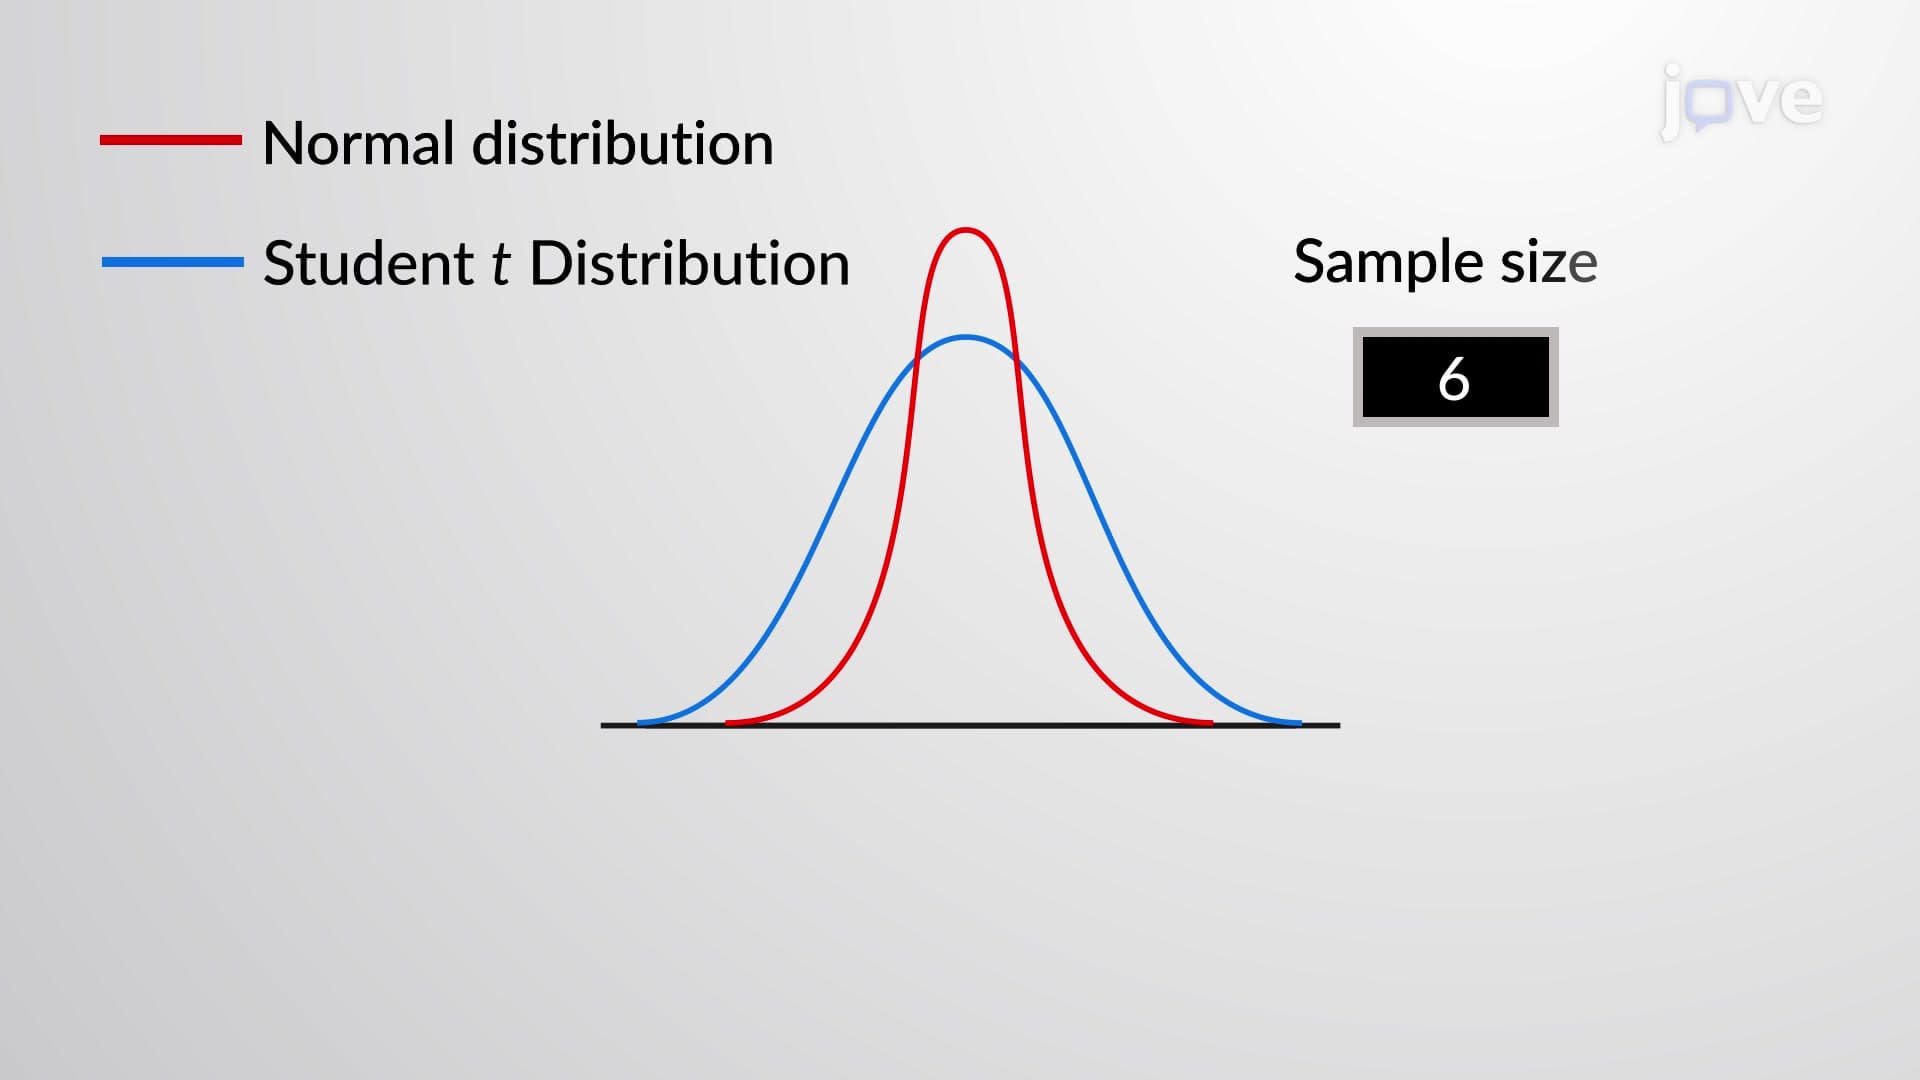

Video Summary: What Is Student T Distribution
Did you know that when Coca-Cola tests new flavors with small customer groups, they can't use normal distribution statistics? The student t distribution becomes essential when analyzing small samples where the population standard deviation is unknown-exactly like market research scenarios where companies survey limited customer groups. Unlike normal distributions that require known population parameters, the student t distribution provides reliable confidence intervals even with sample sizes under 30, making it invaluable for real-world statistical analysis. Watch the full video on JoVE Coach to master this concept with expert-led visuals and step-by-step explanations.
The student t distribution serves as a cornerstone of inferential statistics, particularly when dealing with real-world scenarios where population parameters remain unknown. Unlike the idealized normal distribution that assumes known population standard deviation, t-distribution acknowledges the uncertainty inherent in using sample data to make population inferences. This distribution was developed by William Sealy Gosset, who published under the pseudonym "Student" while working at Guinness Brewery in Ireland, addressing practical brewing quality control challenges.
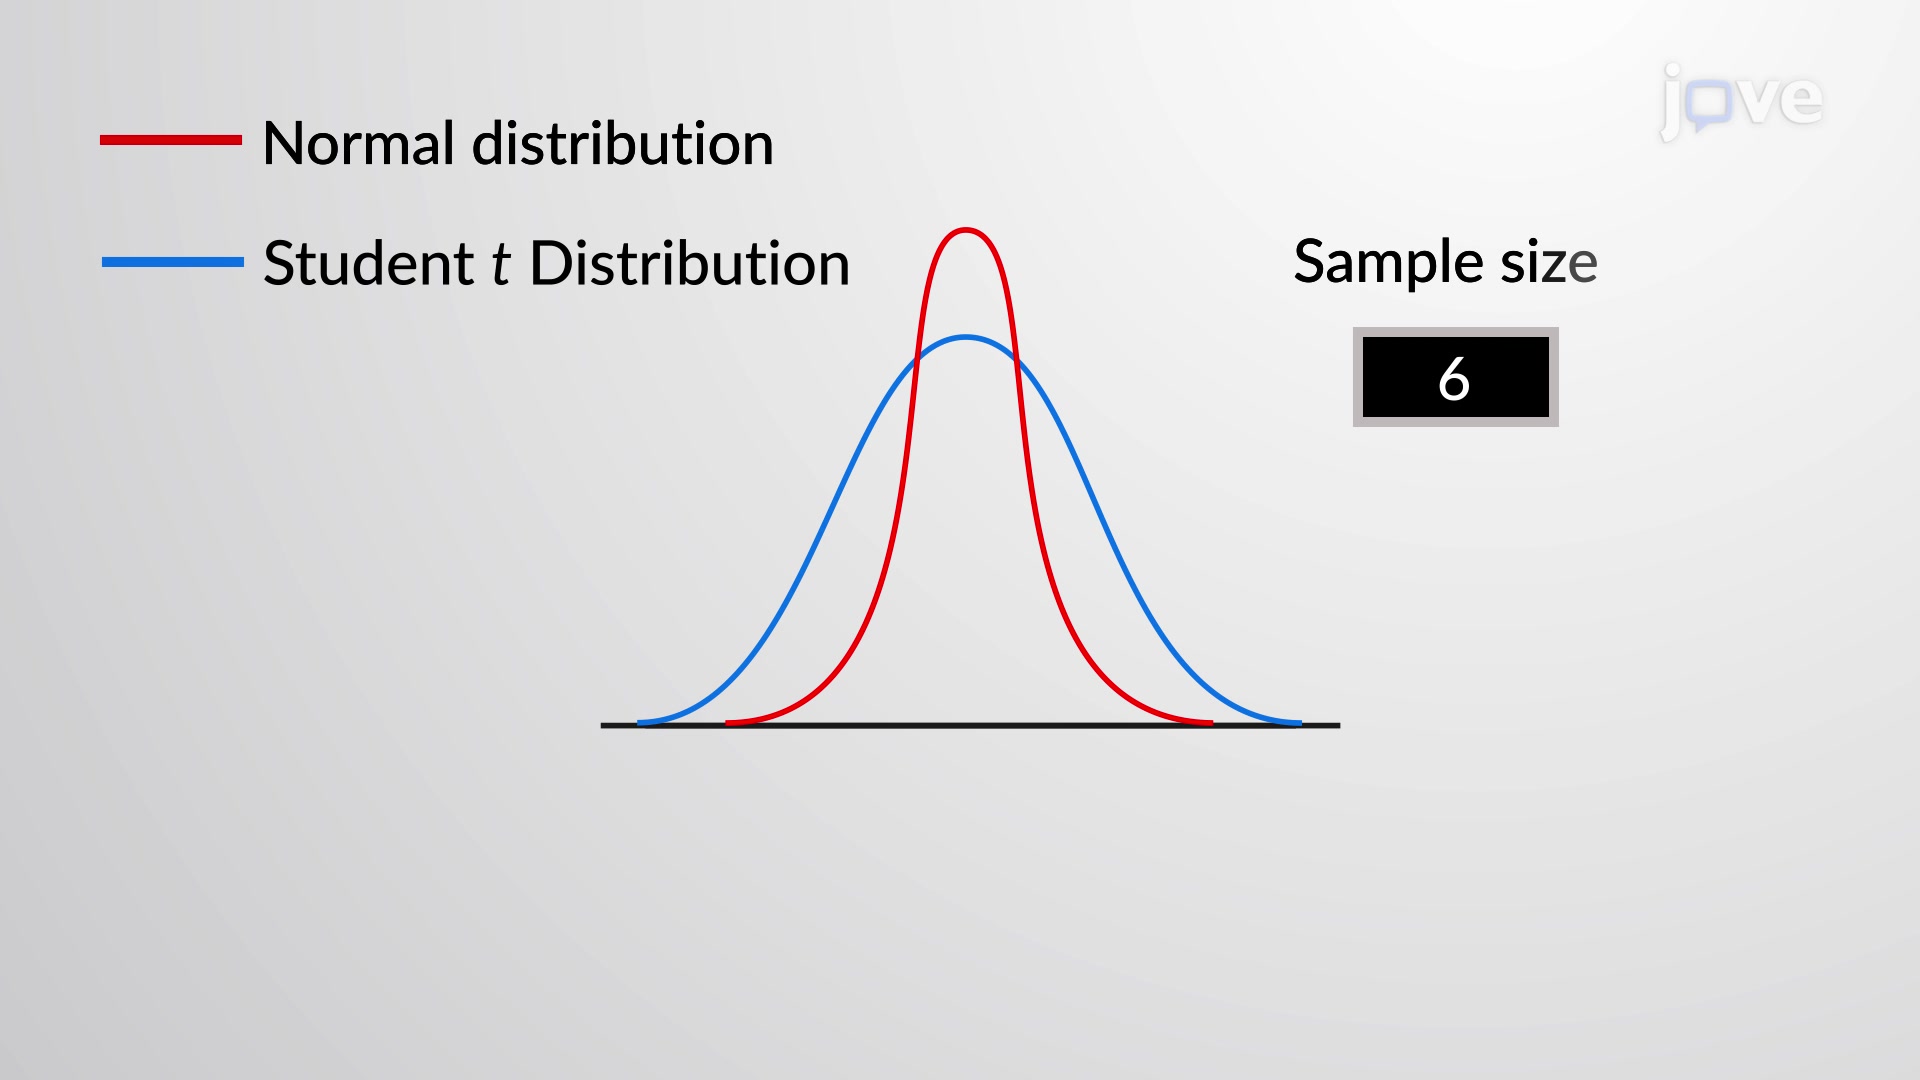
The t-distribution exhibits several distinctive features that make it invaluable for statistical analysis. It maintains perfect symmetry around zero, similar to the standard normal distribution, but displays notably wider tails and greater variability. This increased spread reflects the additional uncertainty introduced when estimating population parameters from sample data. The distribution's standard deviation always exceeds 1, contrasting with the standard normal distribution's unit standard deviation. As sample size increases, the t-distribution converges toward the standard normal distribution, with practical equivalence achieved around n=30.
Students encounter t-distribution applications across numerous academic disciplines and standardized tests. In AP Statistics courses, t-tests frequently appear in free-response questions involving hypothesis testing and confidence intervals. College-level courses in psychology, business, and medical research heavily emphasize t-distribution applications. For instance, pharmaceutical companies conducting clinical trials with limited participant groups rely on t-distribution methods to establish drug efficacy. Similarly, educational researchers studying classroom interventions often work with small sample sizes, making t-distribution analysis essential for valid conclusions.
The margin of error calculation using t-distribution follows the formula: ME = t(α/2) × (s/√n), where t(α/2) represents the critical t-value, s denotes sample standard deviation, and n indicates sample size. This formula demonstrates why confidence intervals widen with t-distribution compared to z-distribution-the t-critical values exceed corresponding z-values, particularly with smaller samples. Students preparing for MCAT statistics sections or college research methods courses must master these calculations, as they form the foundation for interpreting experimental results and making evidence-based decisions in professional practice.
Related Micro-courses