Loading video…

 15 Concepts
 70K views

Video Summary: Distributions to Estimate Population Parameter Explained
Ever wondered how Netflix predicts which shows you'll love with just a few clicks? Distributions to estimate population parameter make this possible by helping statisticians draw conclusions about entire populations from small samples. When the FDA tests a new medication on 1,000 patients to determine its effectiveness for all Americans, they're using these statistical distributions to make confident estimates. The concept of Distributions To Estimate Population Parameter Explained involves choosing between z, t, chi-square, and F distributions based on what information is available about your data. Watch the full video on JoVE Coach to master this concept with expert-led visuals and step-by-step explanations.
Statistical inference relies on our ability to make educated guesses about entire populations based on limited sample data. When pollsters survey 1,200 Americans to predict election outcomes for 240 million eligible voters, they're applying the principles of parameter estimation. The challenge lies in selecting the appropriate statistical distribution that best reflects the underlying data characteristics and sampling conditions.
The z-distribution becomes your go-to tool when estimating population proportions or means with known population standard deviations. For instance, if quality control engineers at Boeing know the historical standard deviation of aircraft part measurements, they can use z-distribution to estimate the true population mean from current sample data. This distribution assumes normal population characteristics and relies on the Central Limit Theorem for samples larger than 30.
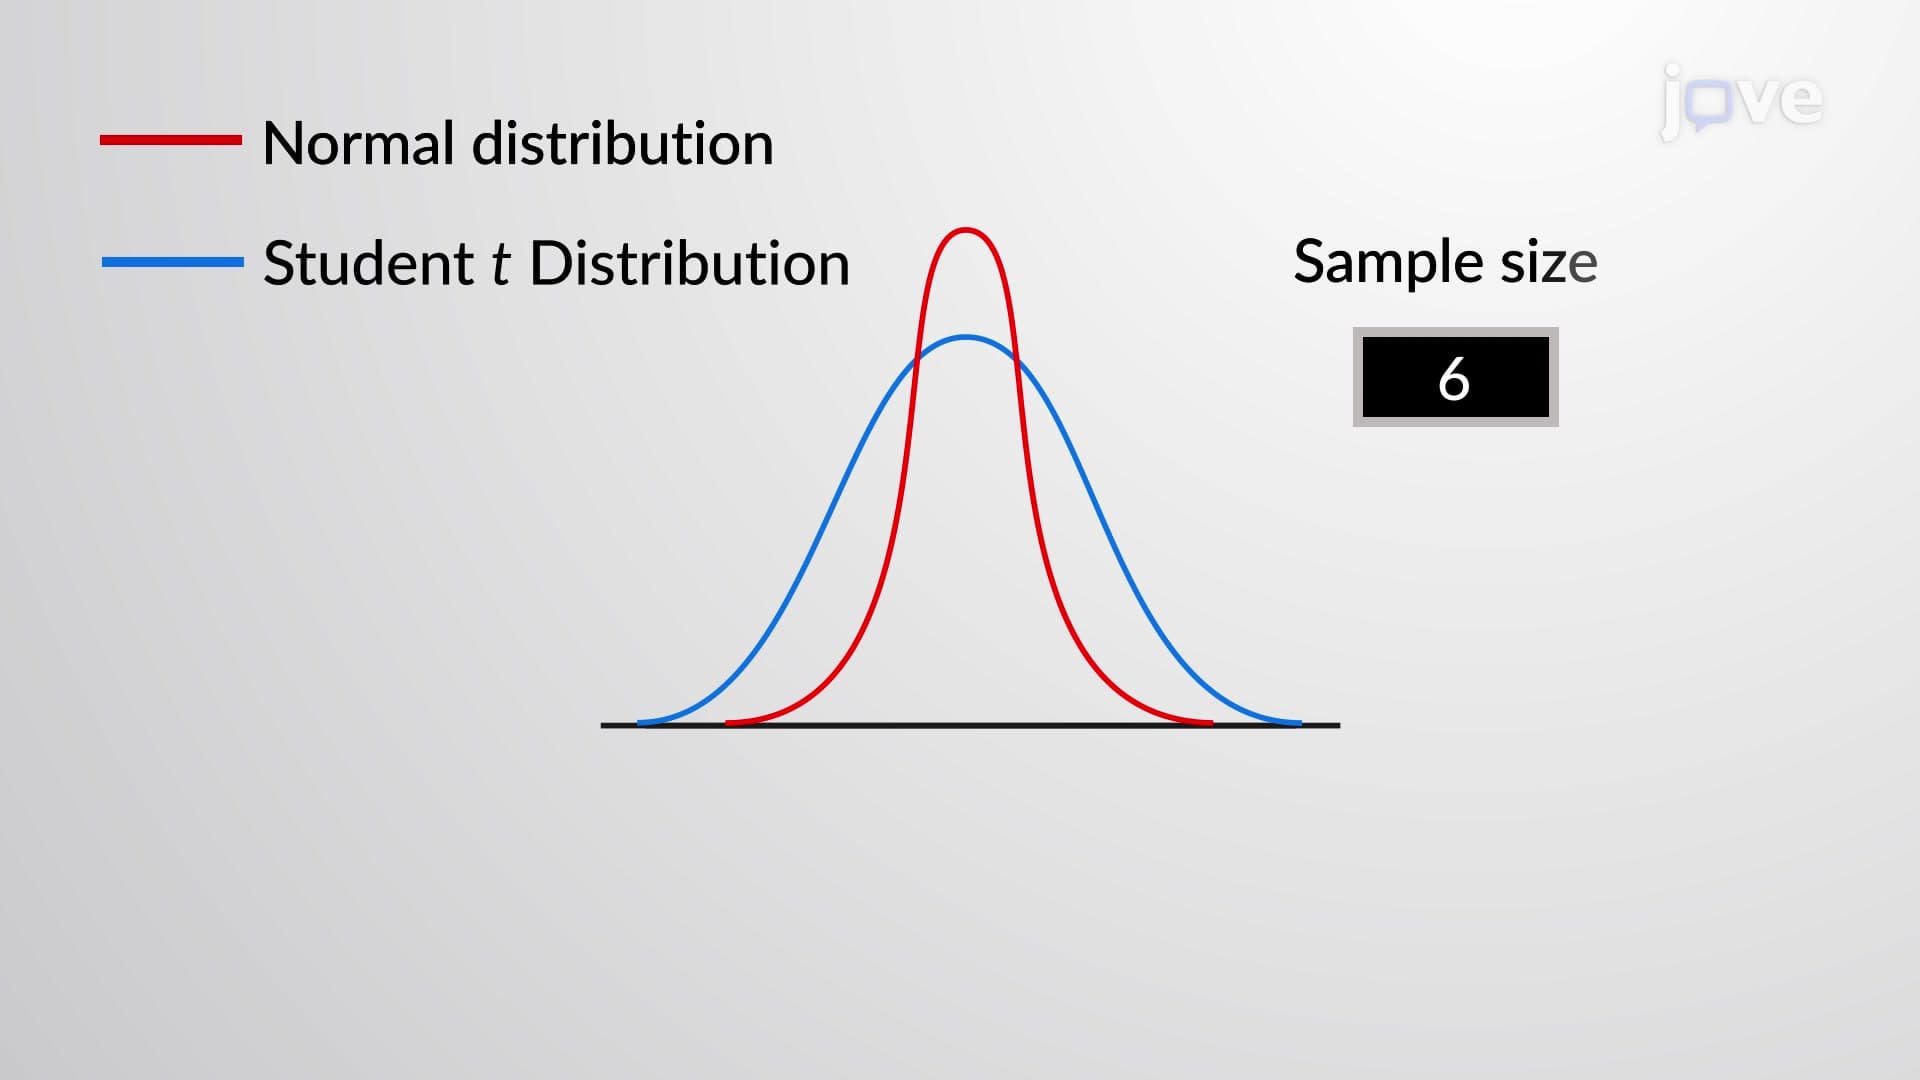
However, most real-world scenarios involve unknown population standard deviations. Here's where the t-distribution shines. When medical researchers study the effectiveness of a new diabetes treatment without knowing the population's blood sugar variation, they turn to t-distribution. This distribution accounts for the additional uncertainty introduced by estimating the population standard deviation from sample data, making it more conservative and reliable for smaller sample sizes.
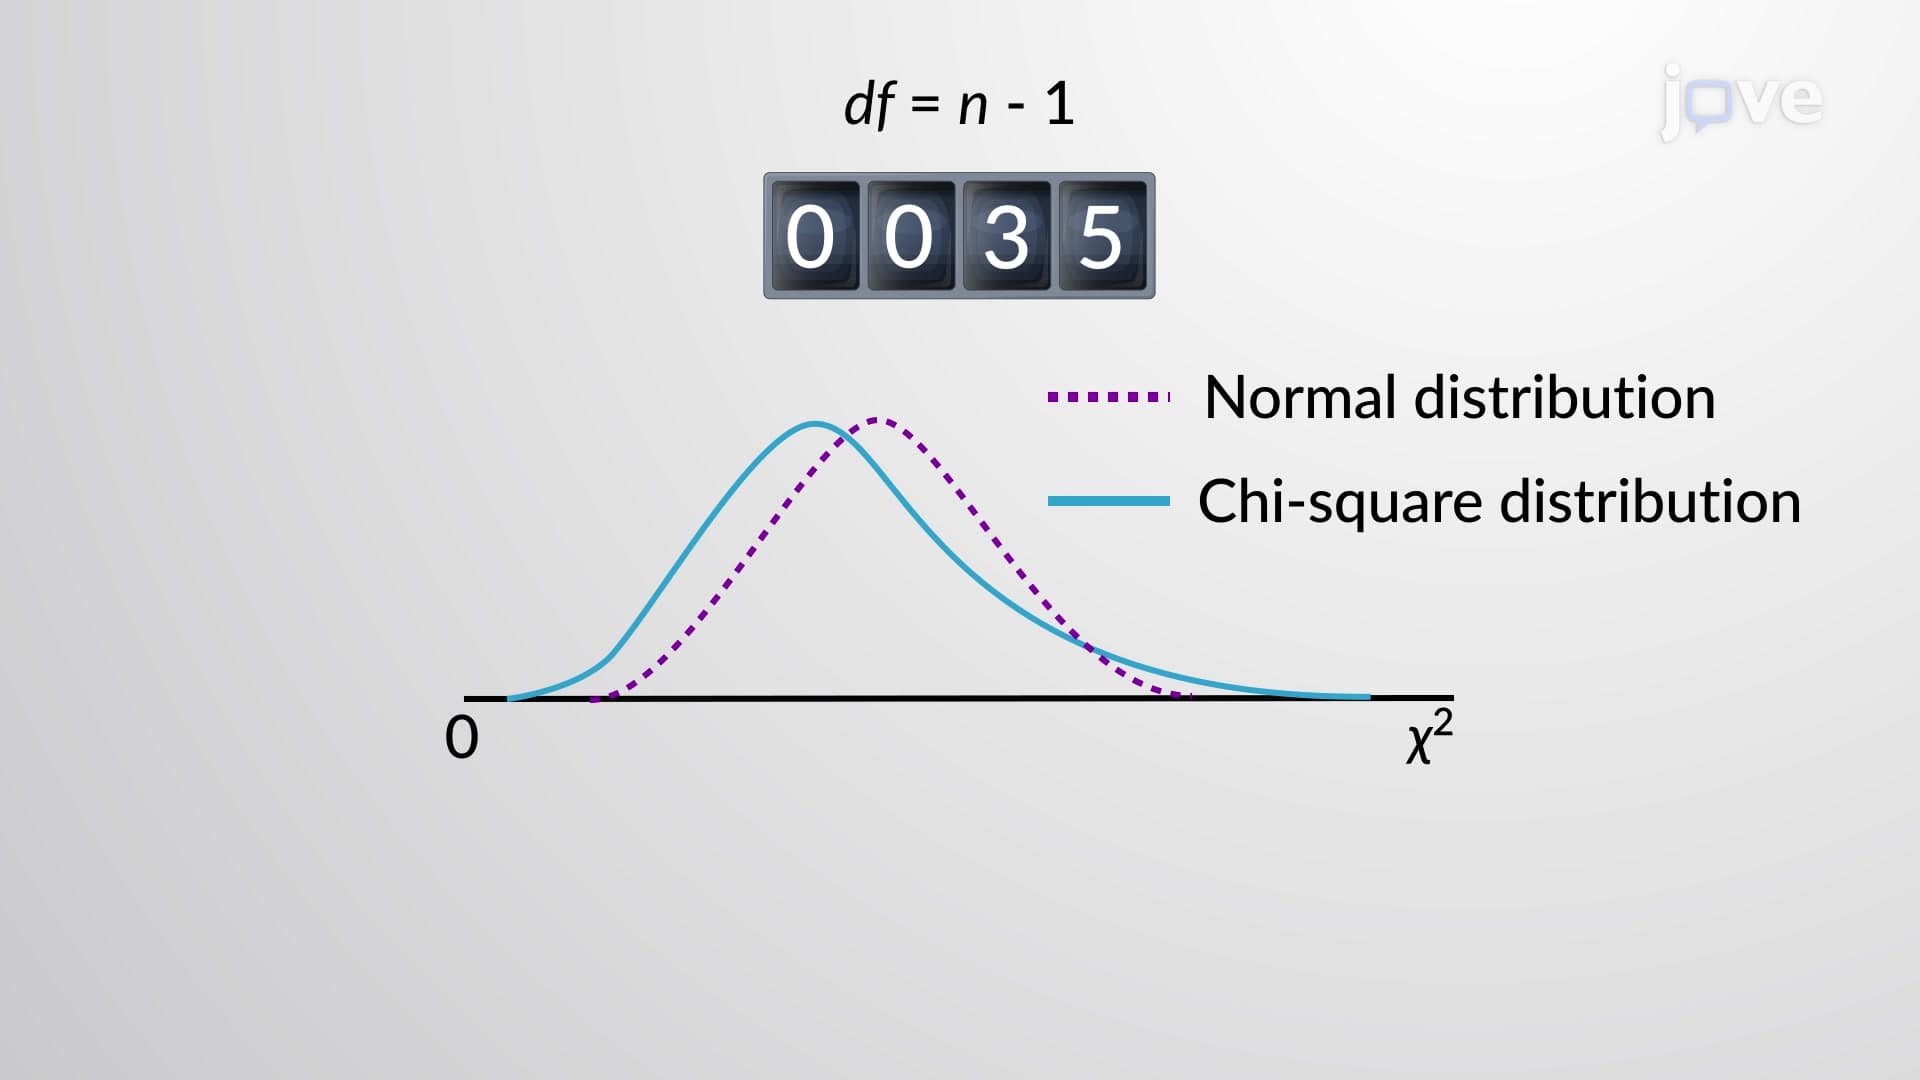
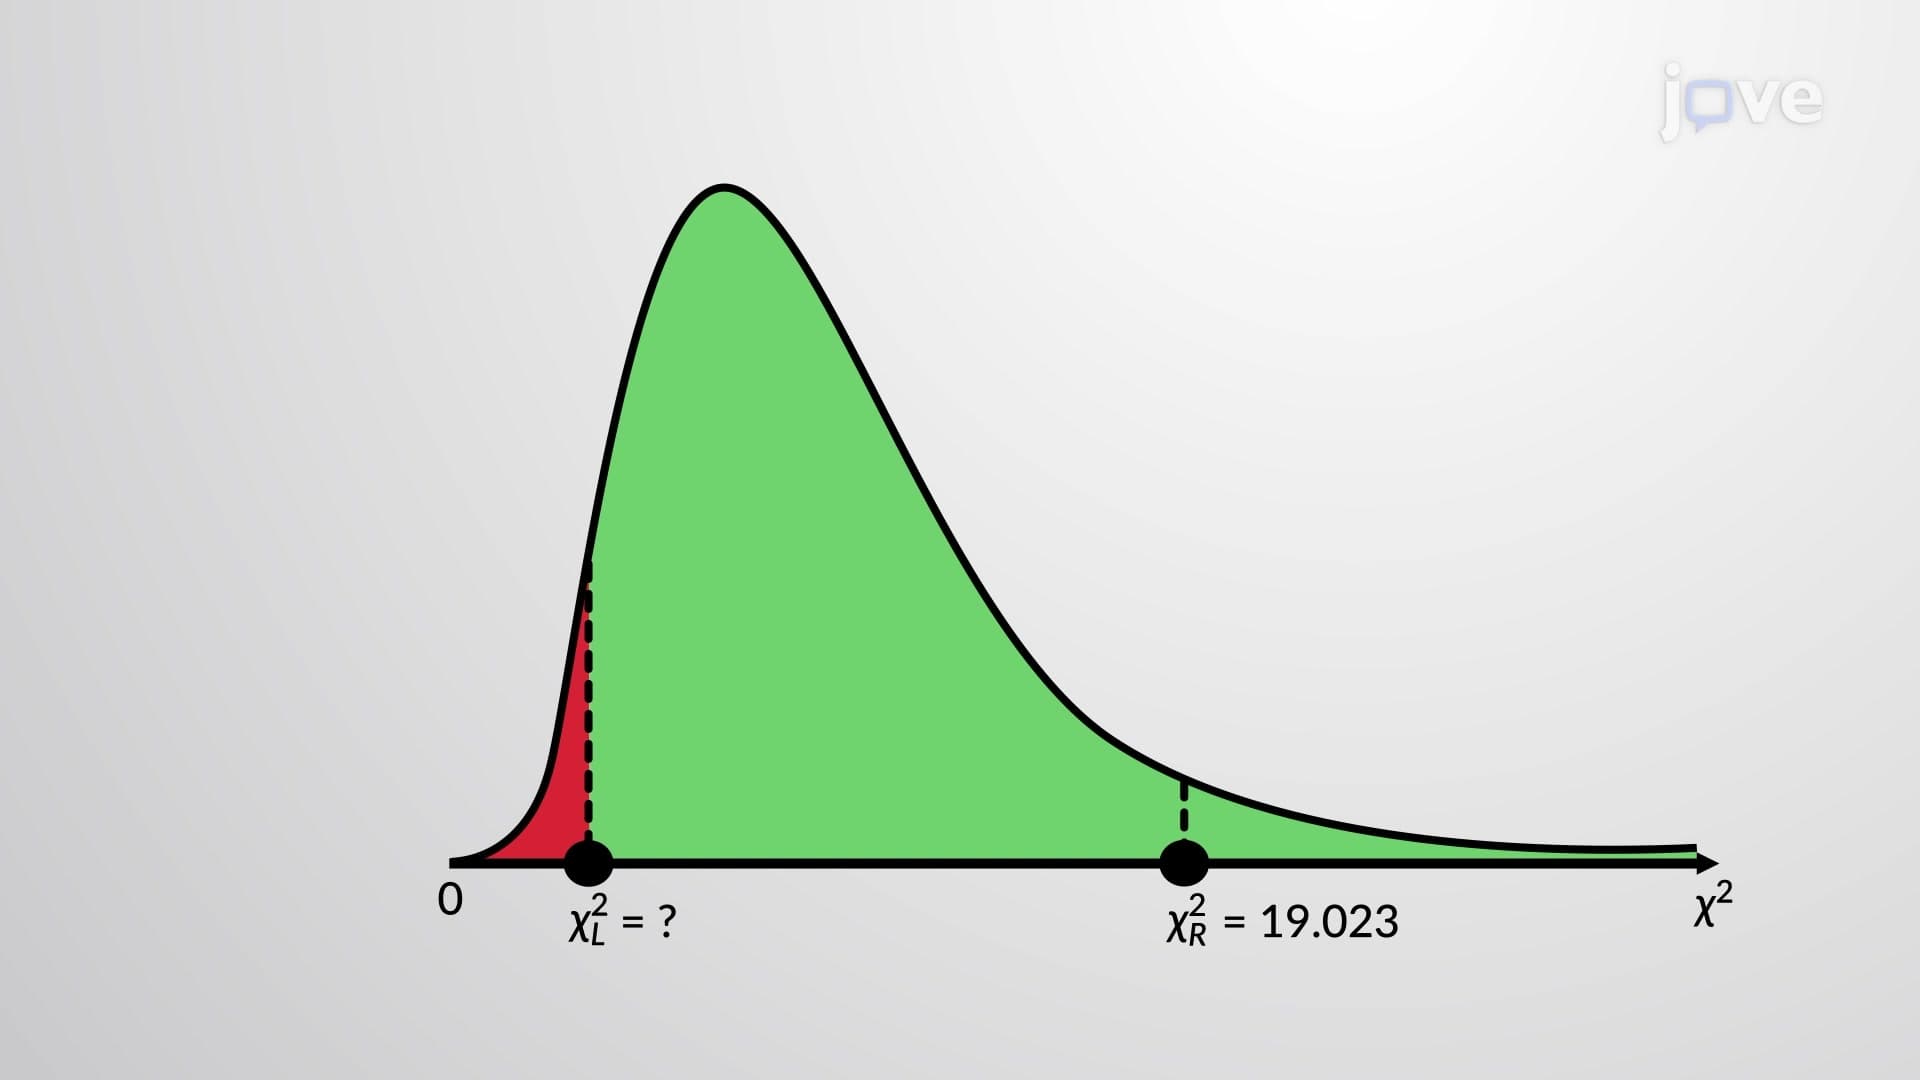
Chi-square and F distributions handle situations where normality assumptions break down. The chi-square distribution proves invaluable when analyzing categorical data or testing variance assumptions. Market researchers examining consumer preferences across different demographic categories often rely on chi-square tests to estimate population parameters from survey data.
F-distribution comes into play when comparing variances between groups or in analysis of variance (ANOVA) procedures. Educational researchers comparing standardized test score variations across different teaching methods use F-distribution to estimate population variance ratios and make informed conclusions about educational effectiveness.
These concepts appear frequently on AP Statistics exams, college statistics courses, and professional certification tests like the MCAT. Students must understand not just the mathematical mechanics but also the decision-making process for selecting appropriate distributions. The key lies in systematically evaluating sample size, known versus unknown parameters, and distribution shape assumptions before proceeding with estimation procedures.
Related Micro-courses