Loading video…

 15 Concepts
 70K views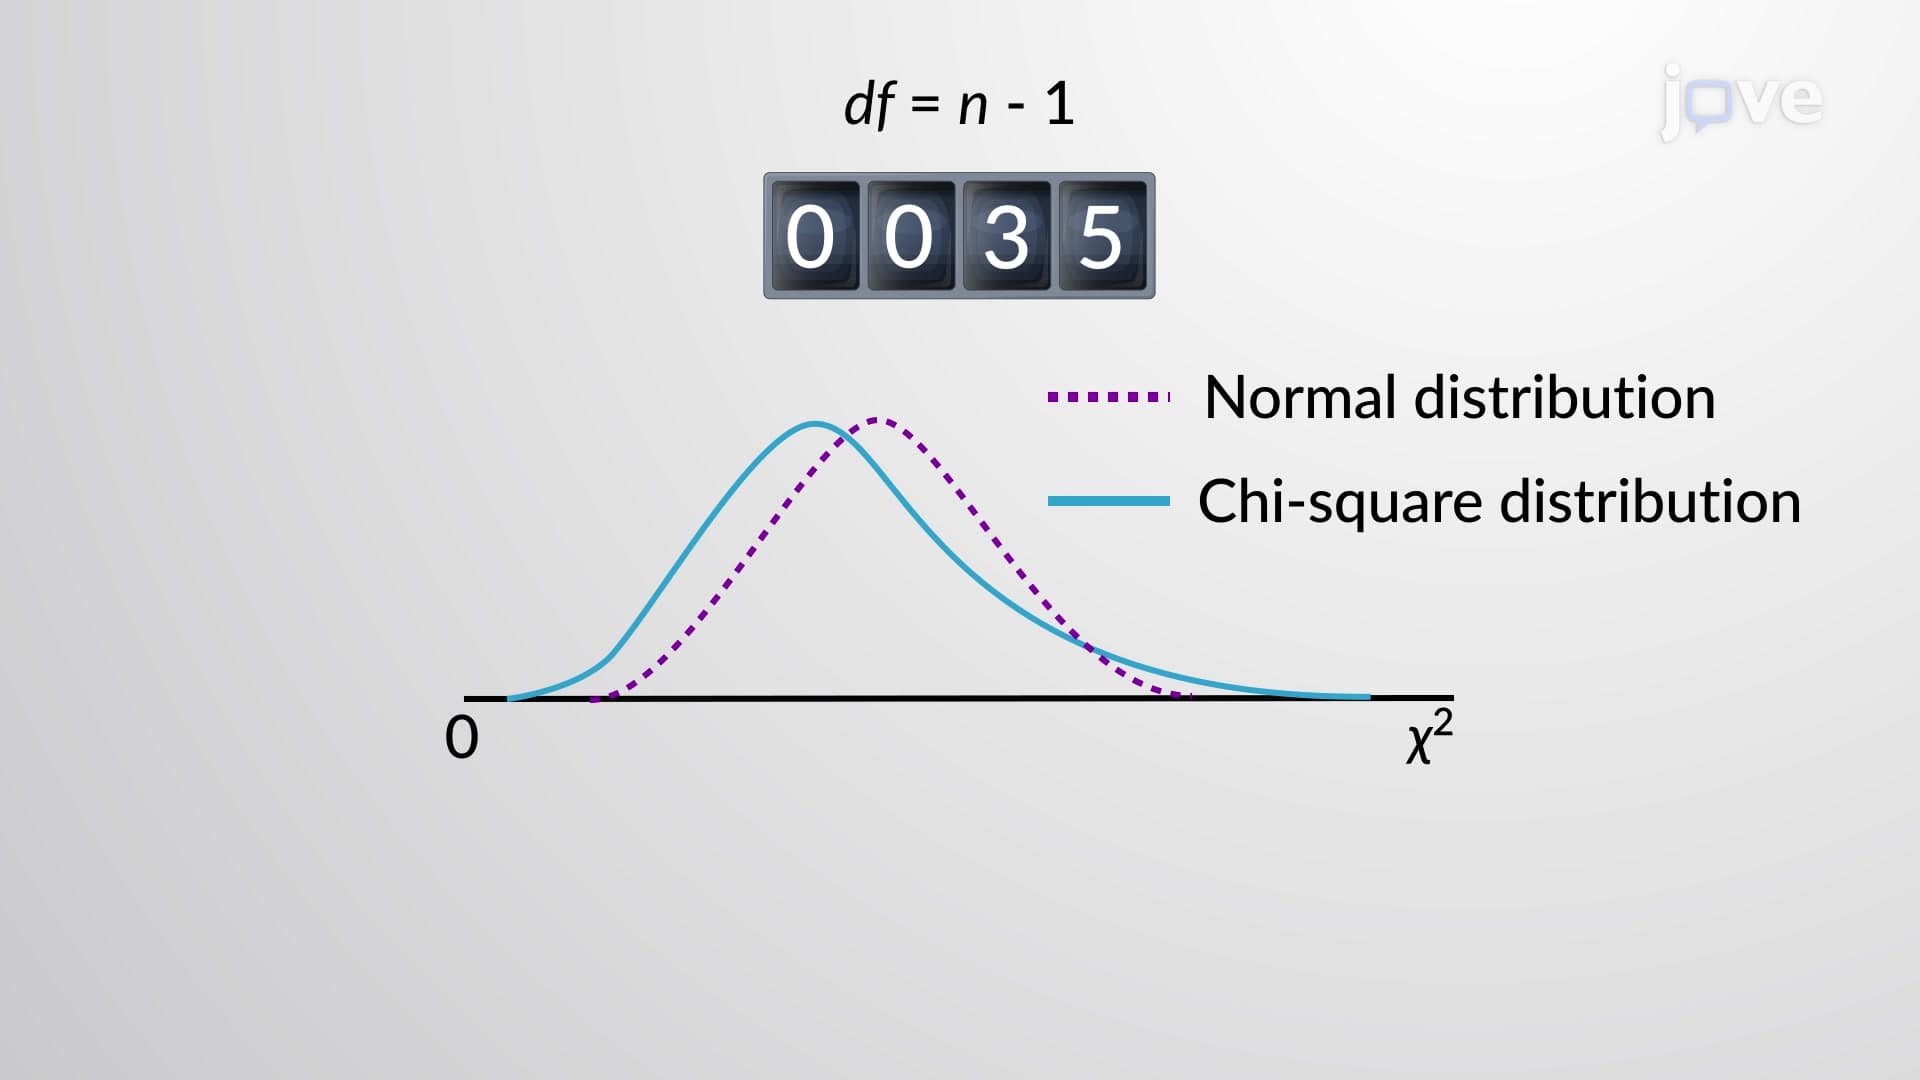

Video Summary: What Is Chi Square Distribution
Did you know that analyzing patient data at Johns Hopkins Hospital relies on a statistical distribution that's never negative? The chi square distribution emerges when sample variances from normally distributed populations create their own unique pattern-one that's right-skewed but becomes more symmetric as sample sizes grow. This fundamental concept helps researchers determine if observed differences in clinical trials or quality control processes are statistically significant. Watch the full video on JoVE Coach to master this concept with expert-led visuals and step-by-step explanations.
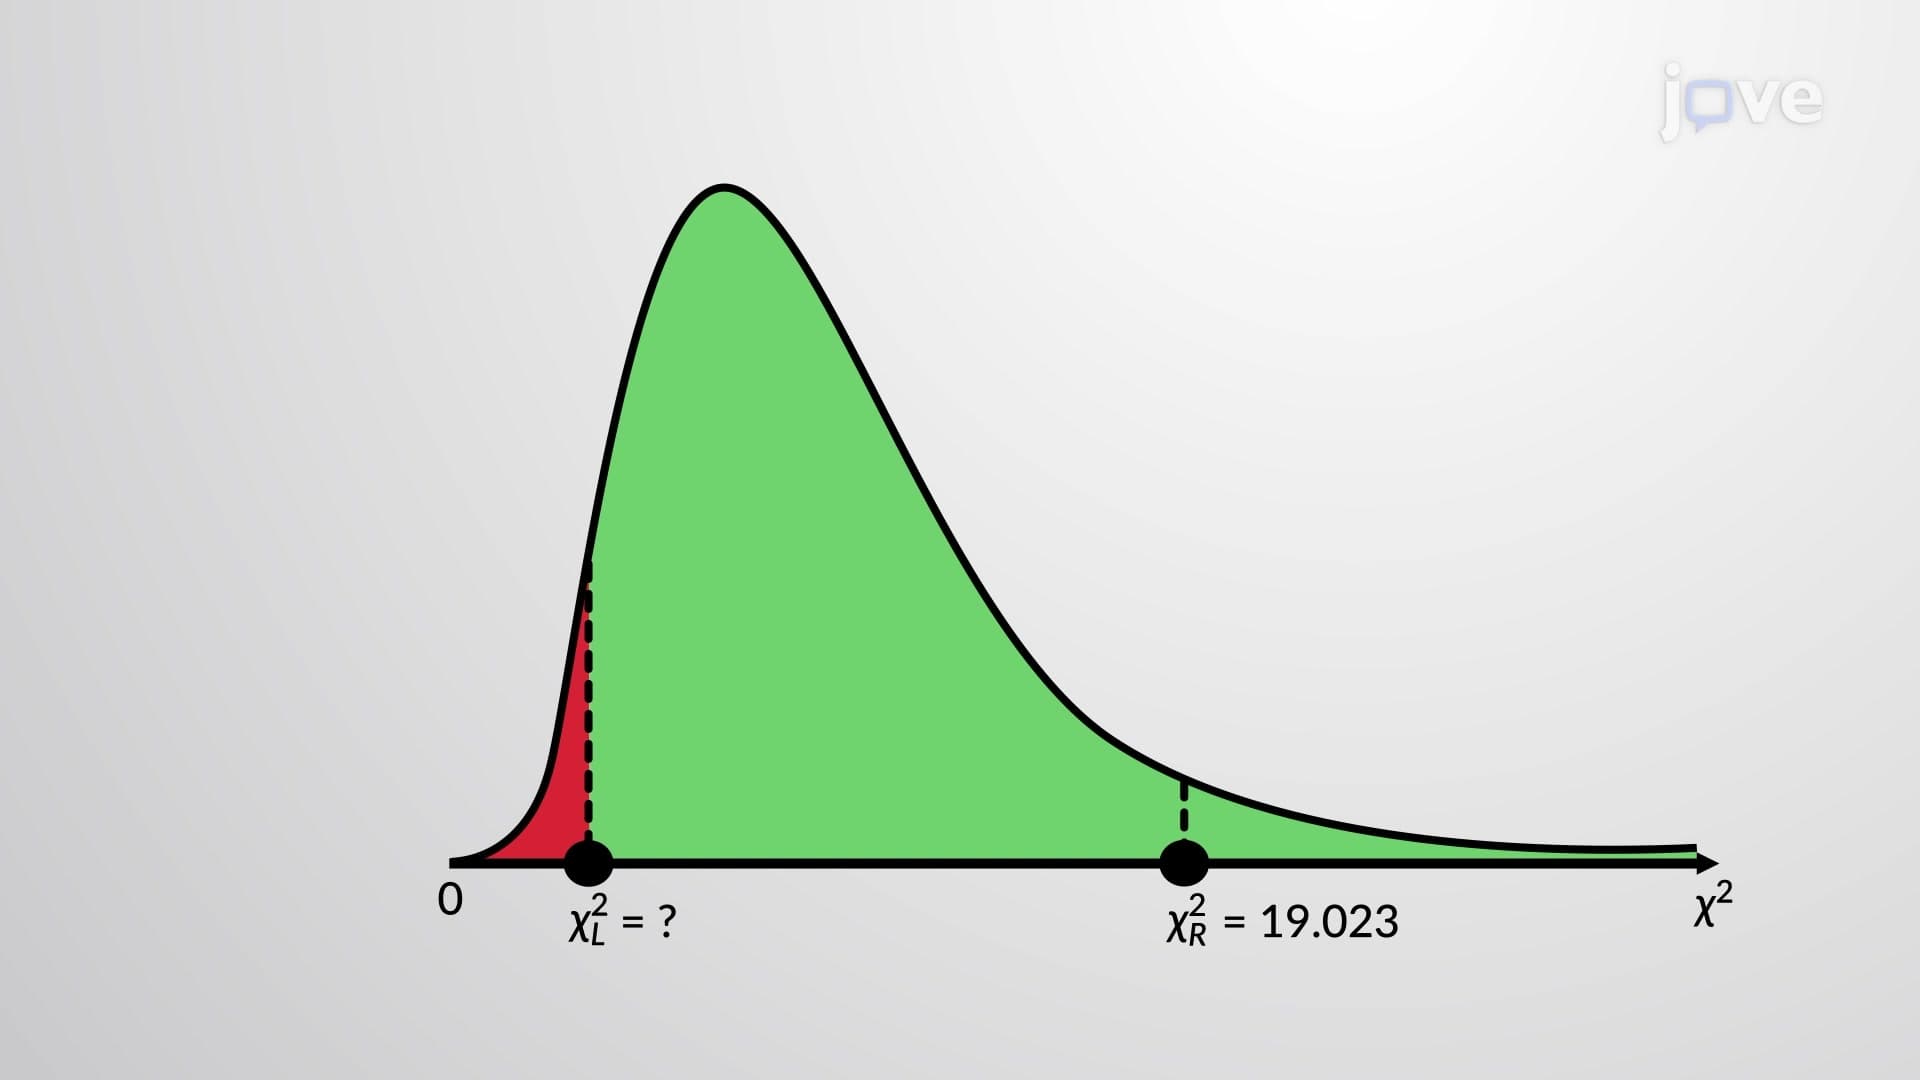
What is chi square distribution in its most essential form? This probability distribution arises from a specific mathematical relationship: when you take multiple independent samples from a normally distributed population and calculate their variances, the resulting pattern follows the chi square distribution. Unlike the familiar bell curve of normal distribution, this distribution exhibits a distinctive right-skewed shape that varies dramatically based on degrees of freedom.
The chi square distribution definition centers on several key mathematical properties. First, all chi square values must be non-negative-they can equal zero or any positive number, but never dip below zero. This constraint exists because the distribution deals with squared deviations, and squares of real numbers cannot be negative.
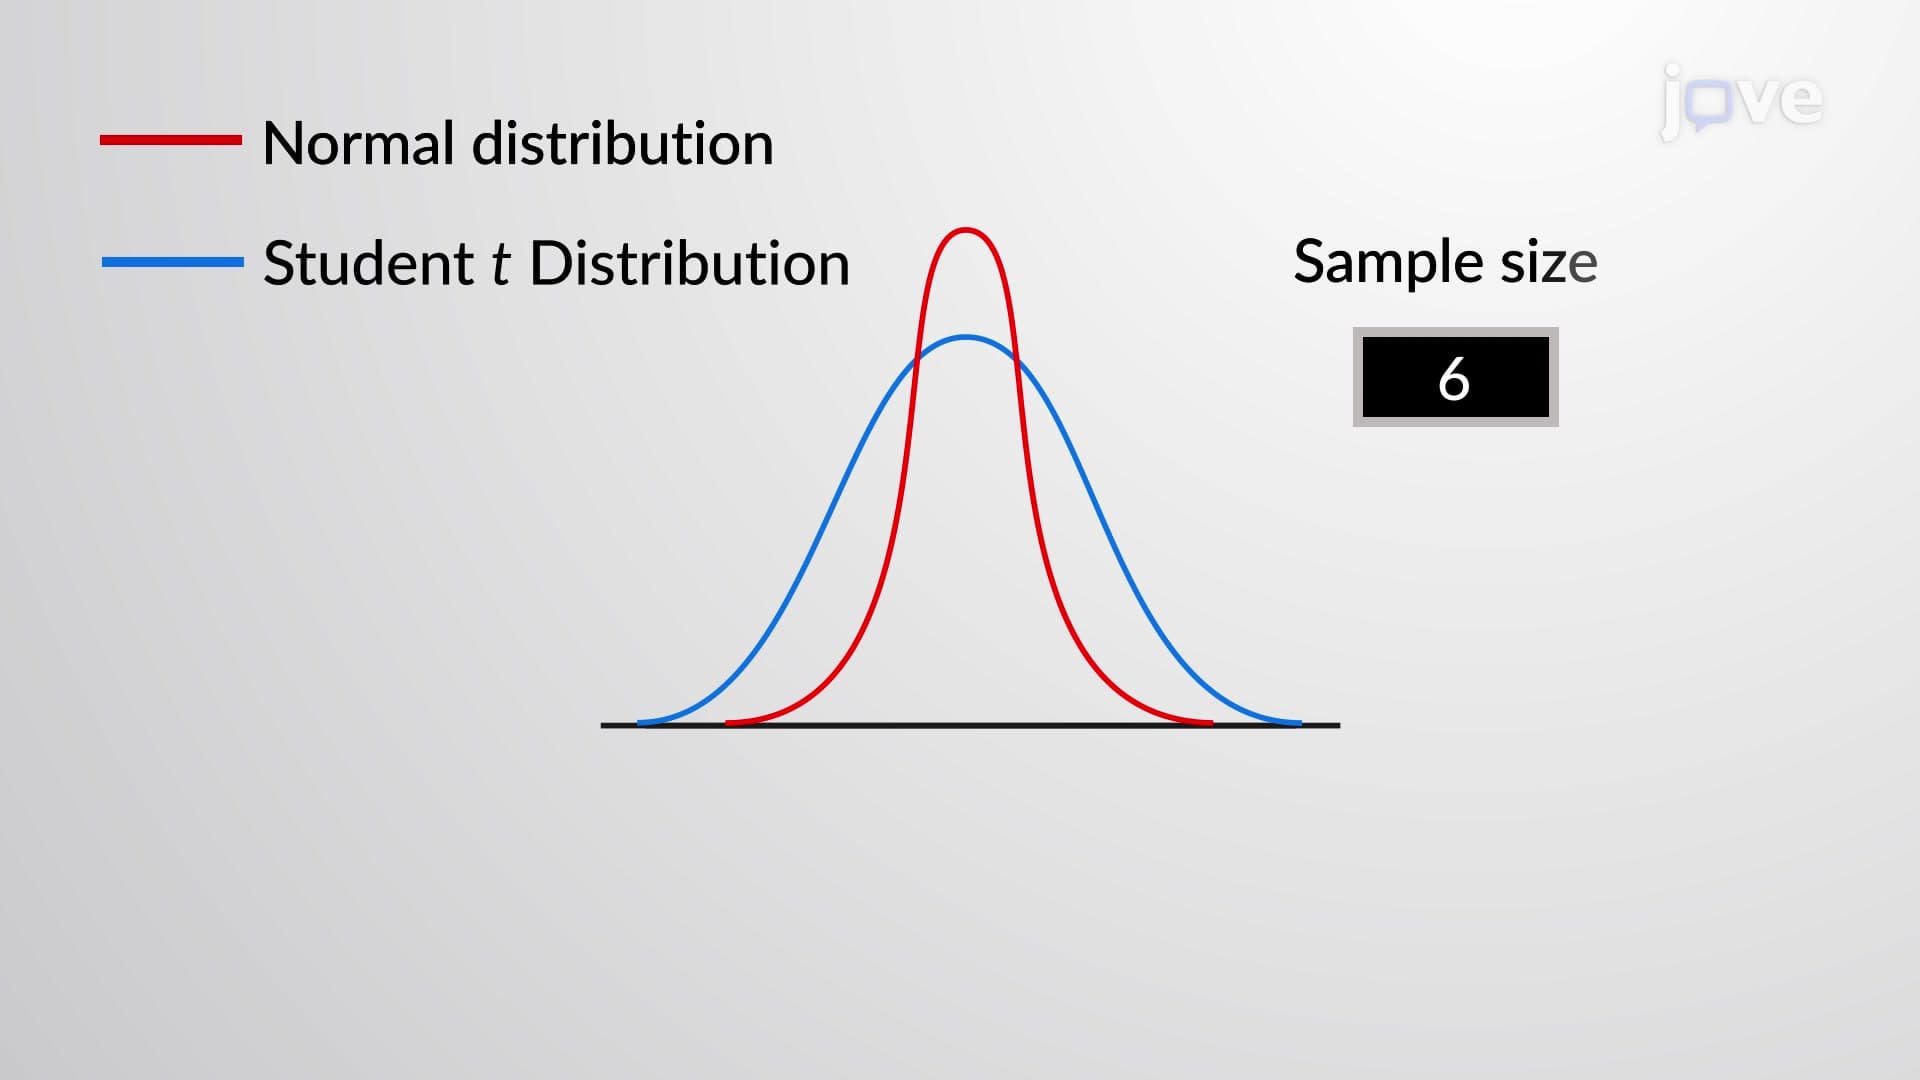
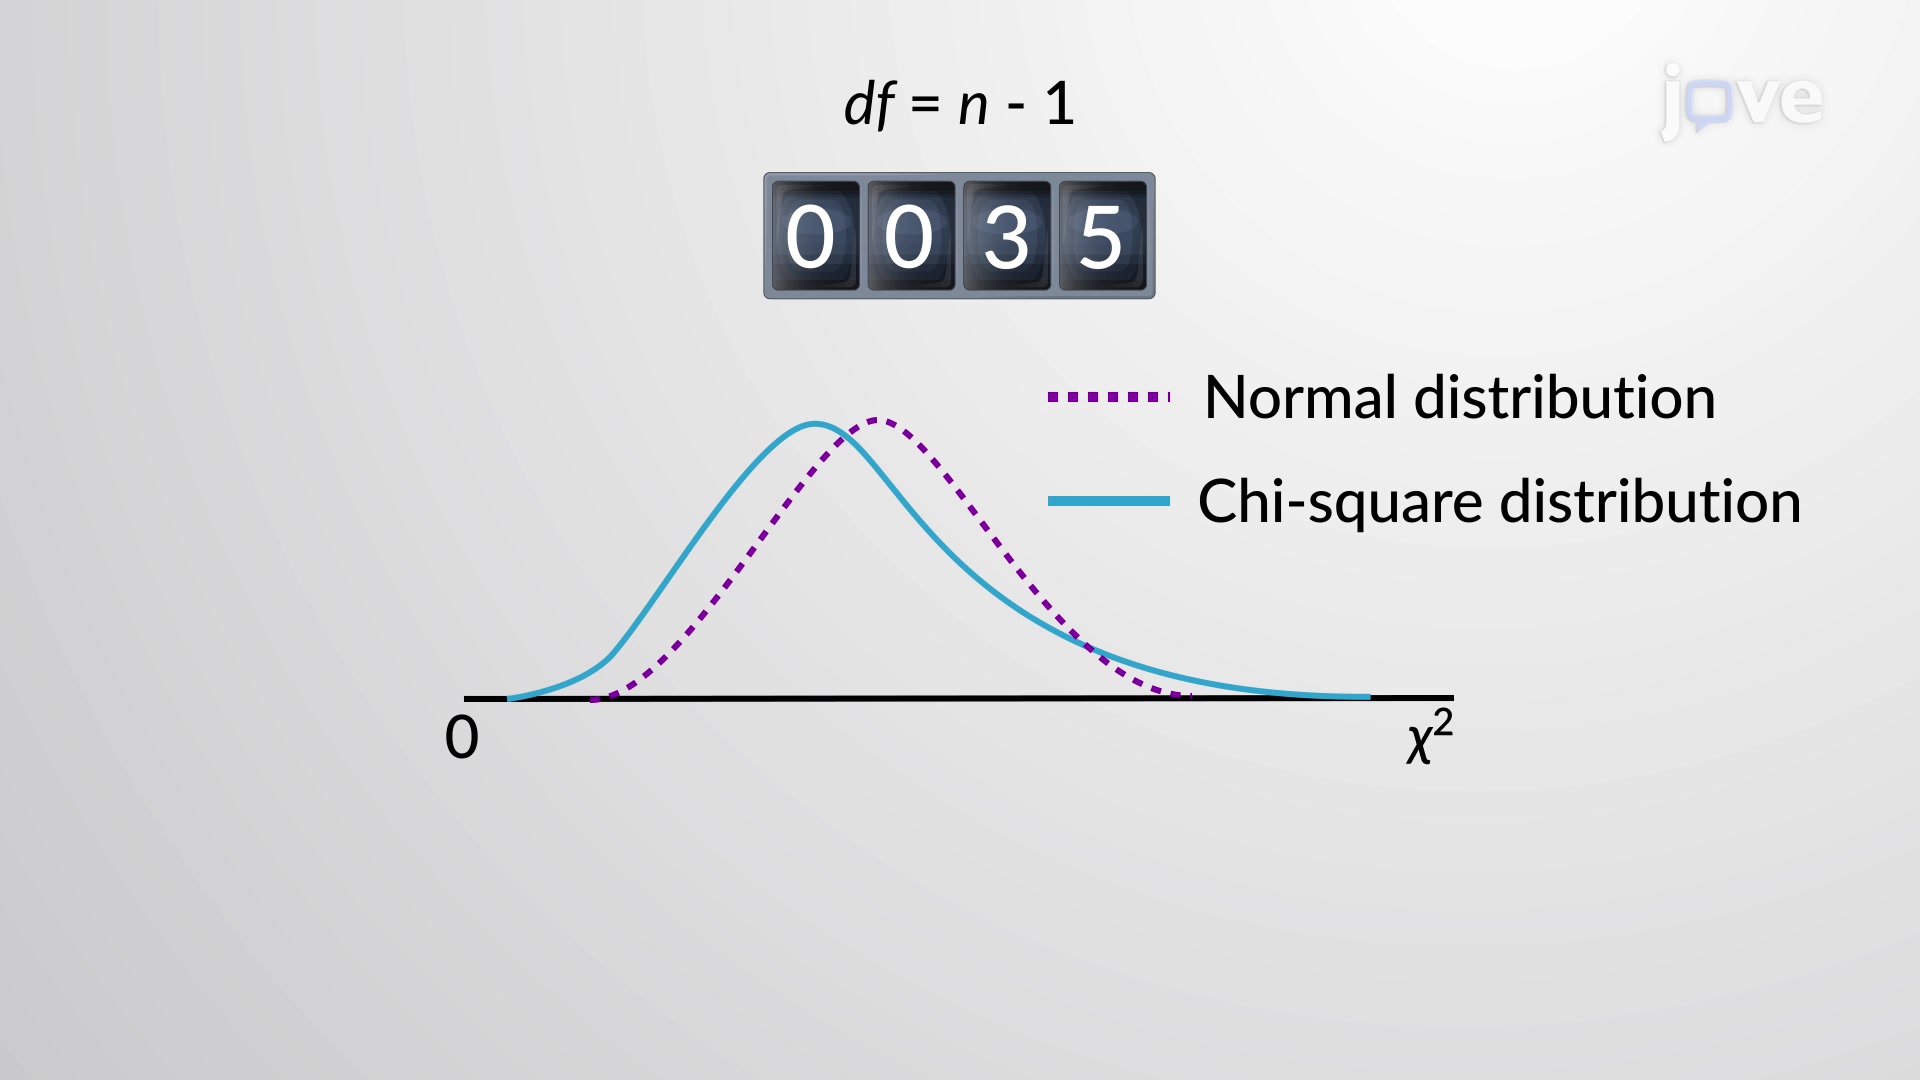
The distribution's shape transforms predictably as degrees of freedom increase. With few degrees of freedom (like 1 or 2), the curve appears heavily right-skewed with a steep initial decline. However, as degrees of freedom approach 30 or higher, the distribution gradually assumes a more symmetric, bell-like appearance. When degrees of freedom exceed 90, the chi square distribution so closely resembles a normal distribution that statisticians often use normal approximations for computational convenience.
Students preparing for the AP Statistics exam frequently encounter chi square distribution problems involving goodness-of-fit tests. For example, testing whether observed frequencies of genetic traits match expected Mendelian ratios requires chi square analysis. Similarly, college-level biostatistics courses use this distribution to analyze whether treatment groups in clinical trials show independent responses.
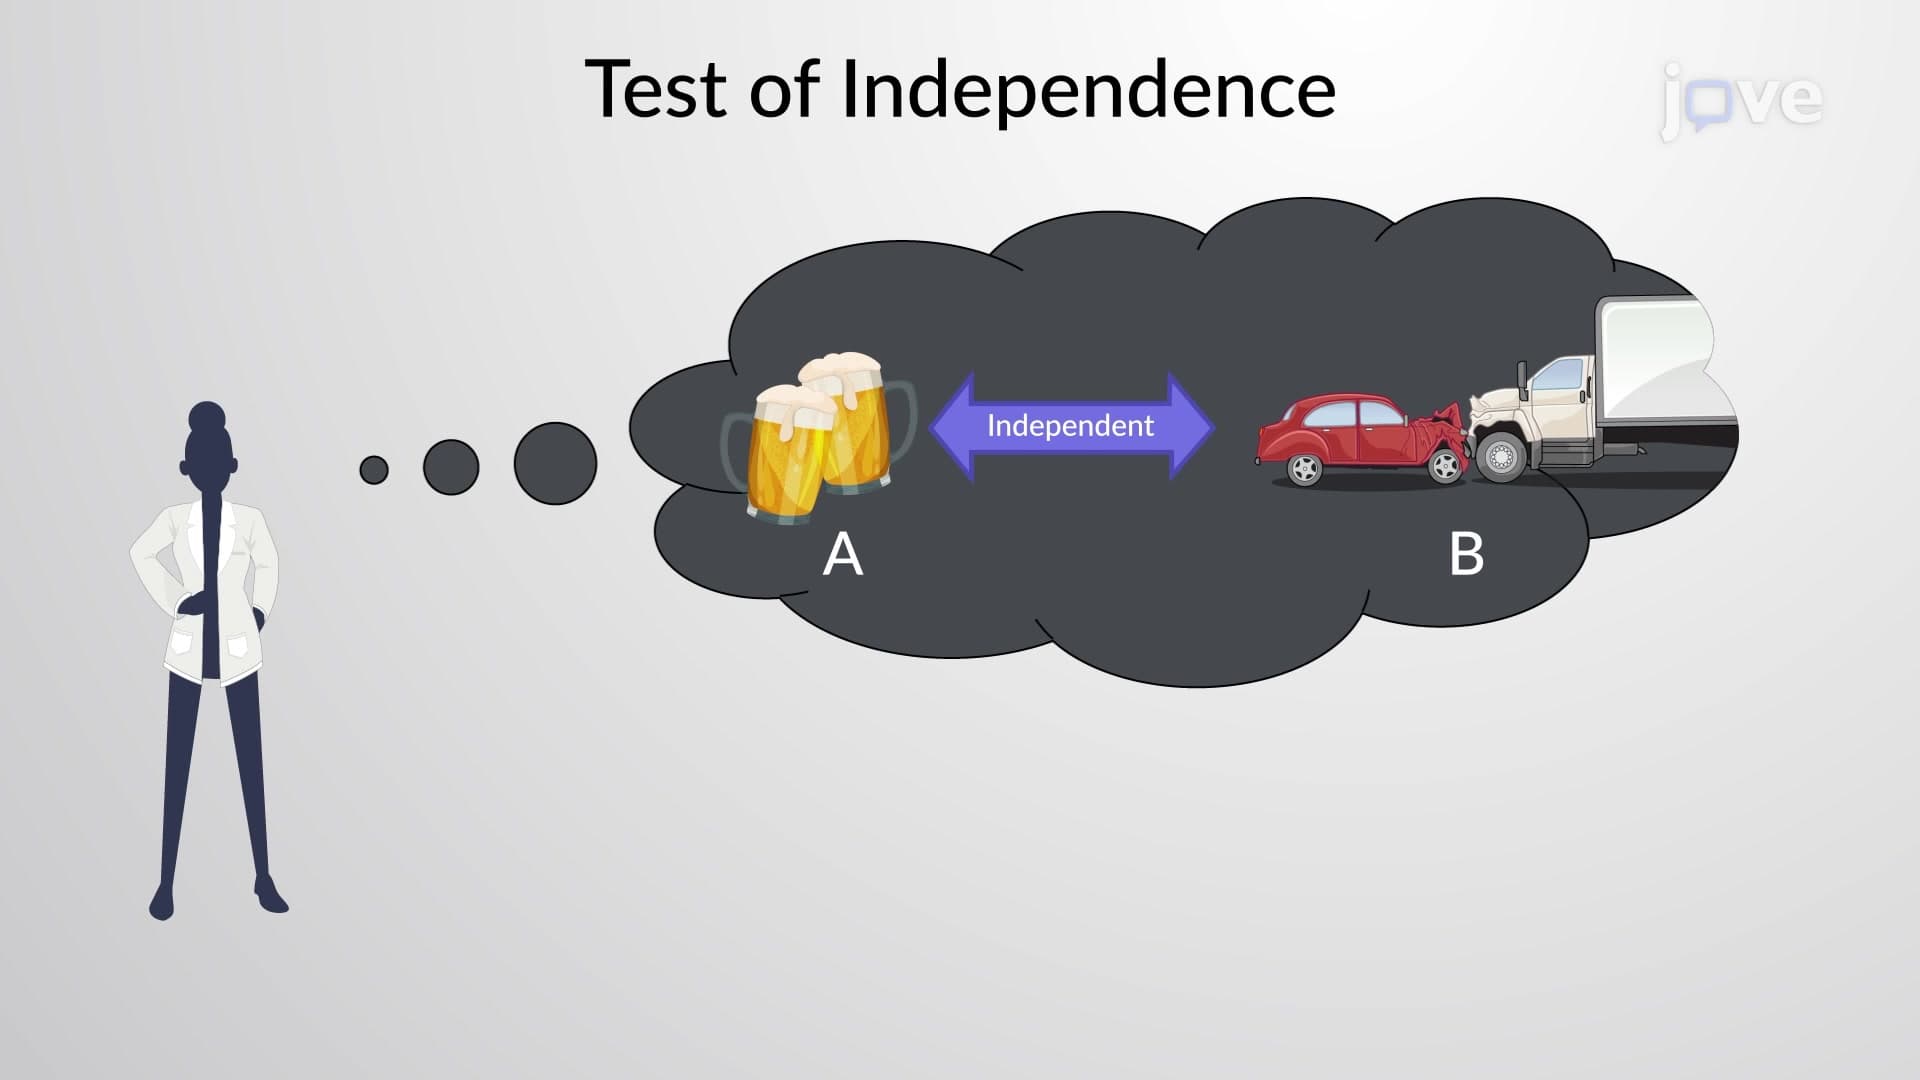
In professional settings, pharmaceutical companies conducting FDA drug trials rely heavily on chi square tests for independence. When researchers at the CDC analyze whether vaccination rates vary significantly across different demographic groups, they apply chi square methodology to determine statistical significance.
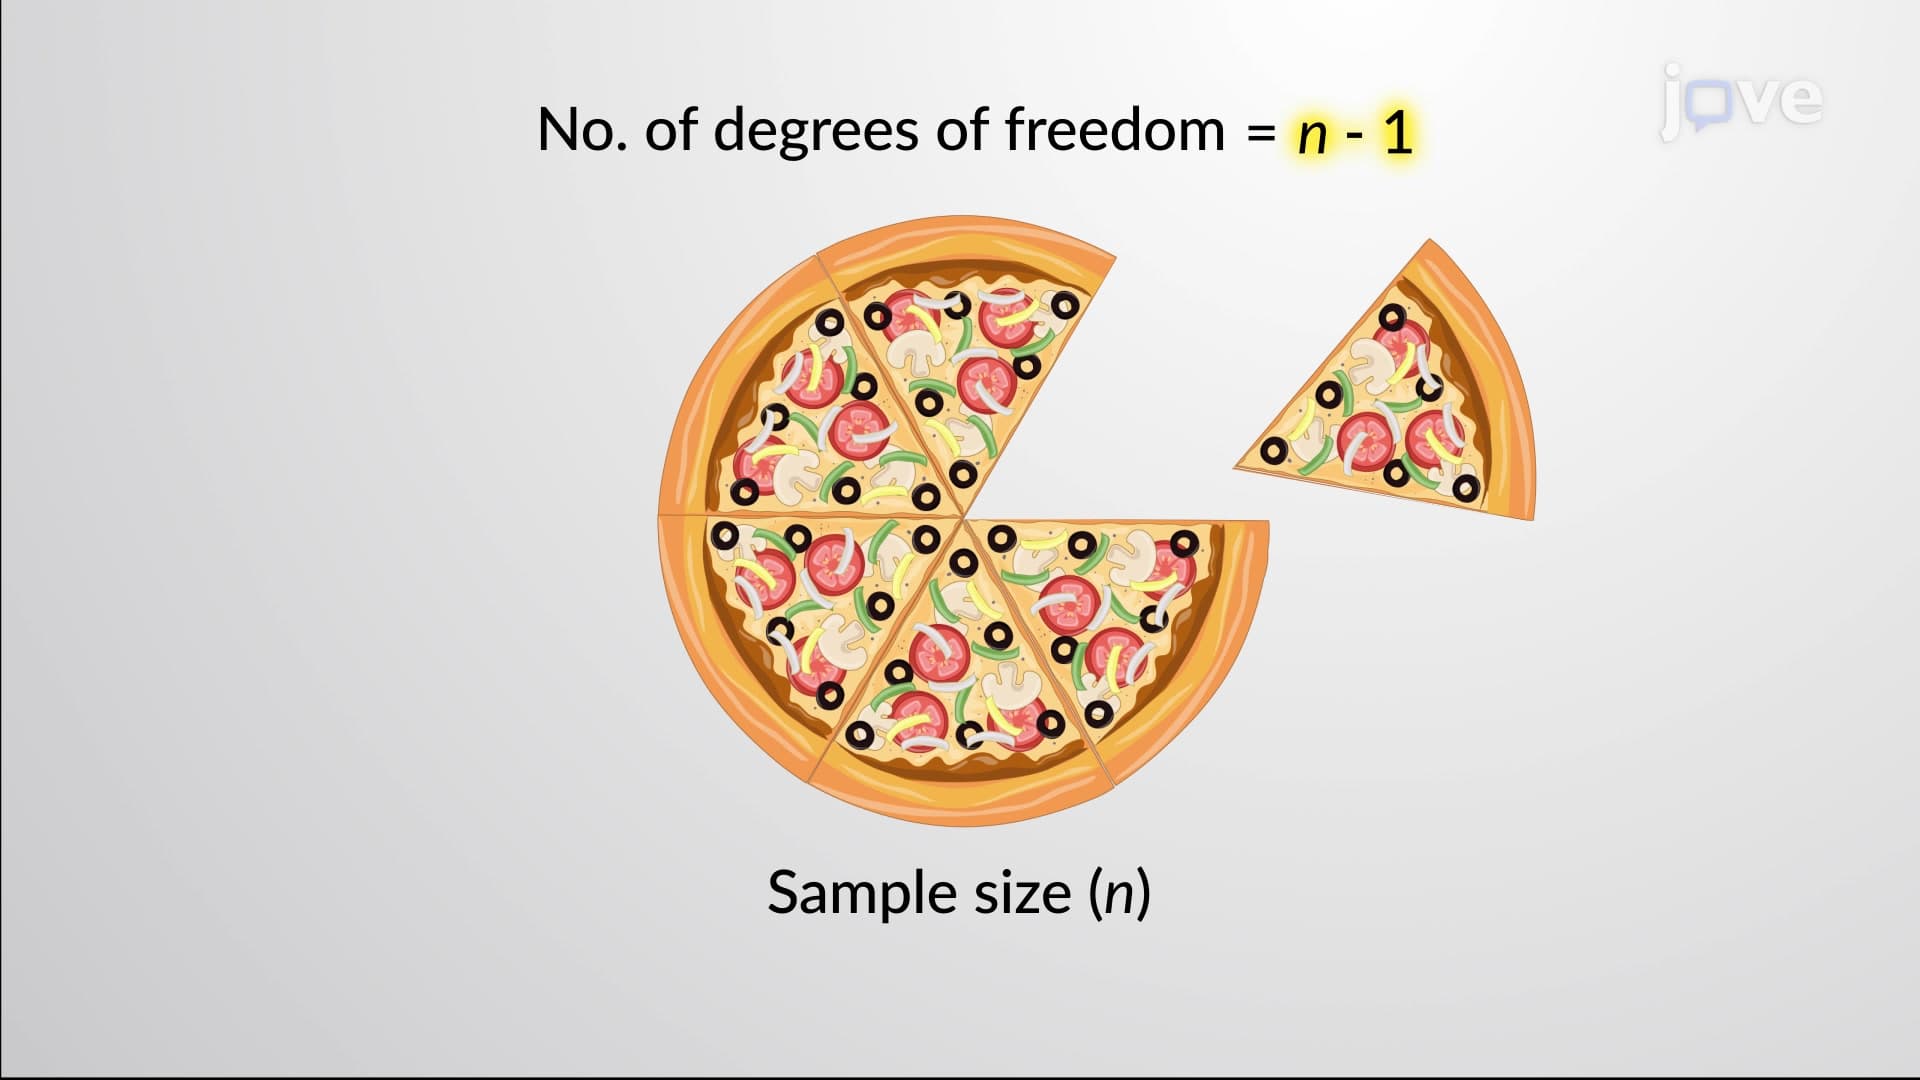
Understanding chi square distribution requires mastering degrees of freedom calculation. For single-variable analyses, degrees of freedom typically equal n-1 (sample size minus one). This parameter directly controls the distribution's shape and critical values used in hypothesis testing. Students taking college statistics courses learn to identify degrees of freedom from contingency table dimensions, sample sizes, and research design specifications-skills essential for MCAT preparation and graduate-level research methodology courses.
Related Micro-courses