Loading video…


 15 Concepts
 70K views

Video Summary: What Is Contingency Table
Did you know that understanding vaccination effectiveness during the COVID-19 pandemic relied heavily on contingency tables? A contingency table is a statistical tool that organizes data to reveal relationships between two categorical variables, like infection status and vaccination level in a population study. For instance, health departments across the United States used contingency tables to analyze whether vaccinated individuals had lower infection rates than unvaccinated ones. Watch the full video on JoVE Coach to master this concept with expert-led visuals and step-by-step explanations.
A contingency table, also known as a cross-tabulation or two-way frequency table, serves as a fundamental statistical tool for examining relationships between two categorical variables. Unlike numerical data that deals with measurements, categorical variables represent distinct groups or categories-such as gender (male/female), education level (high school/college/graduate), or treatment response (improved/no change/worse).
The table's structure follows a systematic grid format where one variable defines the rows and another defines the columns. Each cell within this grid contains the frequency count of observations that fall into both categories simultaneously. This organization makes patterns and relationships immediately visible to researchers and students alike.
Consider how the Centers for Disease Control and Prevention (CDC) uses contingency tables to analyze vaccine effectiveness. In a study examining COVID-19 outcomes, researchers might create a table with vaccination status (unvaccinated, partially vaccinated, fully vaccinated) as columns and infection outcome (infected, not infected) as rows. This arrangement reveals whether vaccination correlates with reduced infection rates across different population groups.
Similarly, clinical trials for new medications rely heavily on contingency tables. The Food and Drug Administration (FDA) requires pharmaceutical companies to present safety and efficacy data in clear tabular formats. A drug trial might compare treatment groups (placebo vs. active drug) against outcomes (side effects vs. no side effects), helping regulators make approval decisions based on statistical evidence.
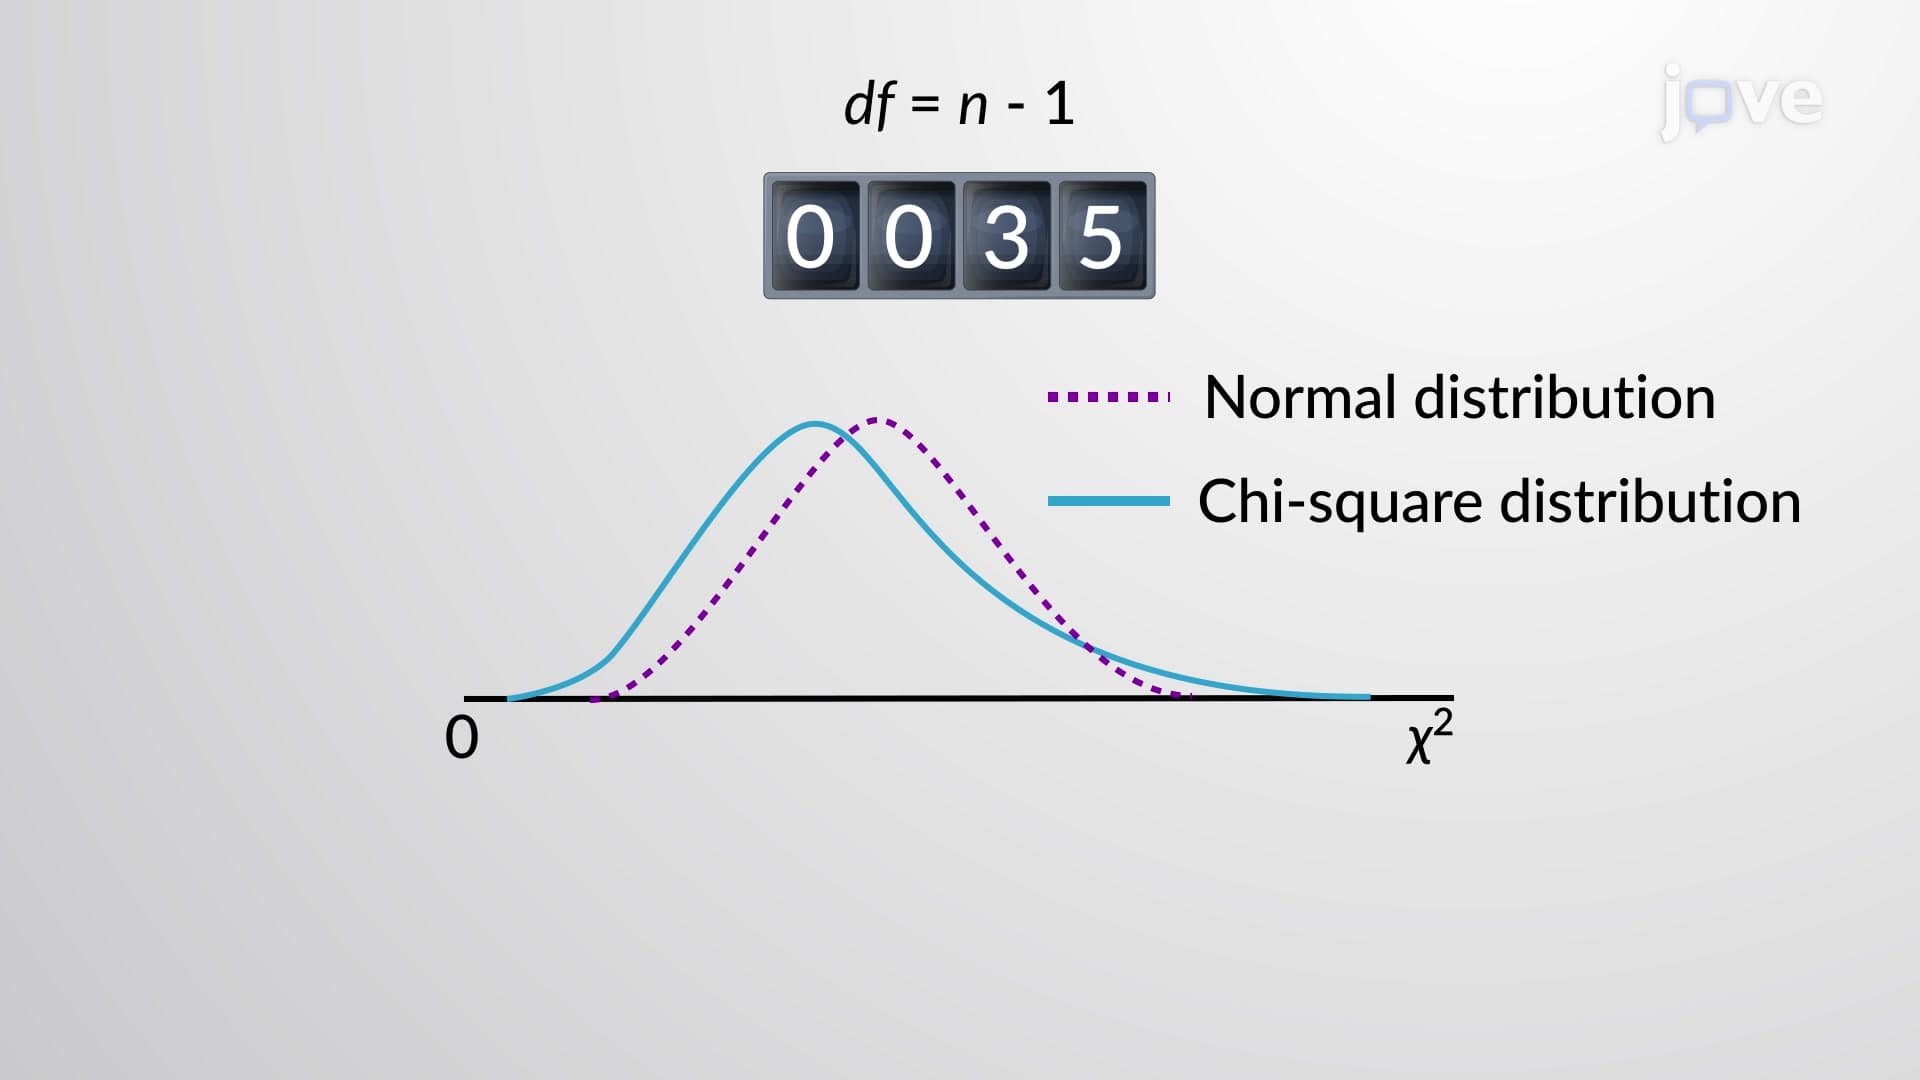
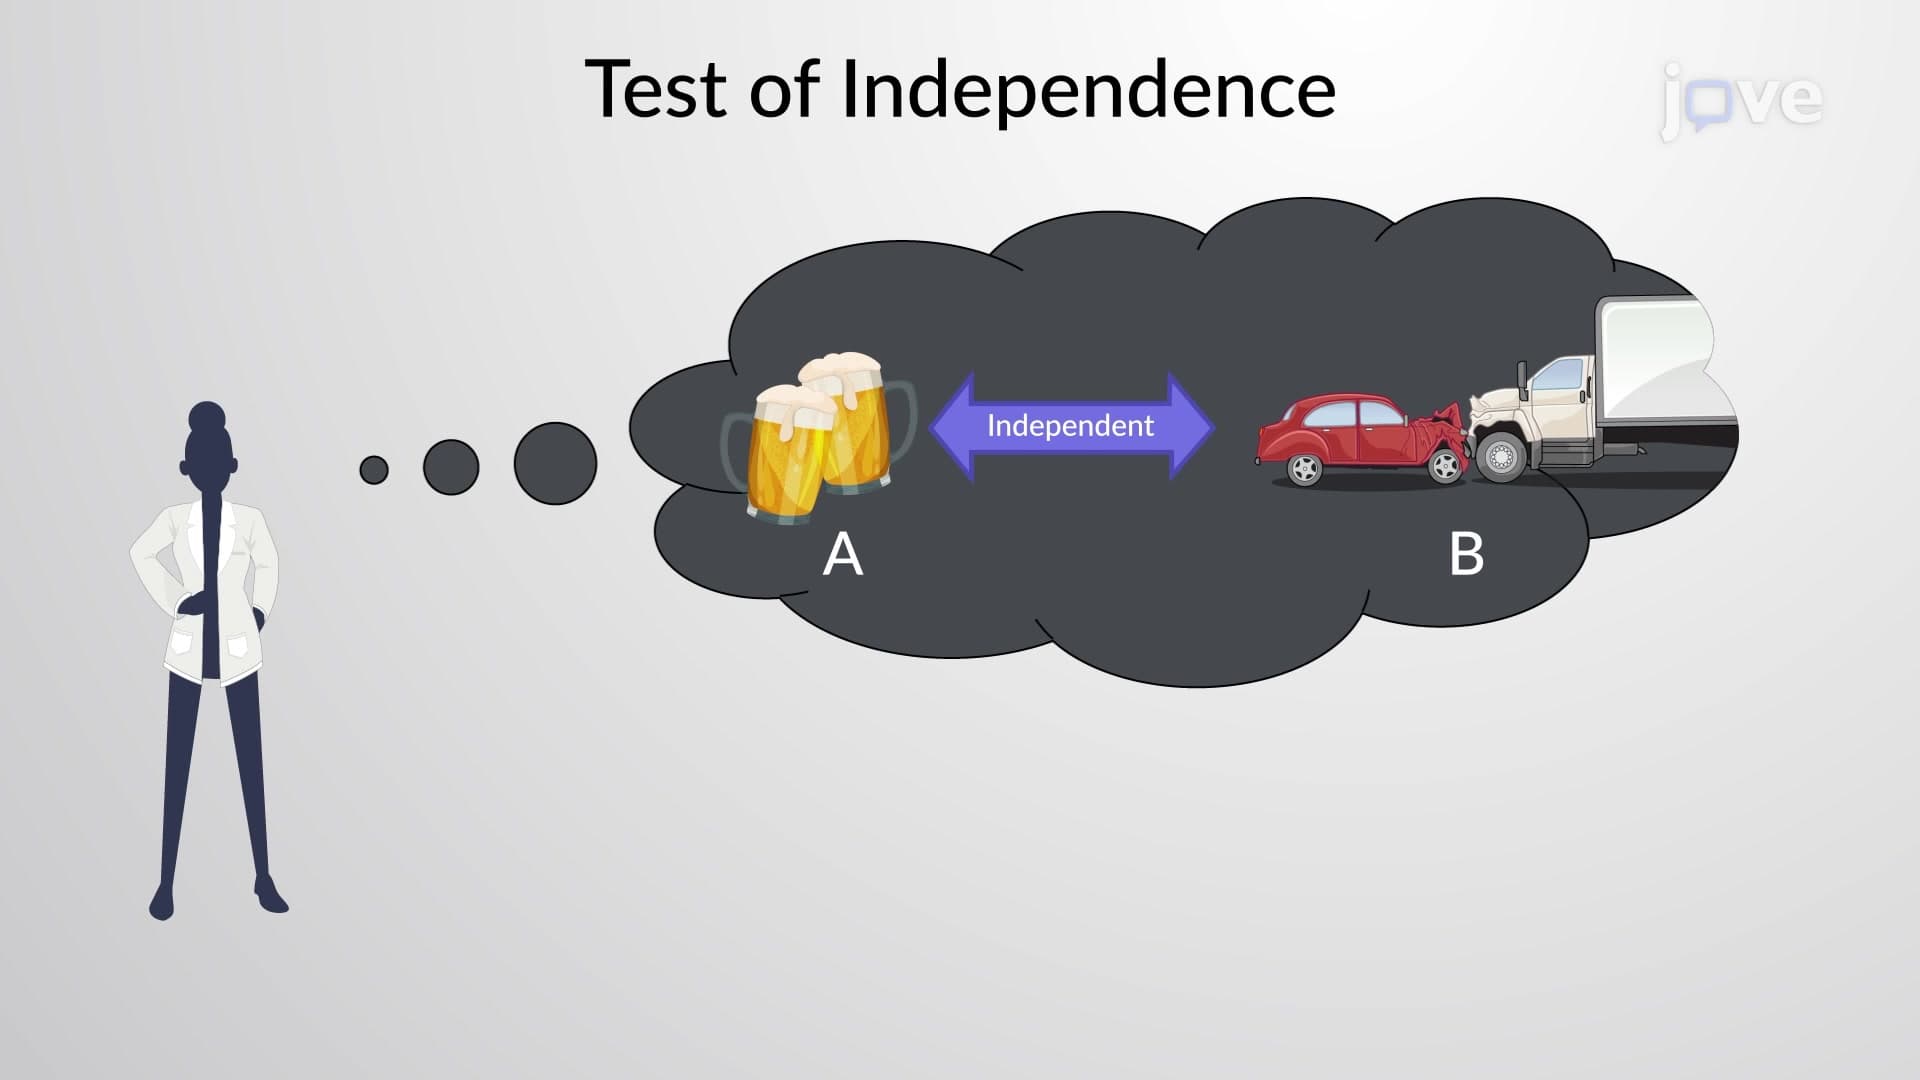
Beyond simple data organization, contingency tables enable sophisticated statistical testing through chi-square tests of independence. This process compares observed frequencies (what actually happened) with expected frequencies (what would happen if variables were truly independent). When the chi-square statistic exceeds critical values, researchers can conclude that a significant relationship exists between the variables.
For AP Statistics students, mastering contingency tables proves essential for exam success. The College Board frequently includes questions requiring students to interpret two-way tables, calculate conditional probabilities, and perform chi-square tests. Understanding these concepts also prepares students for college-level statistics courses and research methods classes.
Students encounter contingency tables across multiple disciplines. In psychology courses, they might analyze survey data comparing stress levels across different student populations. Business students use them to examine consumer preferences across demographic groups. Even in biology classes, genetic crosses and inheritance patterns often appear in contingency table format, helping students understand independent assortment and gene linkage concepts.
Related Micro-courses