Loading video…


 15 Concepts
 70K views

Video Summary: What Is F Distribution
Did you know that the same statistical tool used to analyze differences in SAT scores between states also helps pharmaceutical companies determine if new medications are more effective than existing treatments? The f distribution forms the backbone of these comparisons by measuring variance ratios between normally distributed populations. Named after Sir Ronald Fisher, this asymmetric probability distribution features two degrees of freedom parameters that shape its curve, making it essential for F-tests and ANOVA procedures used throughout American healthcare research and educational assessment. Watch the full video on JoVE Coach to master this concept with expert-led visuals and step-by-step explanations.
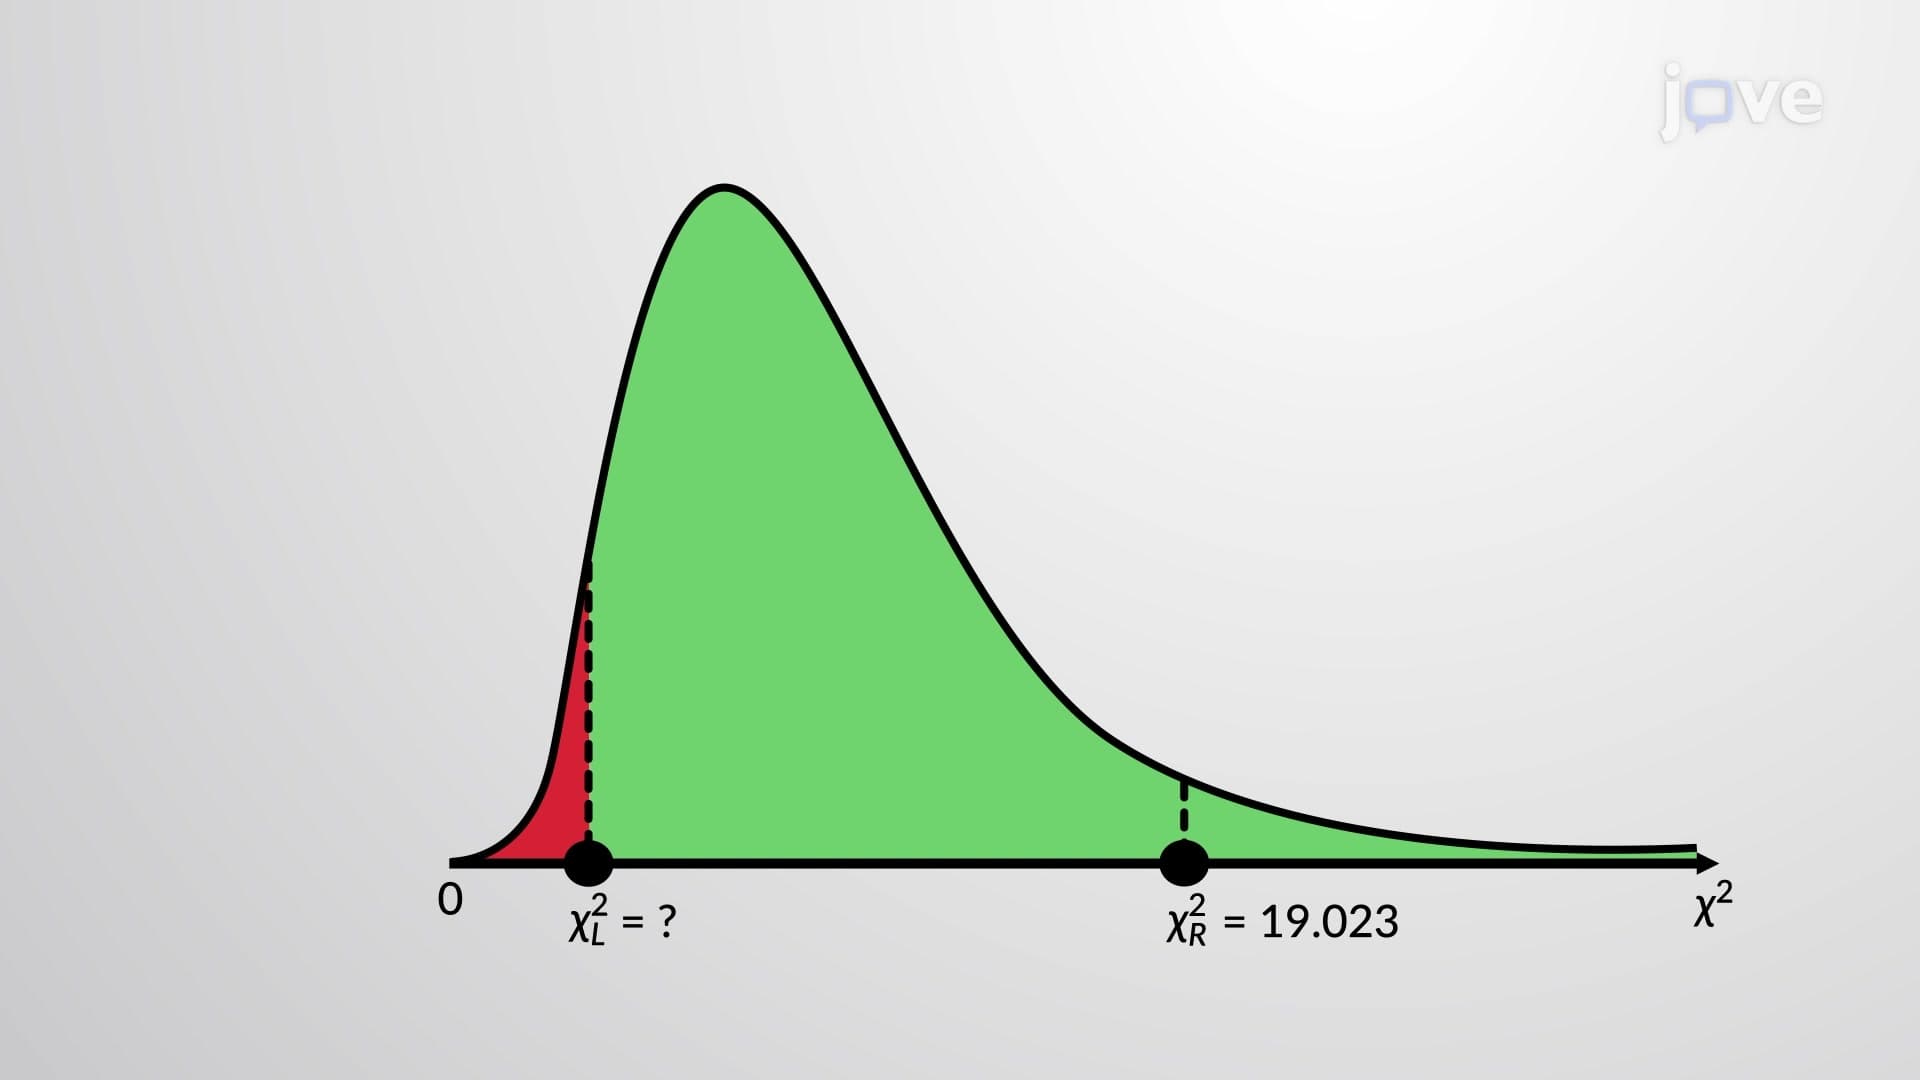
The F distribution represents one of the most important continuous probability distributions in statistical analysis, serving as the theoretical foundation for comparing variances between populations. Unlike symmetric distributions such as the normal distribution, the F distribution displays a characteristic right-skewed shape that begins at zero and extends infinitely to the right, never producing negative values since it represents a ratio of variances.
This distribution emerges naturally when we calculate the F statistic: F = (sample variance 1)/(sample variance 2). By convention, statisticians typically place the larger sample variance in the numerator to ensure the F statistic remains greater than or equal to one, simplifying interpretation and table lookups.
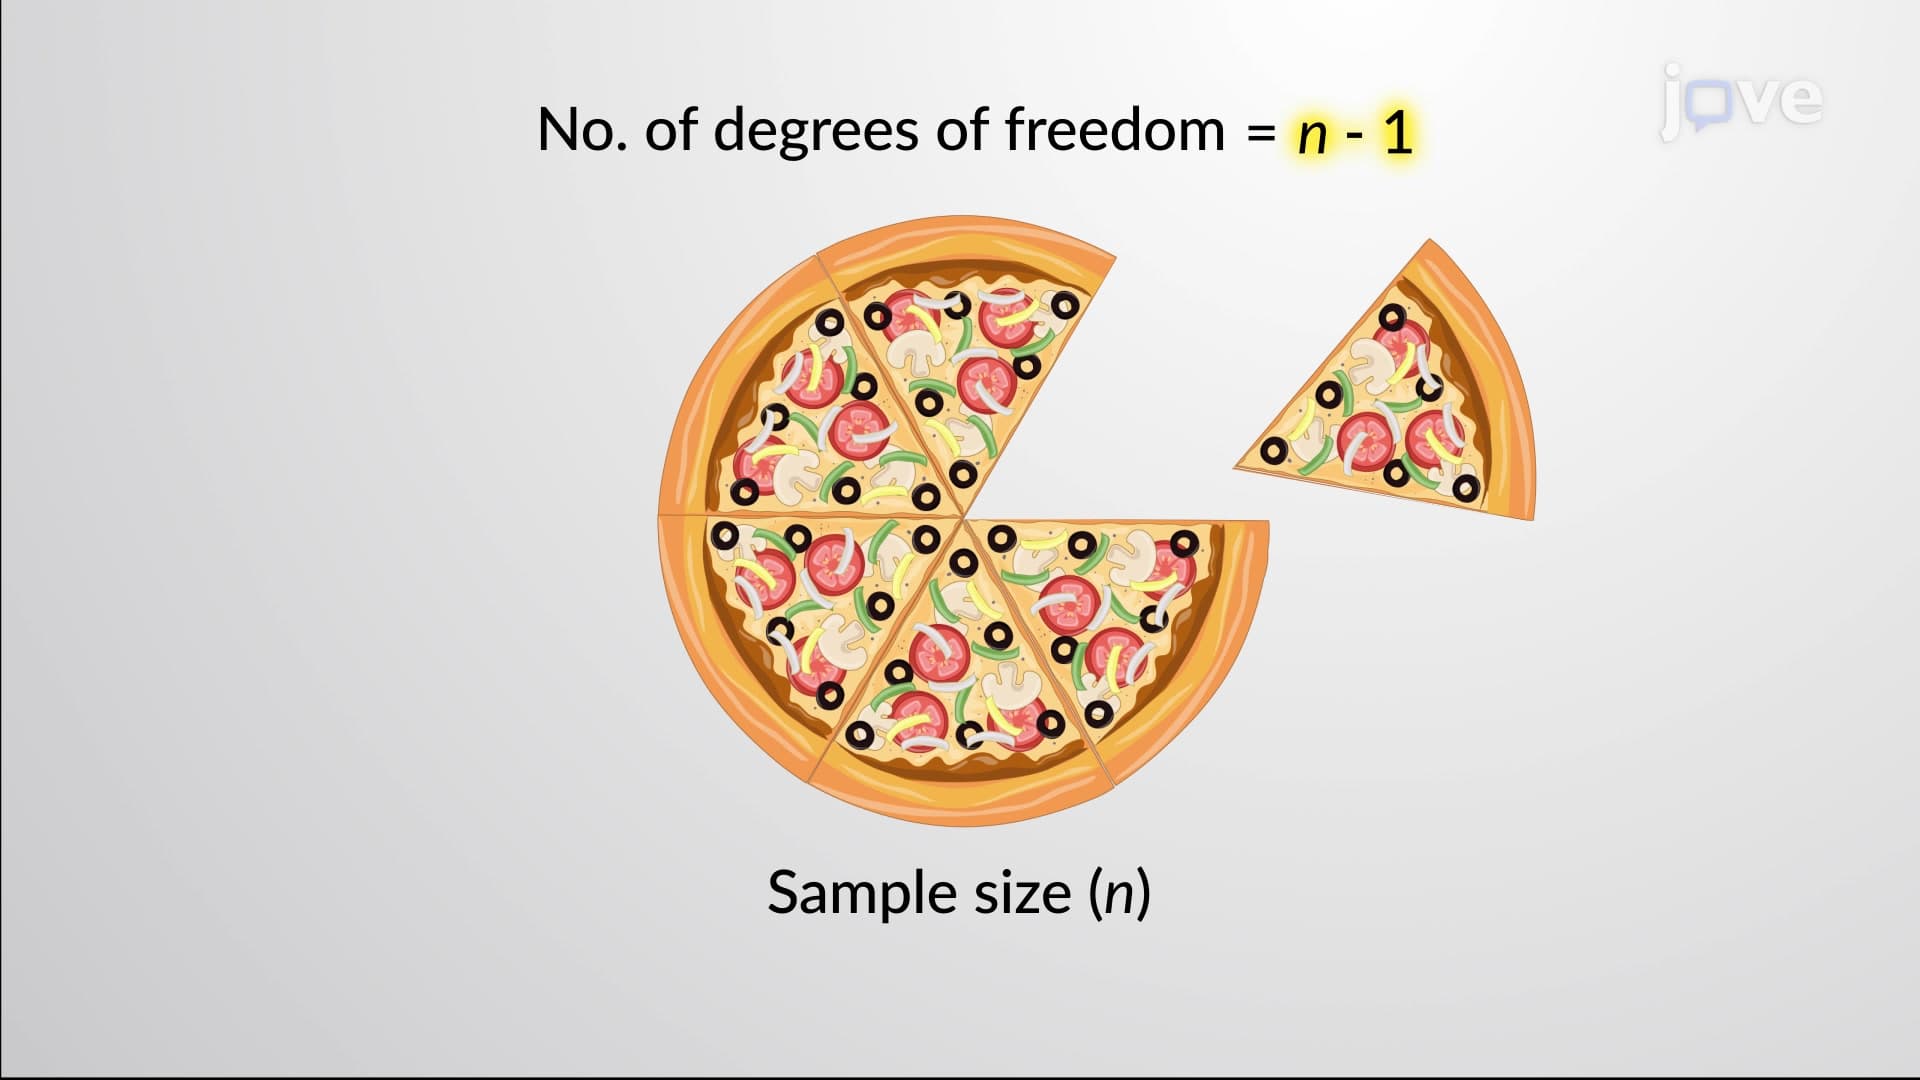
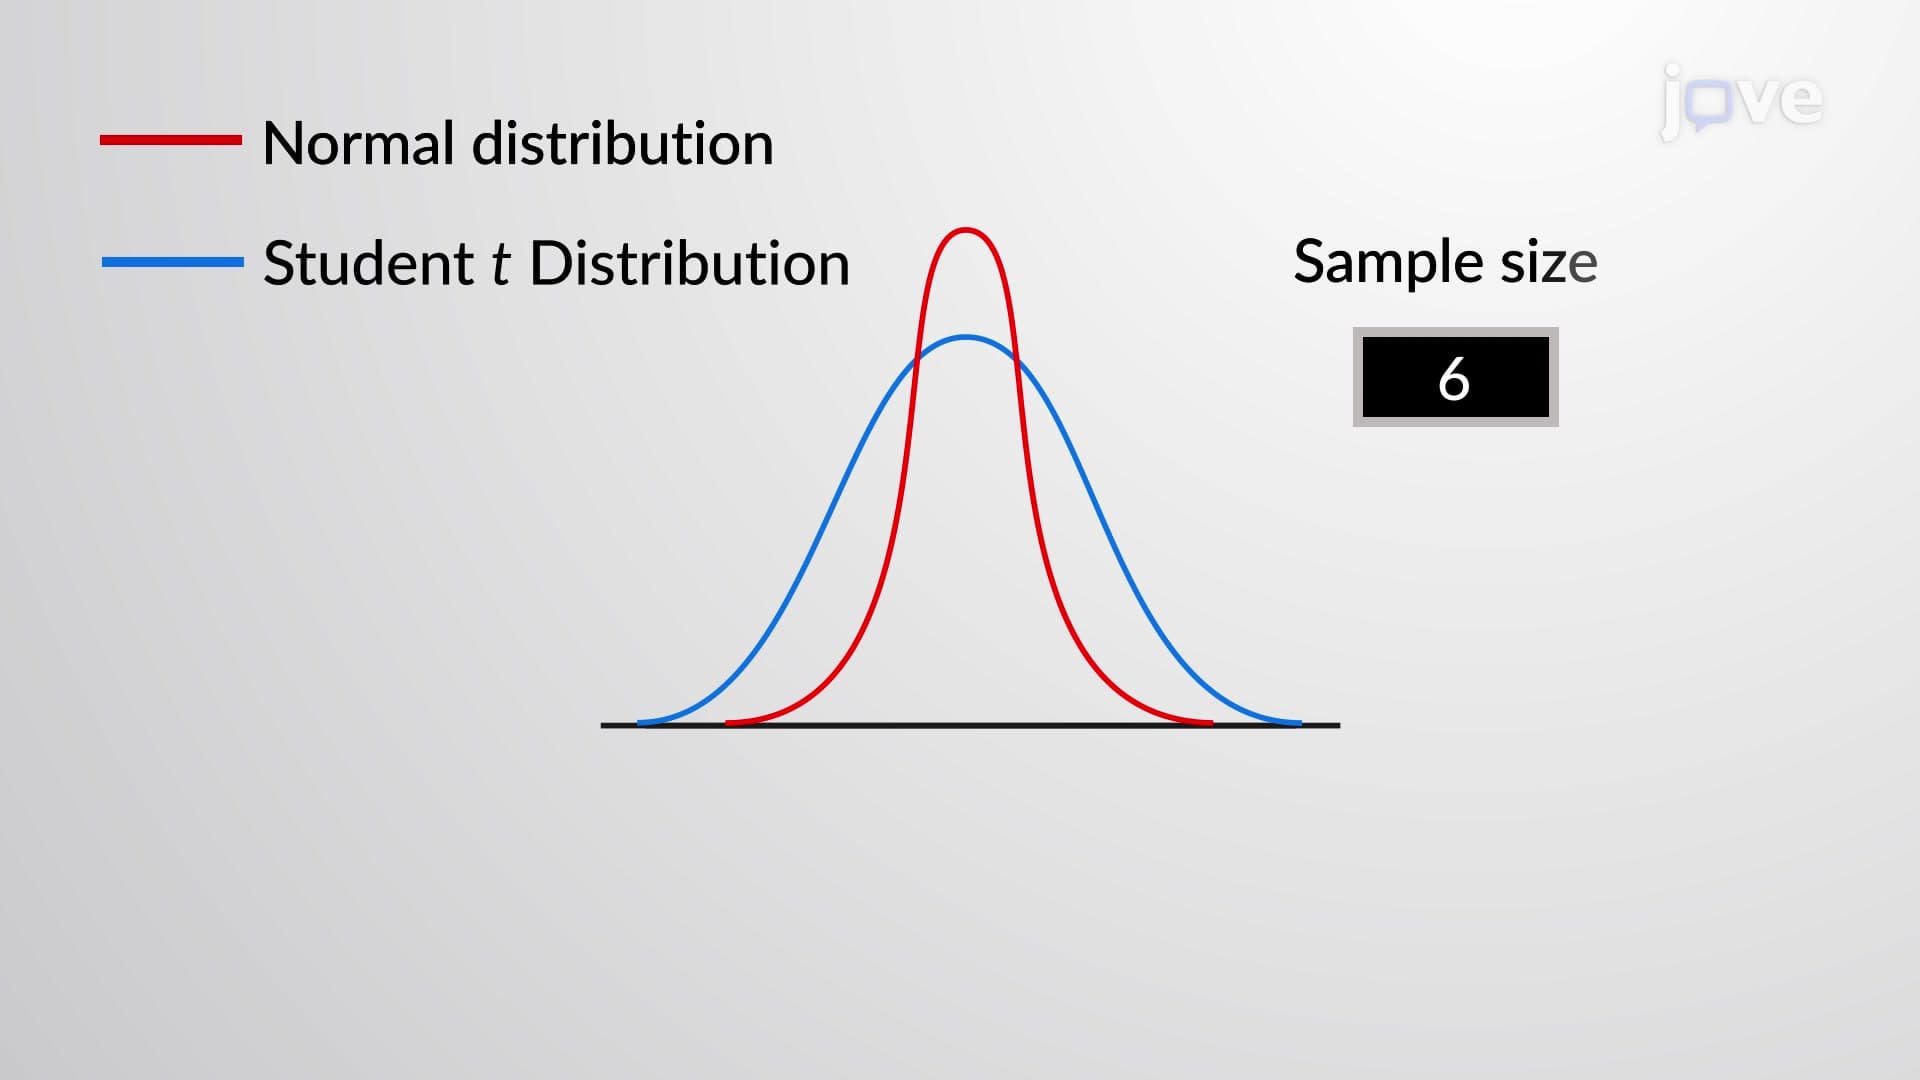
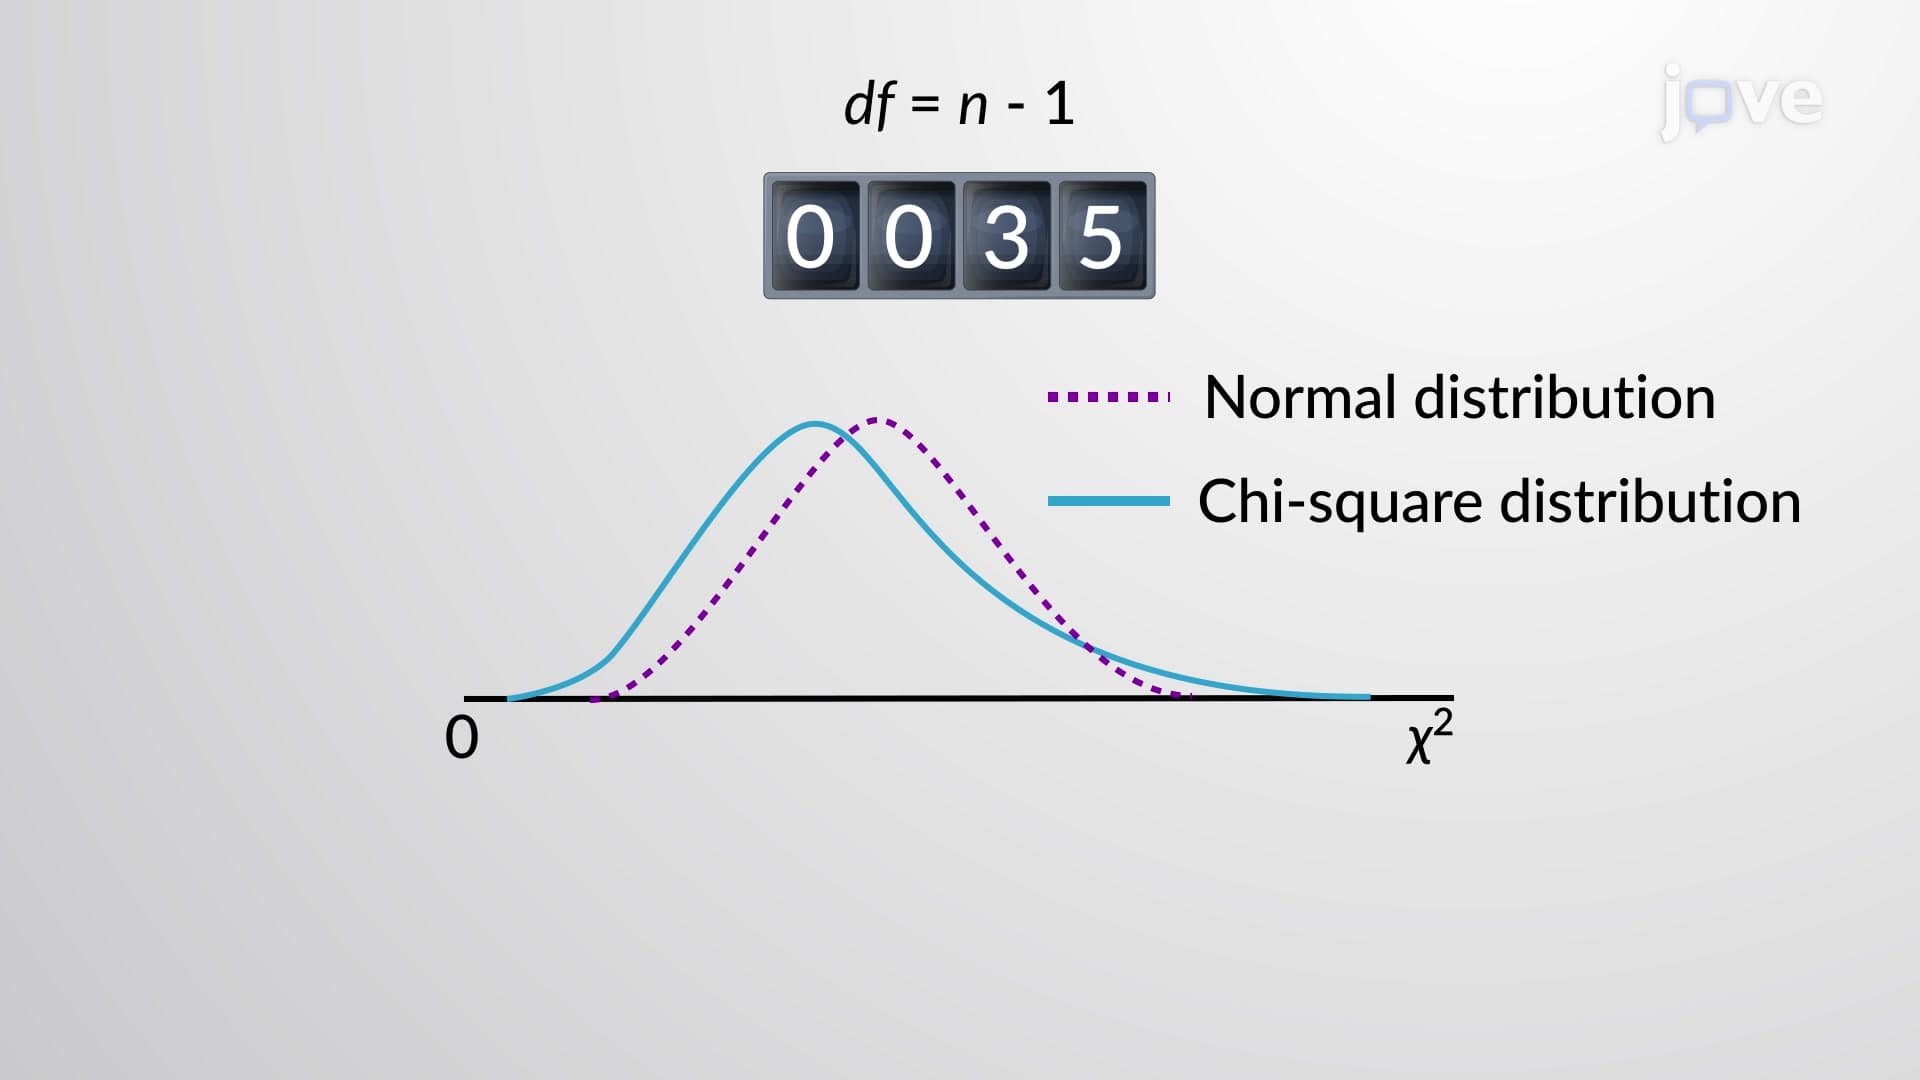
What distinguishes F distribution from other statistical distributions is its unique two-parameter system. The first degree of freedom (df1) corresponds to the numerator variance, while the second degree of freedom (df2) relates to the denominator variance. These parameters directly influence the distribution's shape: smaller degrees of freedom create more pronounced right skewness, while larger degrees of freedom produce curves that gradually approach normality.
For example, an F distribution with df1=2 and df2=5 appears much more skewed than one with df1=10 and df2=30. This flexibility makes F distribution adaptable to various sample sizes and experimental designs commonly encountered in American college statistics courses and AP Statistics examinations.
F distribution finds extensive application in American academic and professional research through Analysis of Variance (ANOVA) procedures. When researchers at institutions like Johns Hopkins University compare treatment effectiveness across multiple groups, they rely on F-tests to determine whether observed differences exceed what random chance would produce.
Consider a practical example: educational researchers comparing standardized test score improvements across three different teaching methods in California high schools. The F-test uses F distribution to assess whether the variance between group means significantly exceeds the variance within groups, helping determine if teaching methods genuinely affect student performance.
Students preparing for college-level statistics courses, including those taking AP Statistics or introductory statistics at American universities, benefit from understanding F distribution's relationship to other statistical tools. The F statistic connects directly to t-tests (since F = t² for two-group comparisons) and chi-square tests through mathematical relationships that appear frequently on standardized examinations.
This interconnectedness makes F distribution a bridge concept linking basic variance concepts taught in high school mathematics to advanced inferential statistics used in college research methods courses across disciplines from psychology to business analytics.
Related Micro-courses