Loading subject page…


70,000 views


Video Summary: What Is Test of Independence
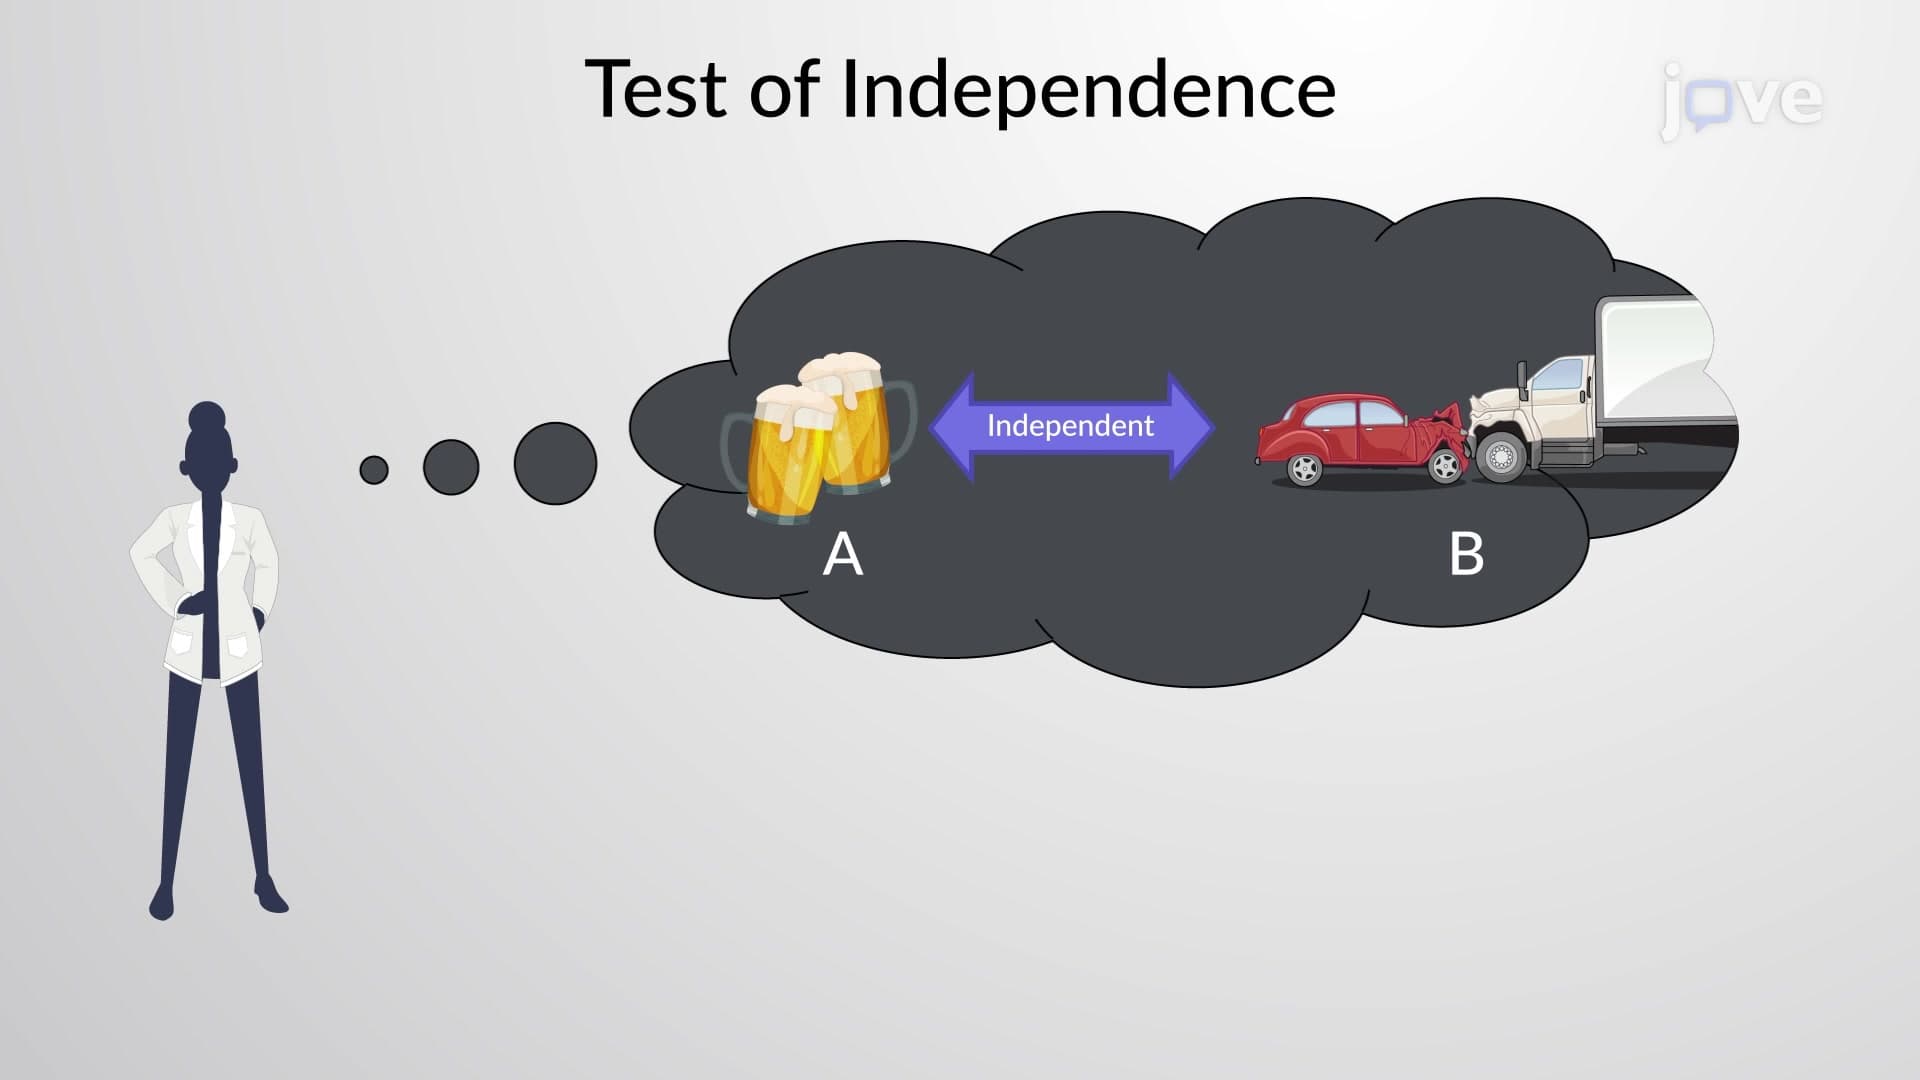
Ever wondered if drinking alcohol really increases your chances of dying in a car crash? A test of independence helps statisticians determine whether two variables in a contingency table are truly related or just coincidentally linked. This powerful statistical method analyzes real-world scenarios like the relationship between alcohol consumption and fatal traffic accidents in the United States, where data is organized into rows and columns to reveal hidden patterns. Watch the full video on JoVE Coach to master this concept with expert-led visuals and step-by-step explanations.
The test of independence serves as a cornerstone statistical method for determining whether two categorical variables influence each other or occur independently. When researchers collect data on multiple characteristics-like gender and voting preference, or education level and income bracket-they need reliable tools to identify genuine relationships versus random coincidences.
This statistical procedure operates on contingency tables, which organize categorical data into rows and columns representing different variable categories. For instance, the Centers for Disease Control and Prevention (CDC) might use a test of independence to examine whether smoking status (smoker/non-smoker) relates to lung cancer development (present/absent) across American populations.
The mathematical foundation relies on comparing observed frequencies (what actually happened) with expected frequencies (what would happen if variables were independent). The formula for expected frequency equals: (Row Total × Column Total) ÷ Grand Total.
The chi-square test statistic follows this pattern: χ² = Σ[(Observed - Expected)²/Expected]. Each cell contributes to the overall statistic, with larger differences between observed and expected values increasing the chi-square value. Students preparing for AP Statistics or college statistics courses must master these calculations, as they frequently appear on standardized exams.
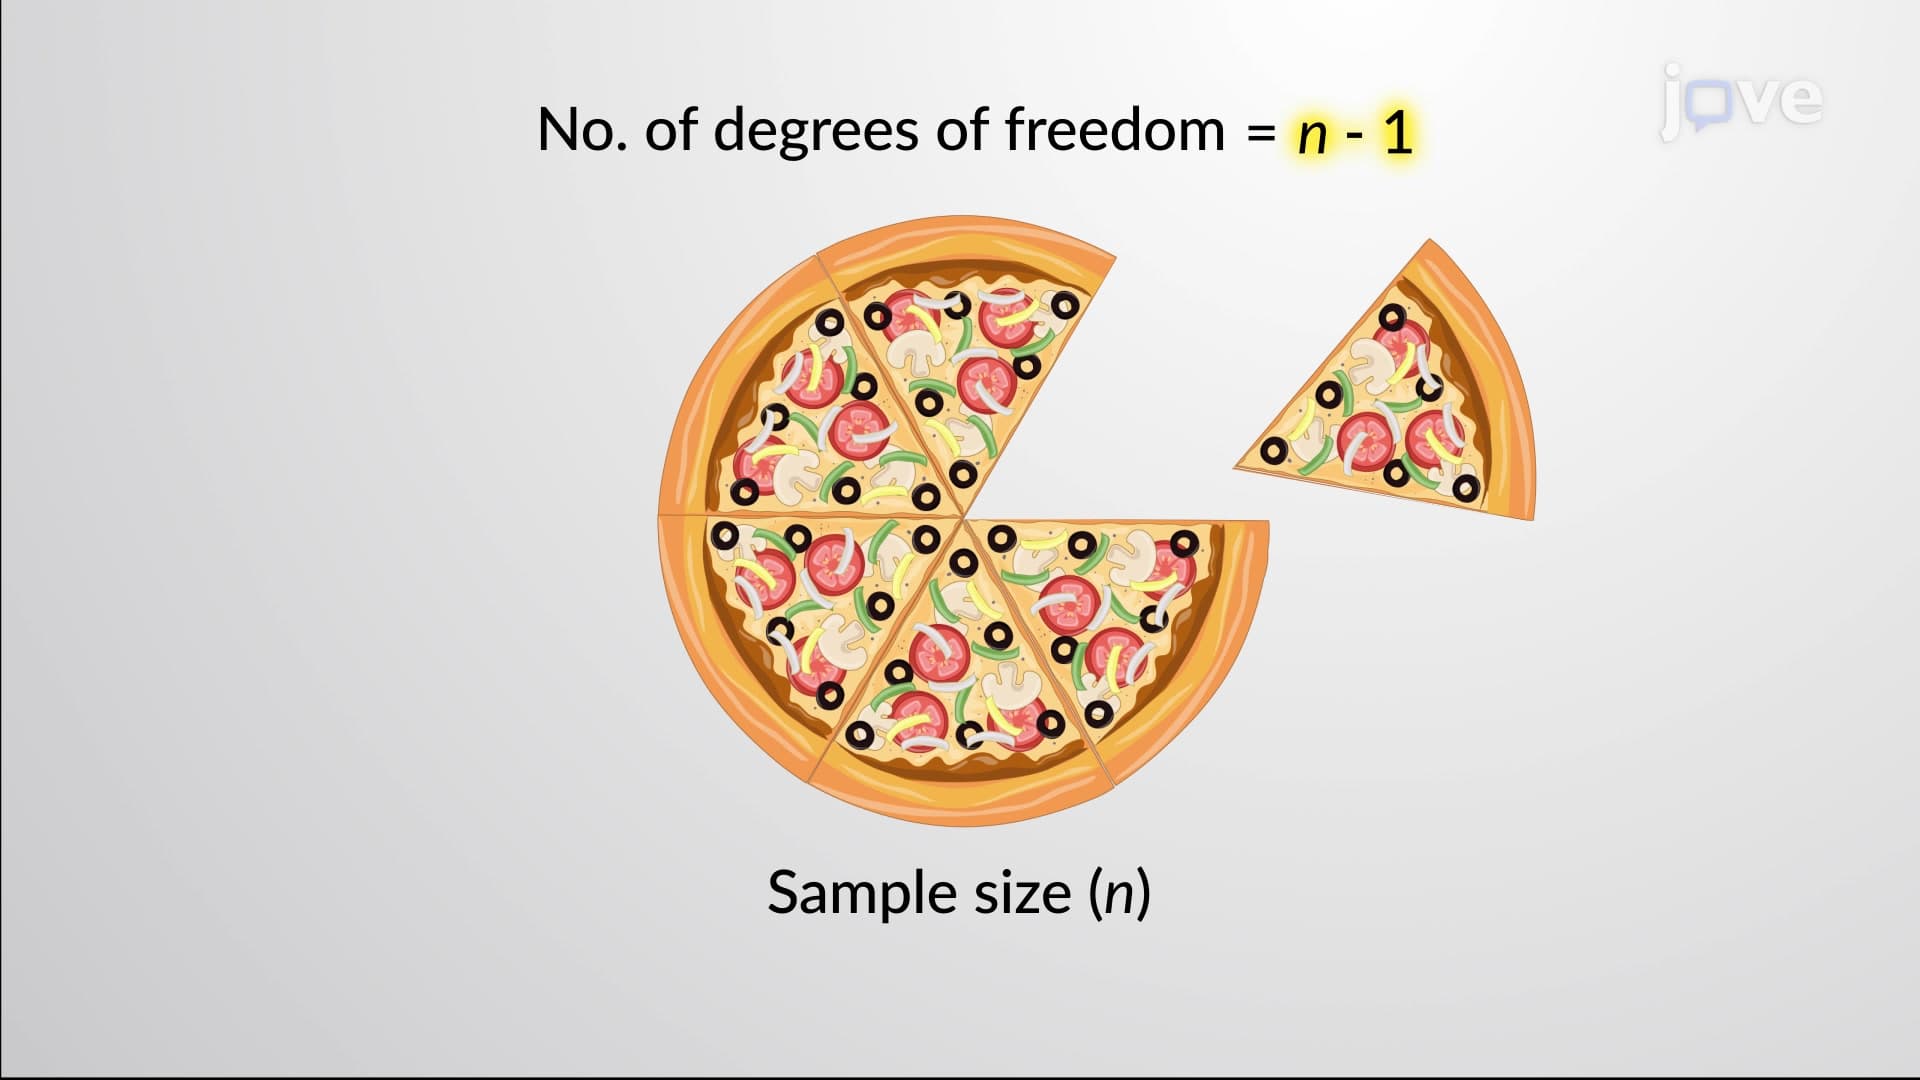
Degrees of freedom equal (number of rows - 1) × (number of columns - 1), determining which chi-square distribution to reference. For a 2×2 table examining gender and college major preference, degrees of freedom would equal (2-1) × (2-1) = 1.
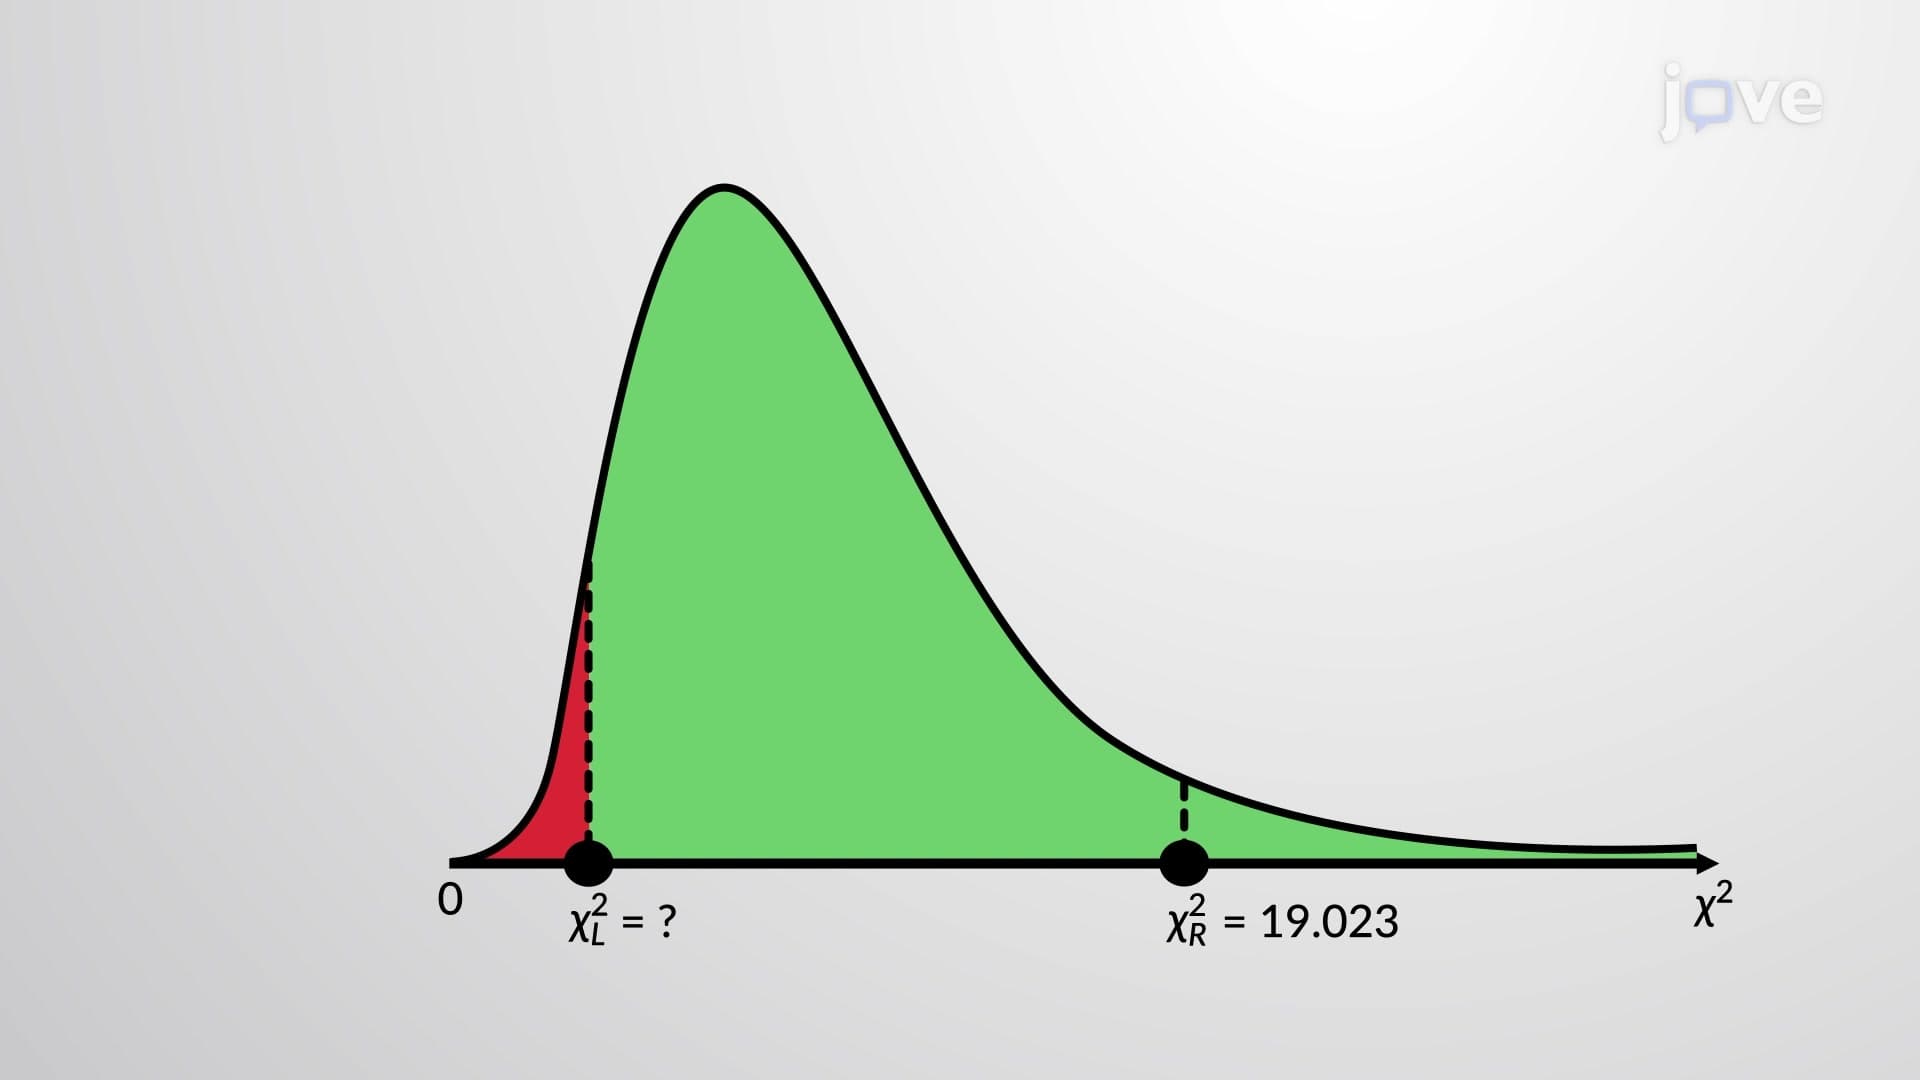
Critical values depend on chosen significance levels (typically α = 0.05) and degrees of freedom. When calculated chi-square statistics exceed critical values, researchers reject the null hypothesis of independence, concluding that variables are related.
American businesses regularly employ independence tests for market research. Netflix might analyze whether subscriber age groups show independence from preferred content genres, helping optimize recommendation algorithms. Similarly, pharmaceutical companies use these tests during clinical trials to determine if medication effectiveness varies across demographic groups, supporting FDA approval processes.
Educational institutions apply independence testing when evaluating admission criteria effectiveness or analyzing student performance patterns across different teaching methods, making this concept essential for students pursuing careers in research, healthcare, or business analytics.
Related Micro-courses