Loading video…


 15 Concepts
 70K views

Video Summary: Hypothesis Test for Test of Independence Explained
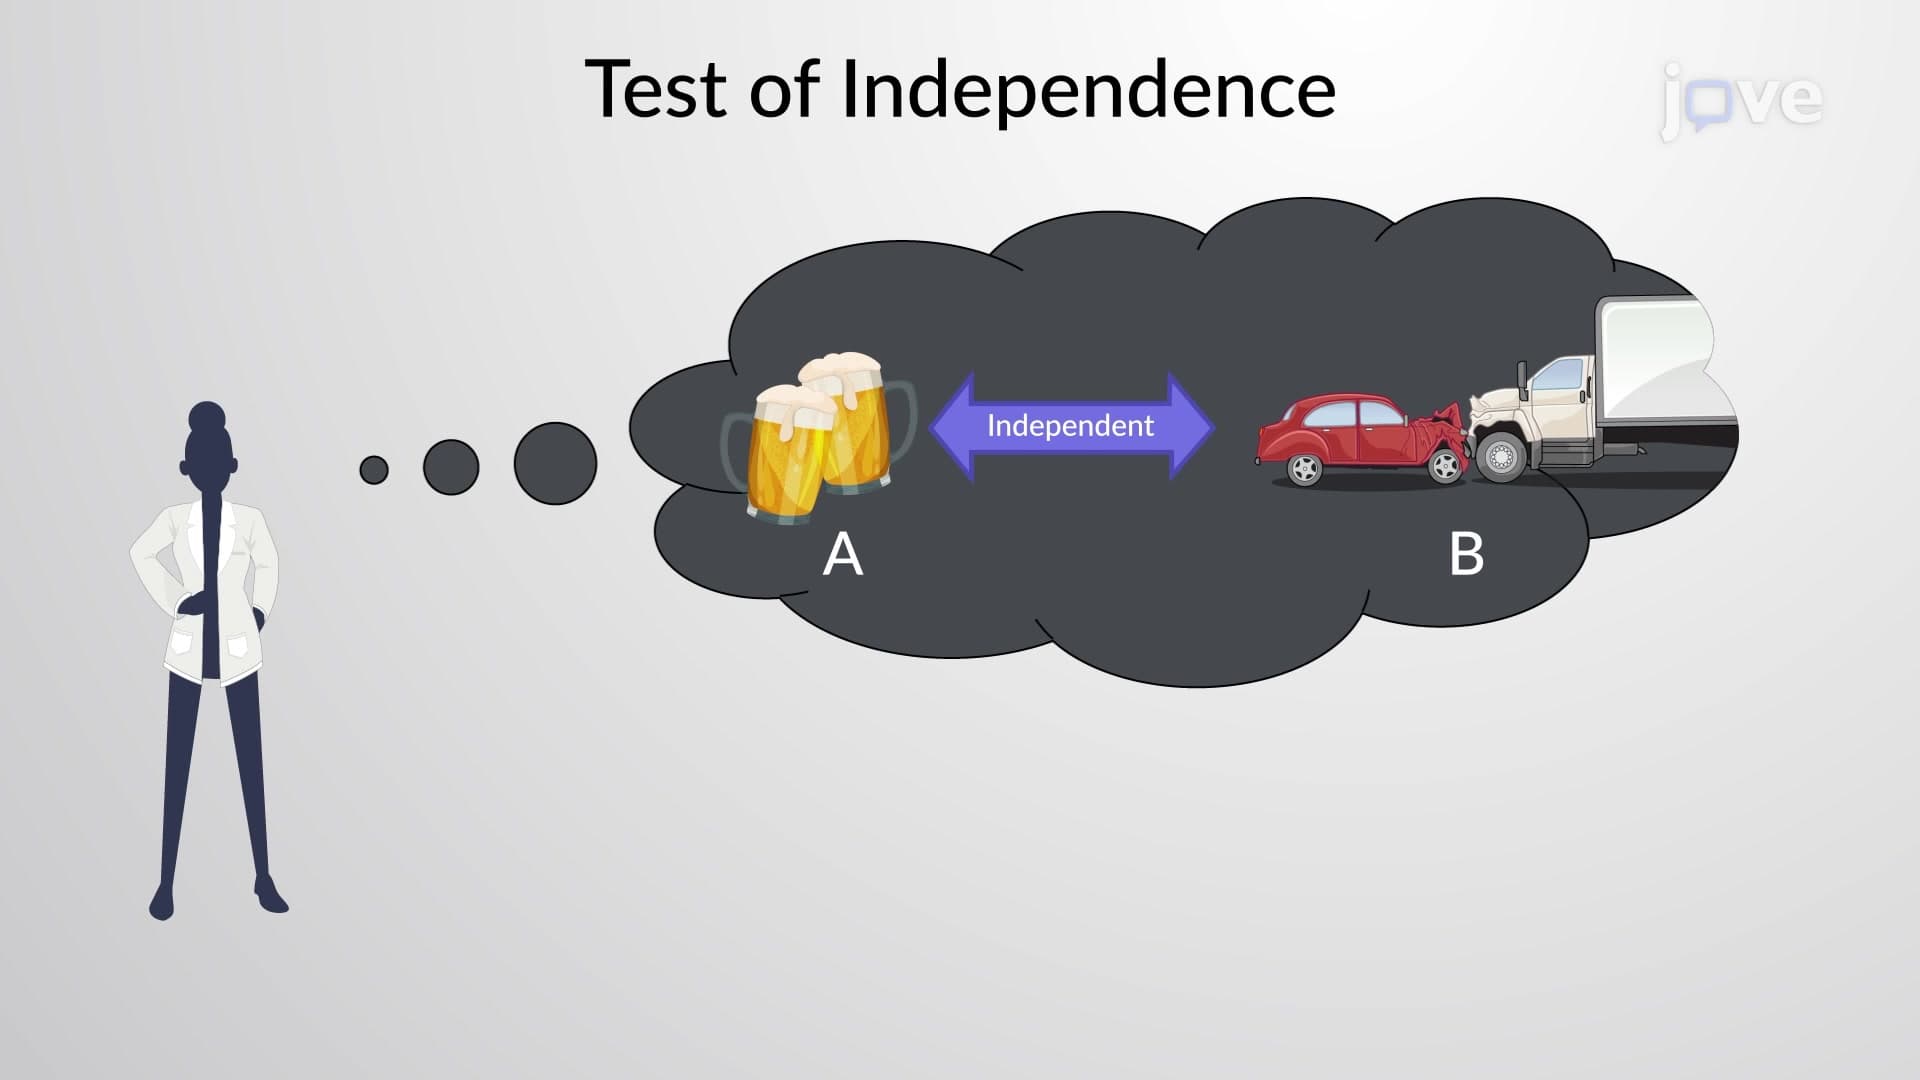
Did you know that statistical analysis revealed alcohol-related crashes account for nearly 30% of all traffic fatalities in the United States? A hypothesis test for test of independence helps researchers determine whether two categorical variables, like alcohol consumption and accident severity, are statistically related or occur independently. This powerful statistical method uses chi-square analysis to examine relationships between variables in real-world scenarios, from medical research at Johns Hopkins to traffic safety studies by the National Highway Traffic Safety Administration. Watch the full video on JoVE Coach to master this concept with expert-led visuals and step-by-step explanations.
A hypothesis test for test of independence is a statistical procedure that determines whether two categorical variables are related or occur independently of each other. Unlike tests for numerical data, this method specifically examines the relationship between qualitative variables organized in contingency tables. The test is fundamental in statistics courses at universities like UCLA and Stanford, and appears frequently on AP Statistics exams and college-level assessments.
The process begins by establishing clear hypotheses. The null hypothesis (H₀) always states that the two variables are independent, meaning one variable's outcome doesn't influence the other. The alternative hypothesis (H₁) claims the variables are dependent or associated. For instance, when studying the relationship between exercise frequency and heart disease risk using data from the American Heart Association, H₀ would state these variables are independent, while H₁ would claim they're related.
Contingency tables organize observed data into rows and columns representing different categories. Each cell contains the frequency count for that specific combination. Understanding how to read and interpret these tables is crucial for success on standardized tests like the MCAT and college statistics courses.
Expected frequencies represent what we would observe if the null hypothesis were true. The formula is: Expected frequency = (Row total × Column total) / Grand total. This calculation assumes independence and provides a baseline for comparison with observed data.
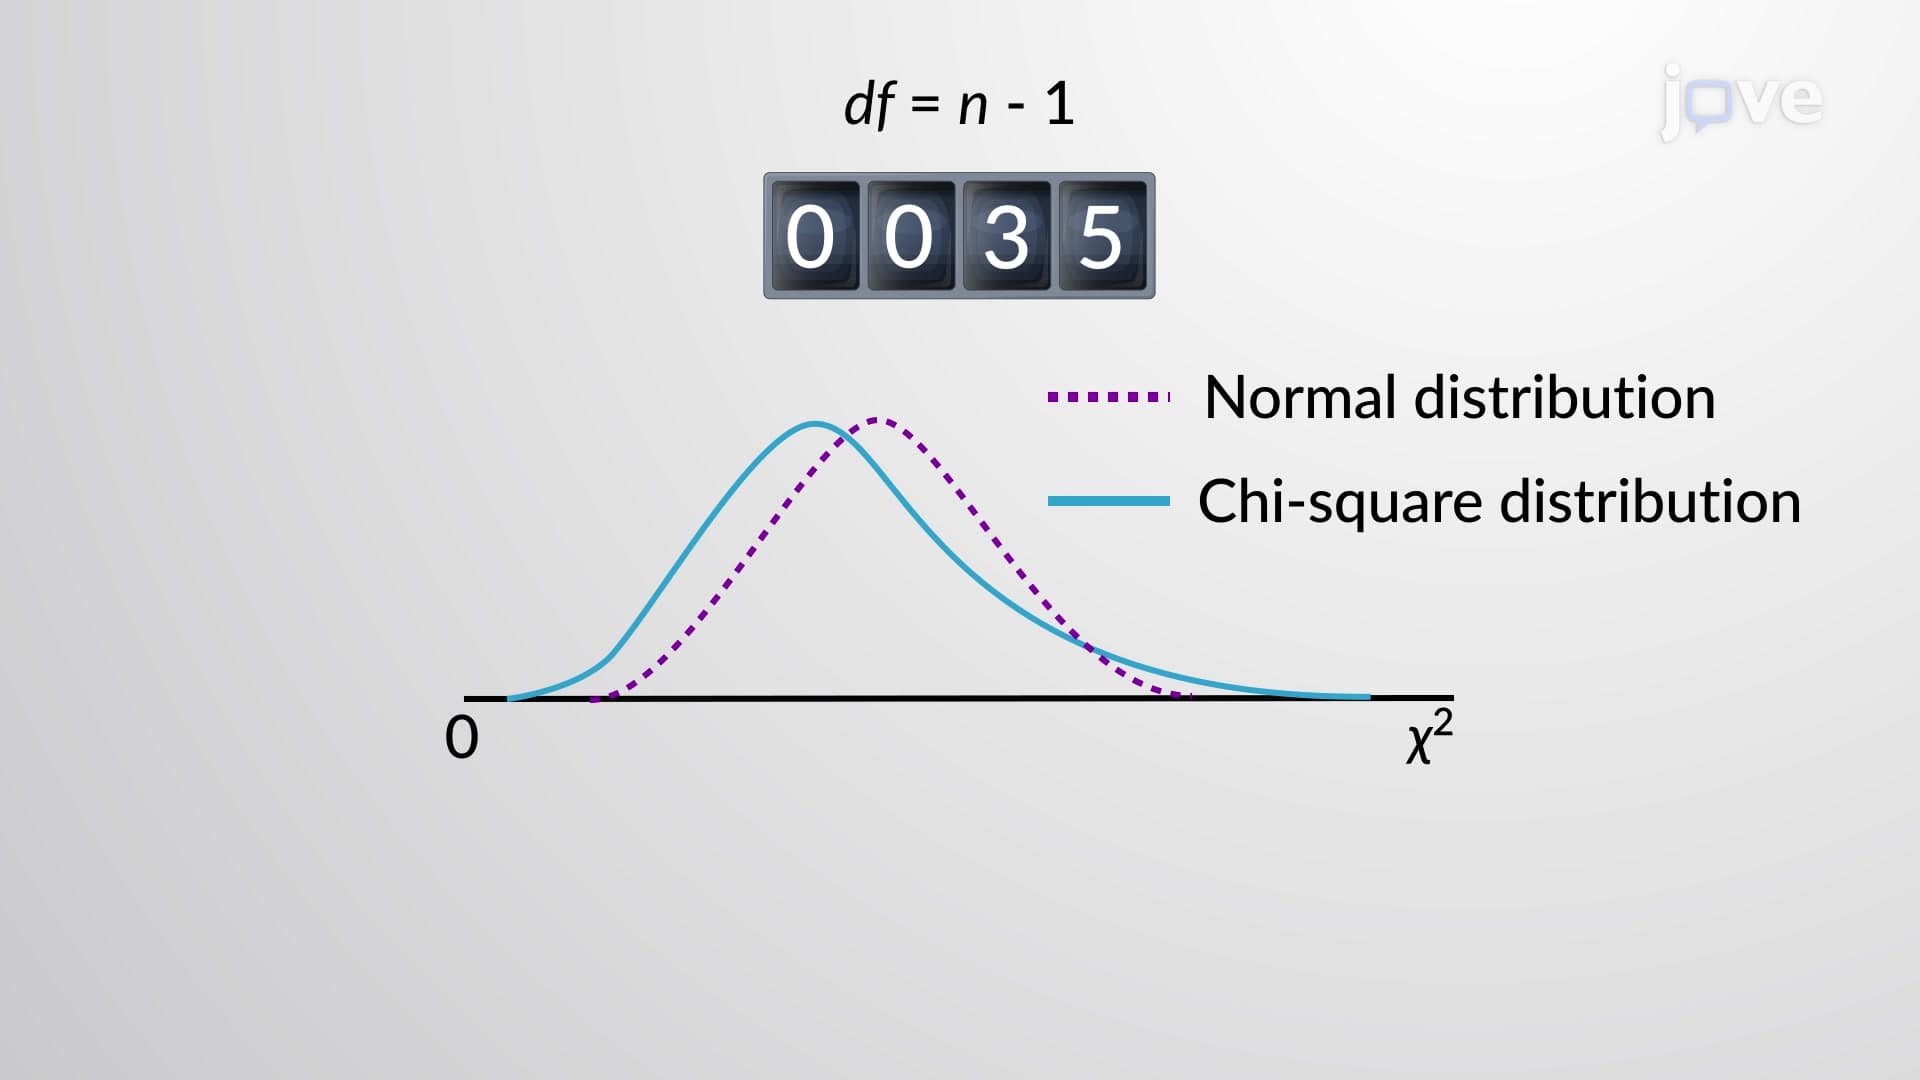
The chi-square test statistic measures how much observed frequencies deviate from expected frequencies. Students at institutions like MIT and Carnegie Mellon learn this as: χ² = Σ[(Observed - Expected)² / Expected]. Larger chi-square values indicate greater deviation from independence, suggesting a relationship between variables.
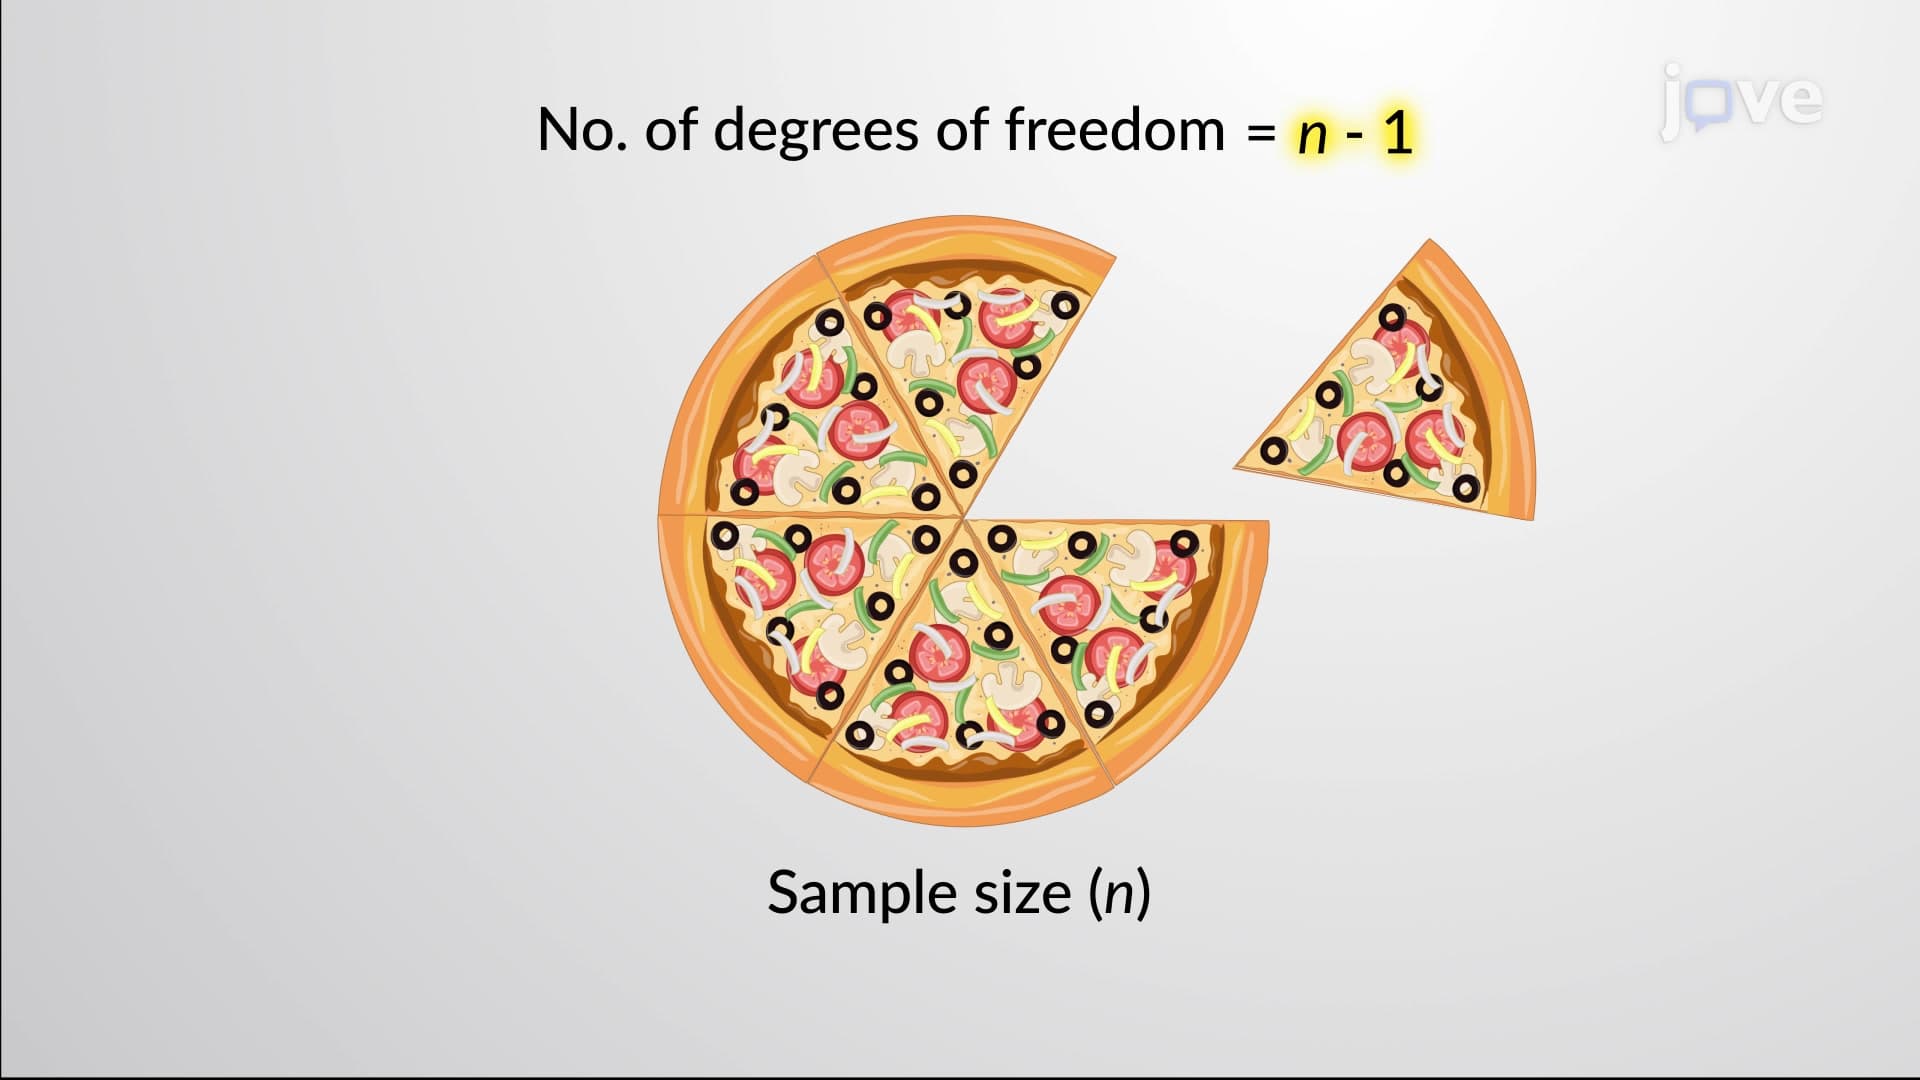
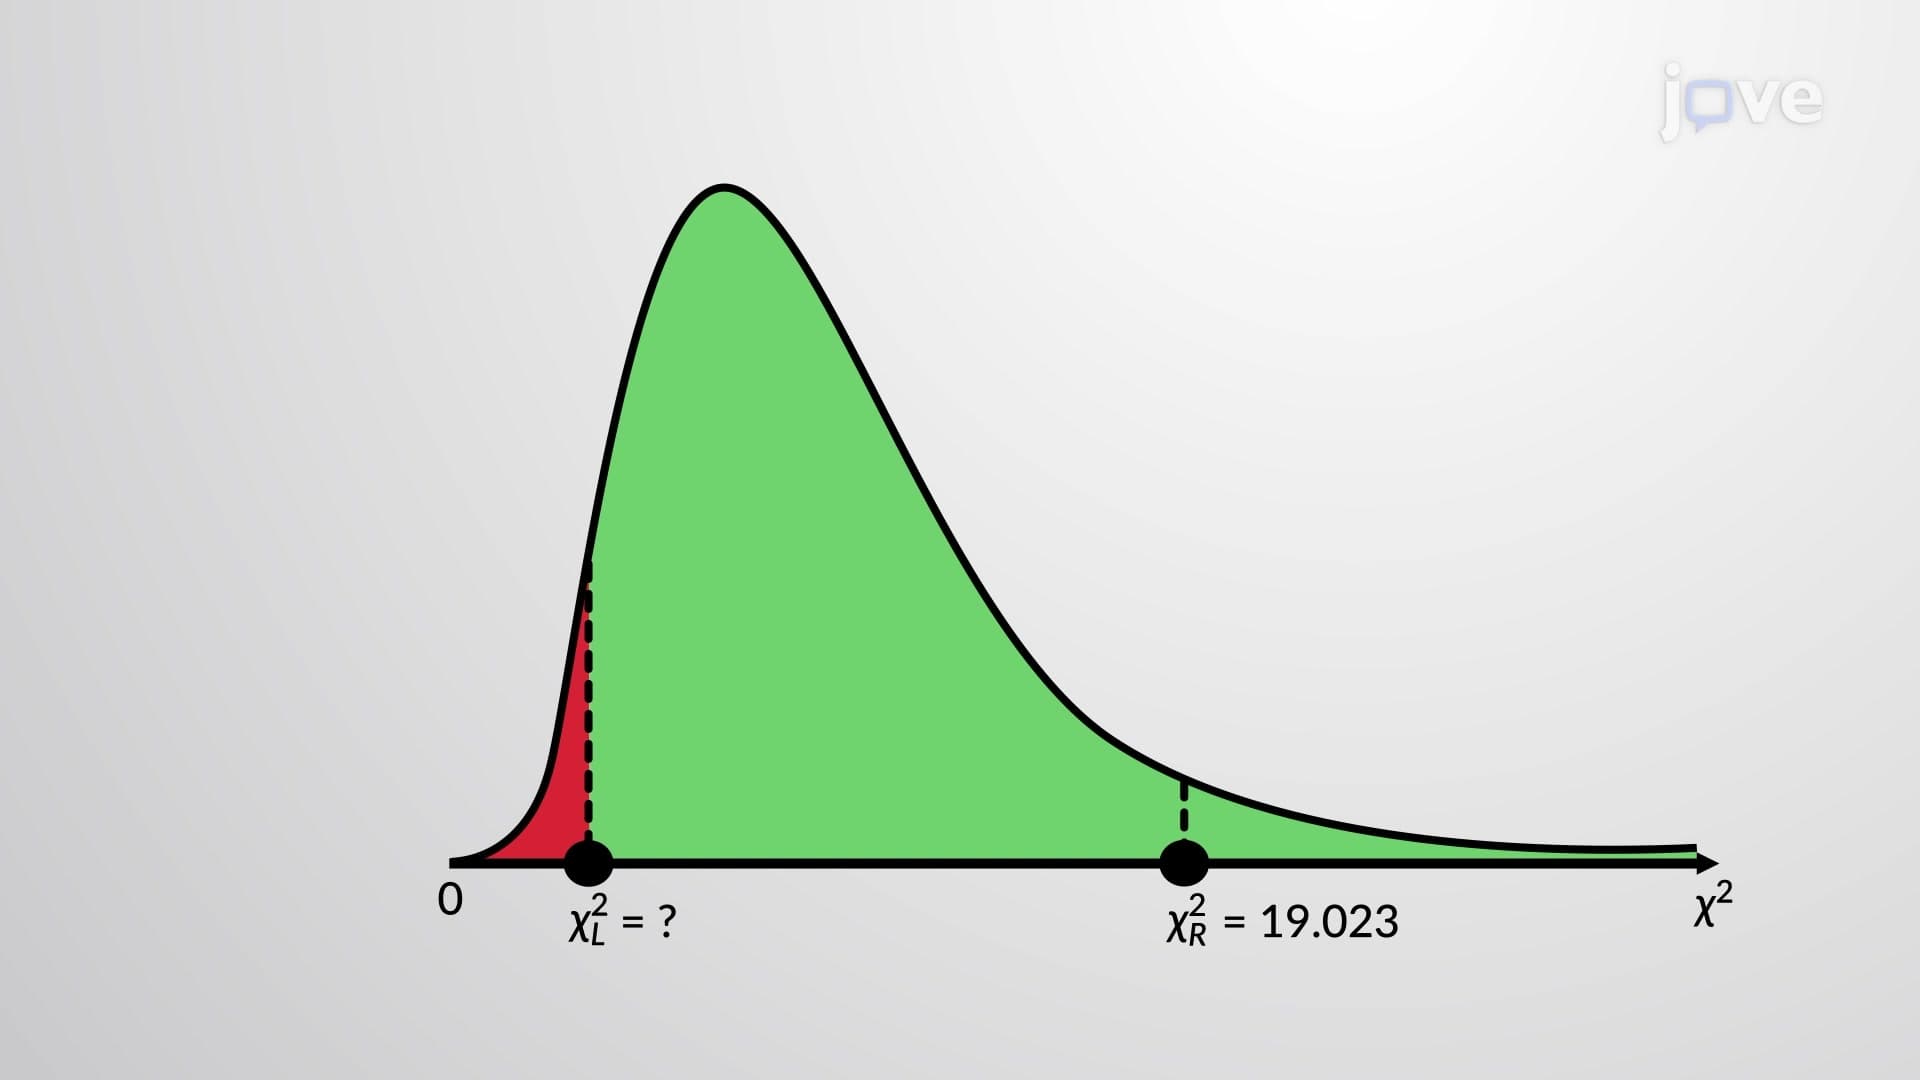
The final step involves comparing the calculated test statistic to a critical value from the chi-square distribution table. Degrees of freedom equal (rows - 1) × (columns - 1). If the test statistic exceeds the critical value at the chosen significance level (commonly 0.05), we reject the null hypothesis and conclude the variables are dependent. This decision-making process is essential for research in fields from epidemiology at the CDC to market research in corporate America.
Related Micro-courses