Loading concepts…


15 Concepts
15 Concepts
13 Concepts
11 Concepts
9 Concepts
14 Concepts
11 Concepts
15 Concepts
13 Concepts
7 Concepts
10 Concepts
10 Concepts
22 Concepts
19 Concepts
16 Concepts
16 Concepts
7 Concepts
 11 Concepts
 118.4K Views
 Popular topics






Measures of variation quantify how data points spread around the central value, providing crucial insights beyond simple averages. From analyzing SAT score distributions across US high schools to evaluating stock market volatility on Wall Street, these statistical tools help identify patterns in data dispersion. JoVE Coach's comprehensive course covers essential variation measures including range, standard deviation, and variance.
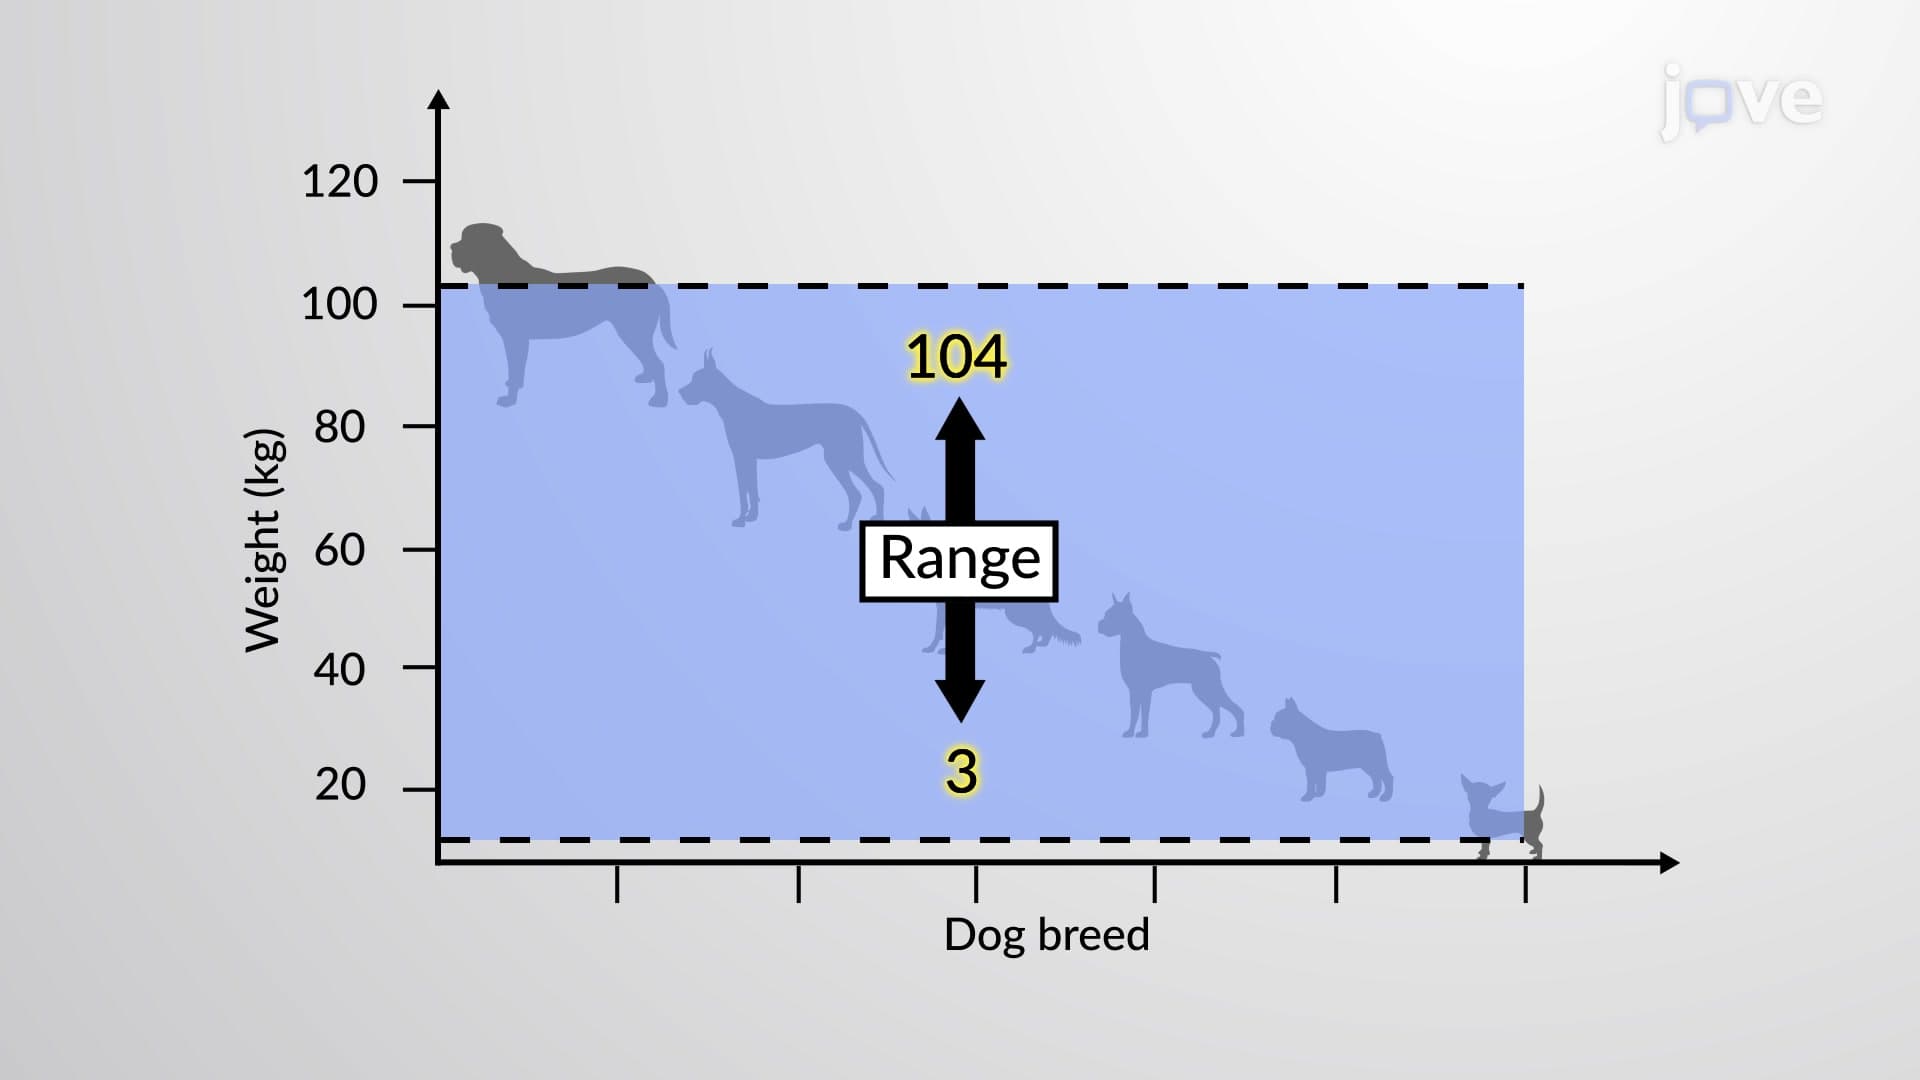
1. Range and Basic Variation Concepts Range represents the simplest measure of variation, calculated as the difference between maximum and minimum values. While easy to compute and useful for quick assessments like manufacturing quality control or weather forecasting, range has significant limitations due to its sensitivity to outliers. For example, when analyzing ACT scores across different high schools, a single extremely high or low score can dramatically skew the range, making it less representative of typical student performance variation.
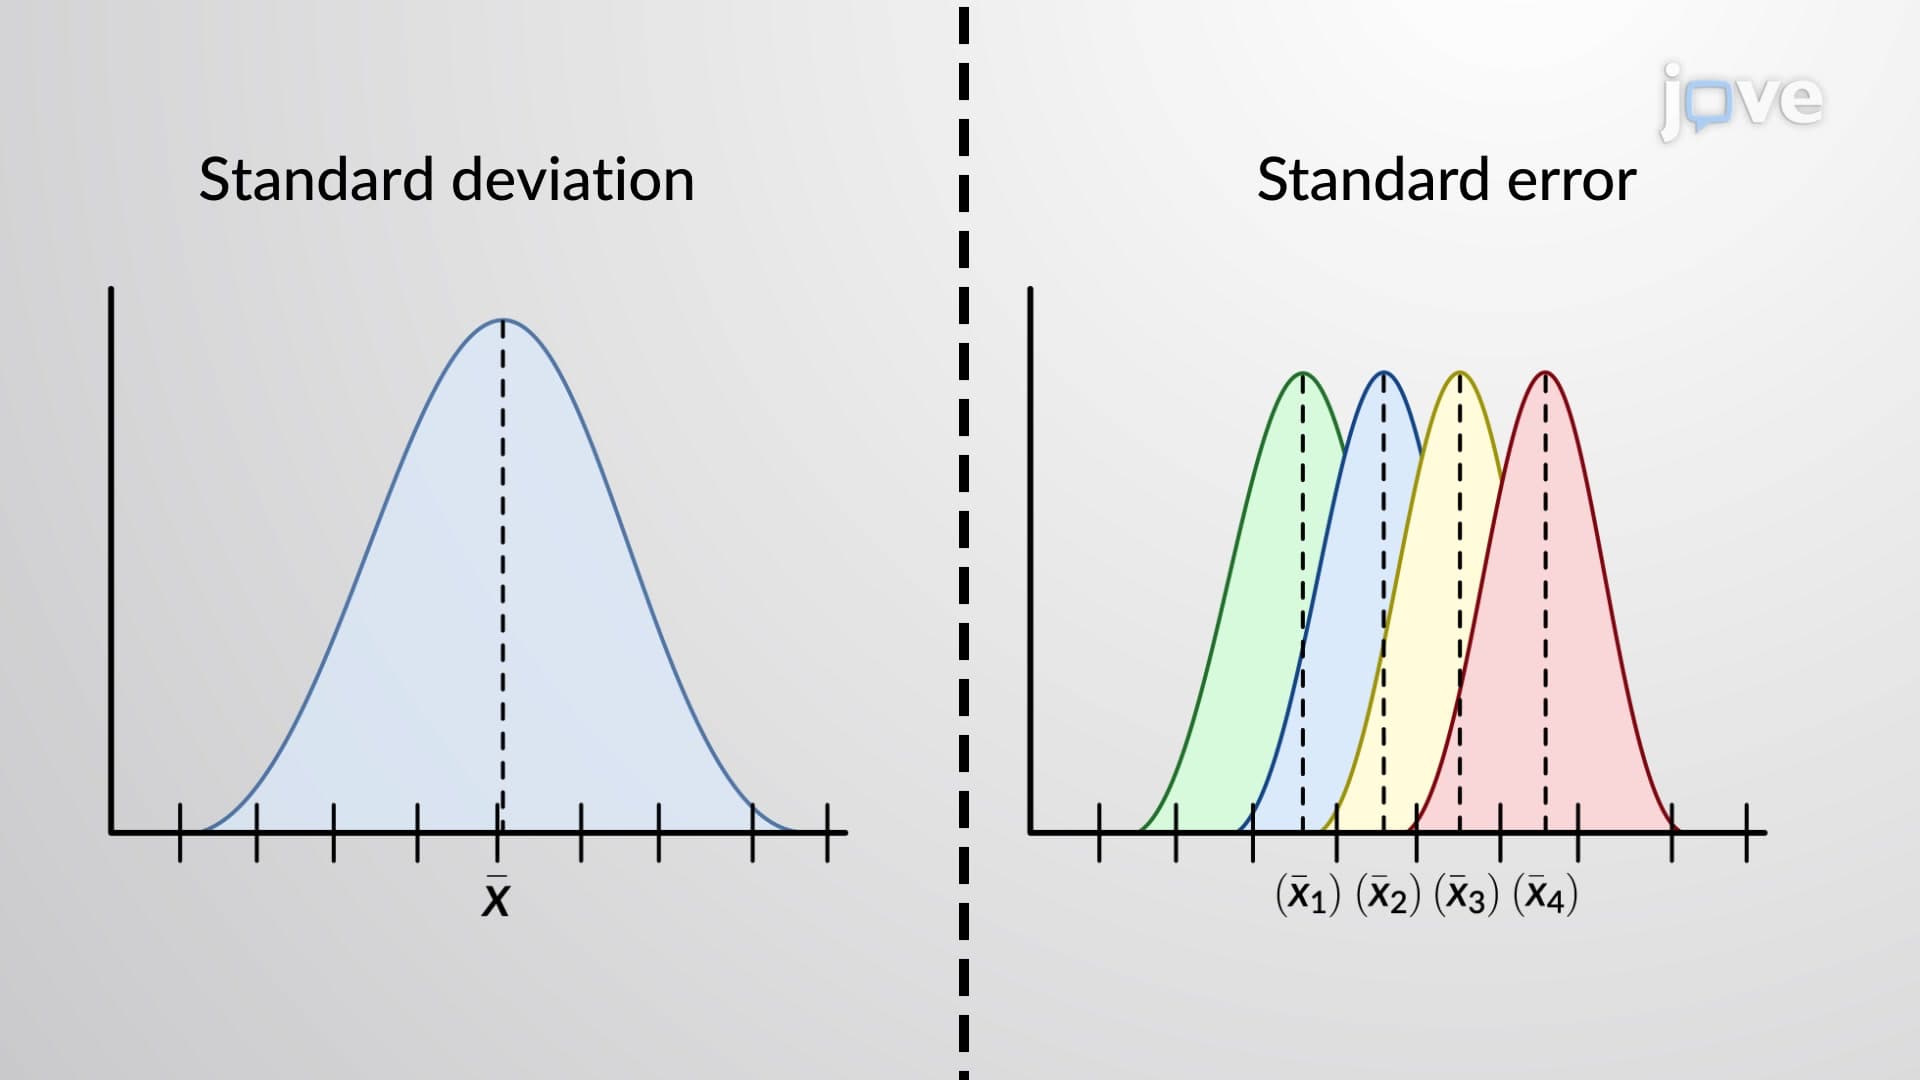
2. Standard Deviation: The Gold Standard Standard deviation measures the average distance of data points from the mean, providing a more robust measure than range. Sample standard deviation uses n-1 in the denominator (Bessel's correction), while population standard deviation uses N. This measure maintains the same units as the original data, making interpretation straightforward. For instance, if standardized test scores have a mean of 500 and standard deviation of 100, most students score within 100 points of the average.
3. Variance and Its Applications Variance equals the square of standard deviation, measuring the average squared deviations from the mean. While its squared units make direct interpretation challenging (rainfall variance would be in mm²), variance proves essential in advanced statistical techniques like ANOVA and financial risk assessment. Investment portfolios use variance to quantify risk, with higher variance indicating more volatile returns that could benefit or harm investors' financial goals.
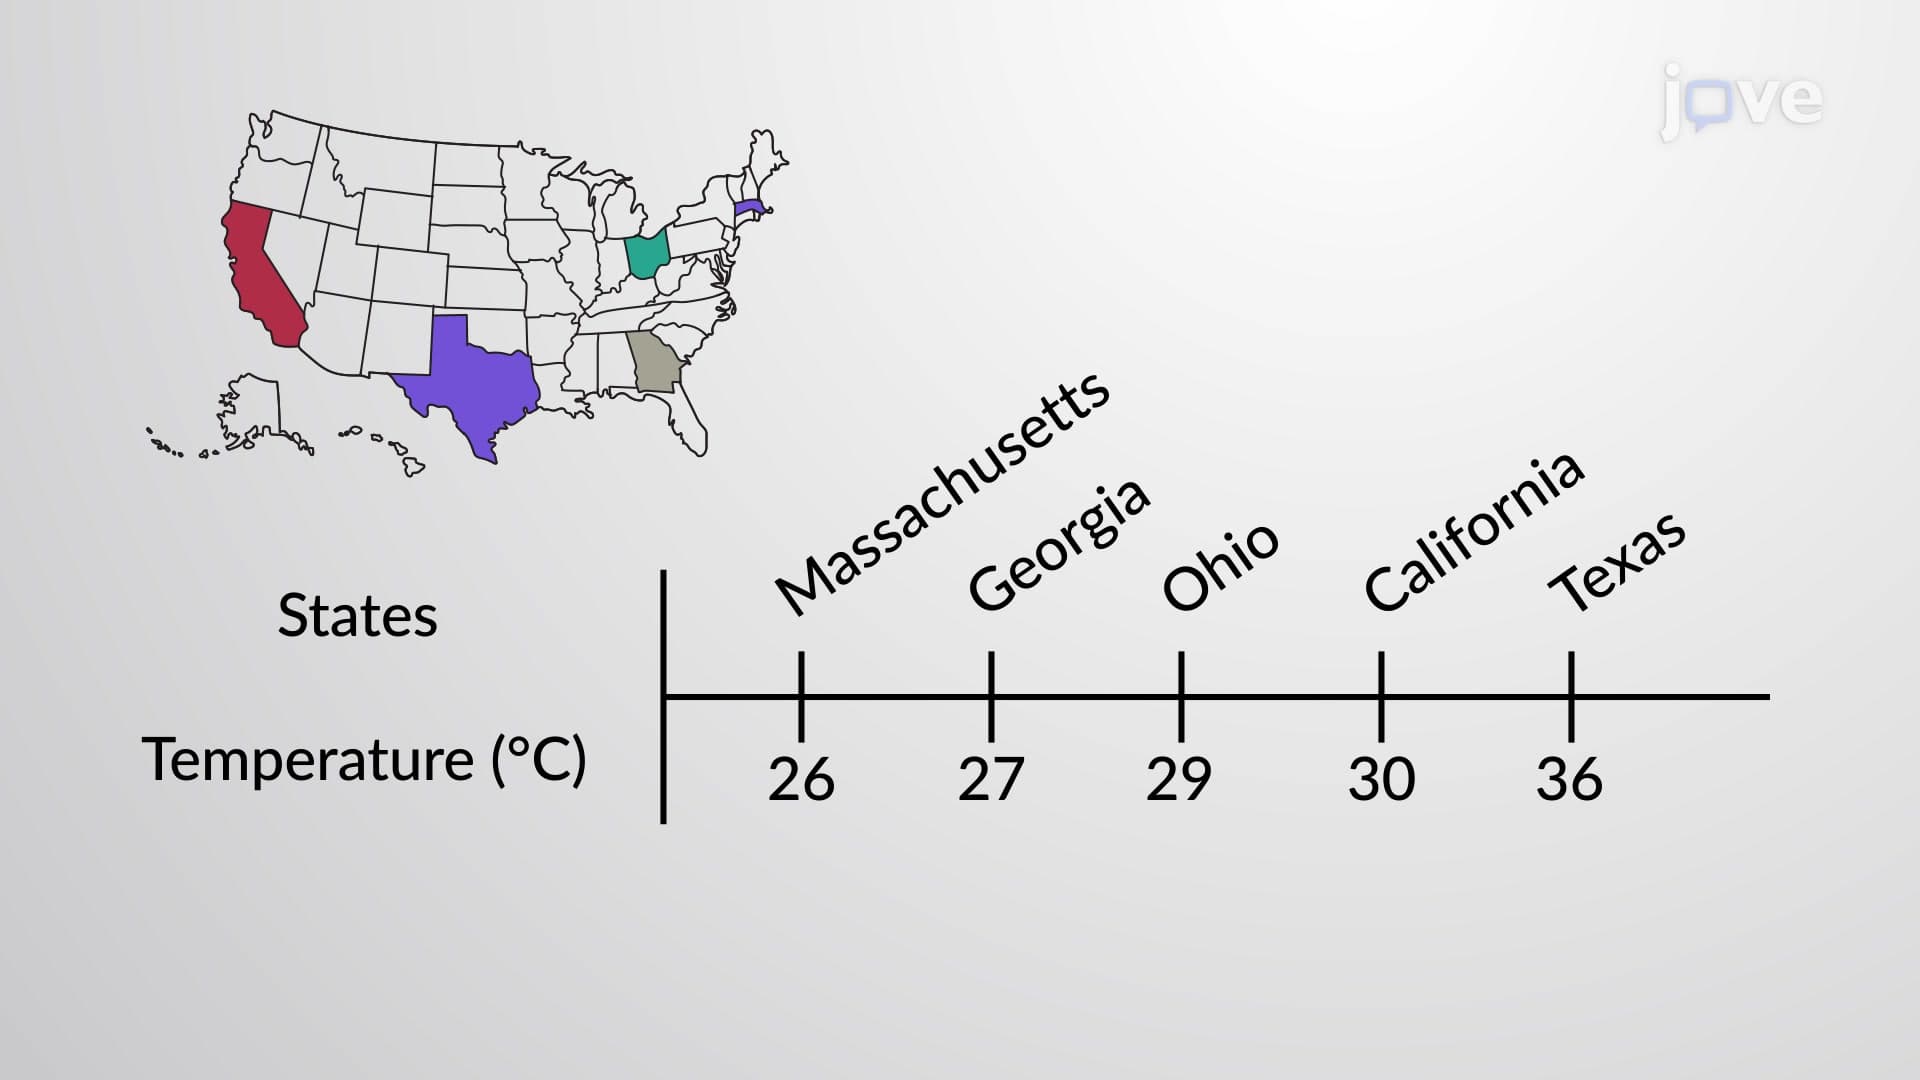
4. Coefficient of Variation for Comparative Analysis The coefficient of variation (CV) enables comparison between datasets with different units or vastly different means by expressing standard deviation as a percentage of the mean. This proves invaluable when comparing phenomena like temperature variations in Celsius versus rainfall in millimeters. In finance, investors use CV to compare risk-adjusted returns between different asset classes, helping determine which investments offer better risk-reward ratios.
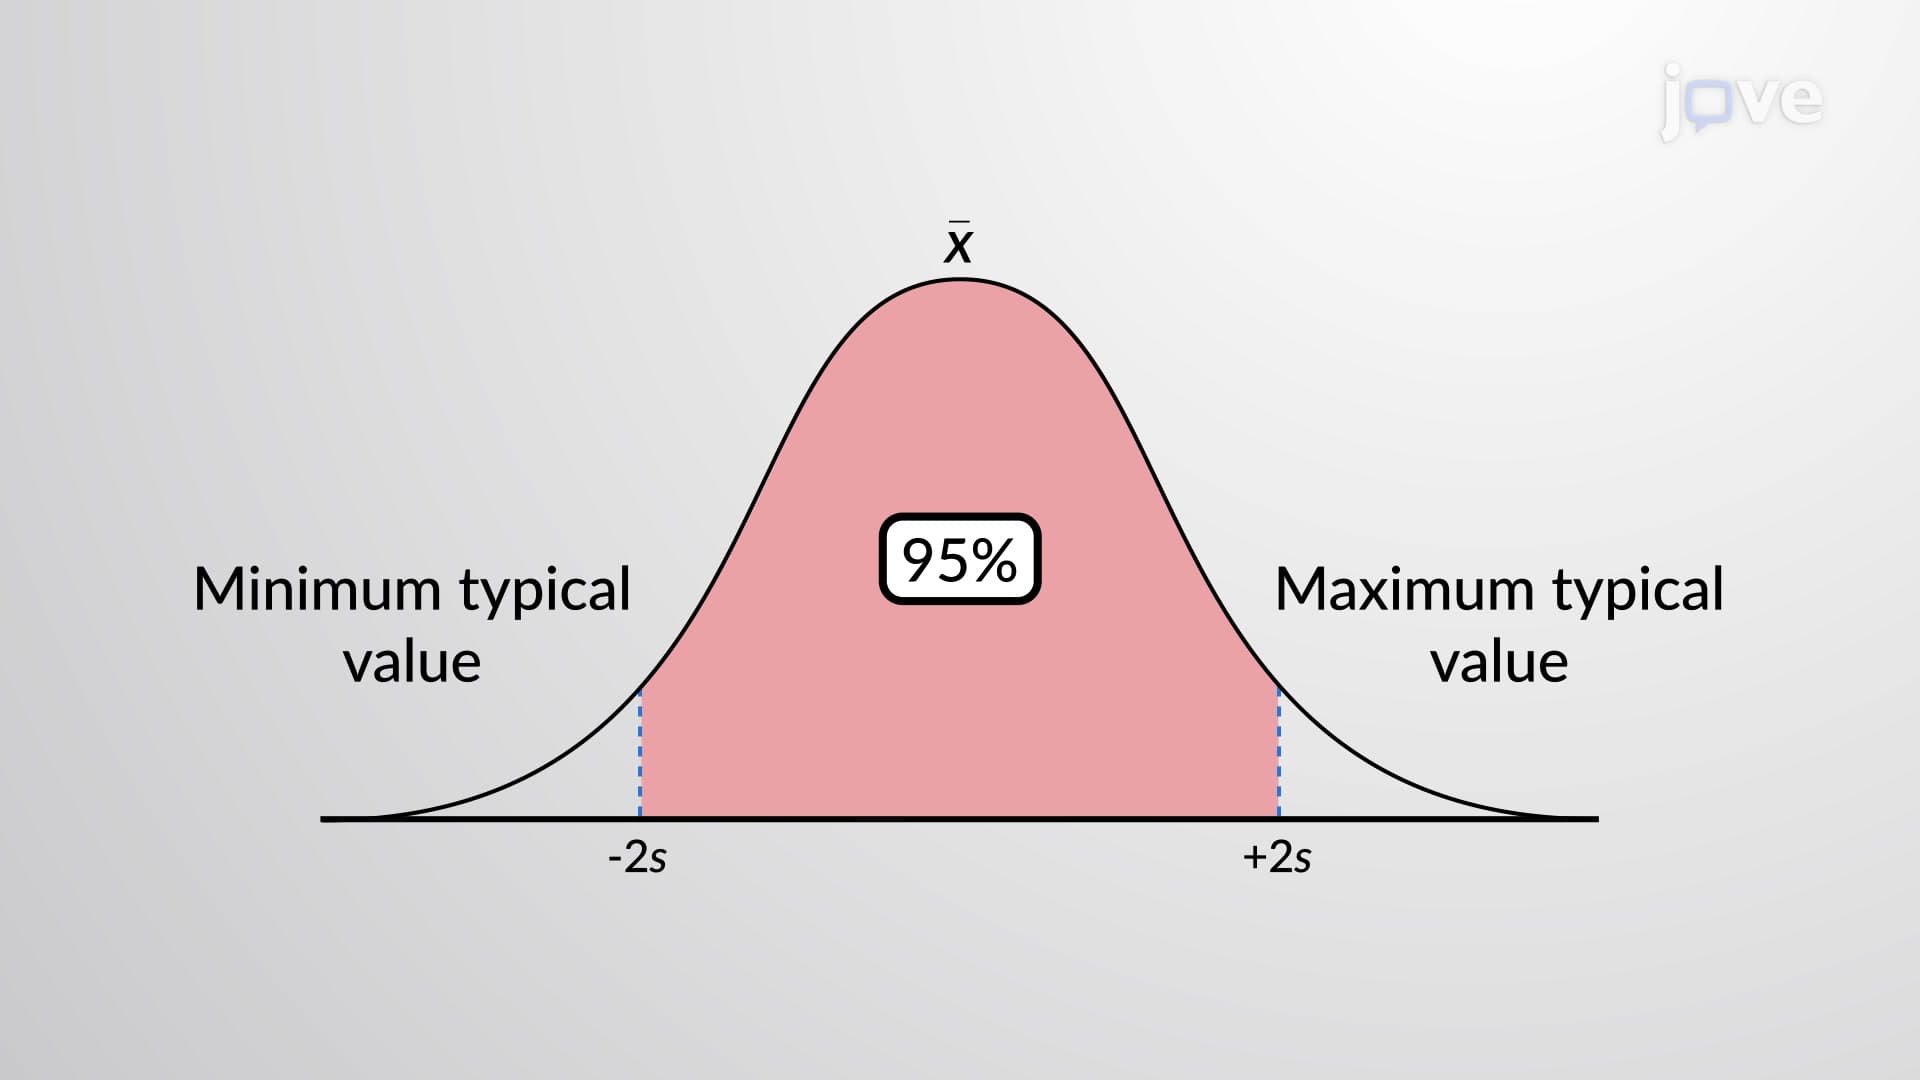
5. Interpretation Methods: Rules and Theorems Three key methods help interpret standard deviation values. The range rule of thumb estimates that typical values fall within two standard deviations of the mean, useful for quick outlier identification. The empirical rule applies specifically to normal distributions, predicting that 68% of values fall within one standard deviation, 95% within two, and 99.7% within three. Chebyshev's theorem works for any distribution, guaranteeing that at least 75% of values fall within two standard deviations and 89% within three.