Loading video…


 11 Concepts
 118.4K views

Video Summary: What Is Variance
When Goldman Sachs evaluates portfolio risk or Amazon analyzes customer behavior patterns, they rely on variance to quantify data spread and uncertainty. Variance measures how much individual data points deviate from the average, making it essential for risk assessment and strategic decision-making across industries. This statistical concept helps executives understand volatility in financial markets, operational performance, and business forecasting. Watch the full video on JoVE Coach to master this concept with expert-led visuals and step-by-step explanations.
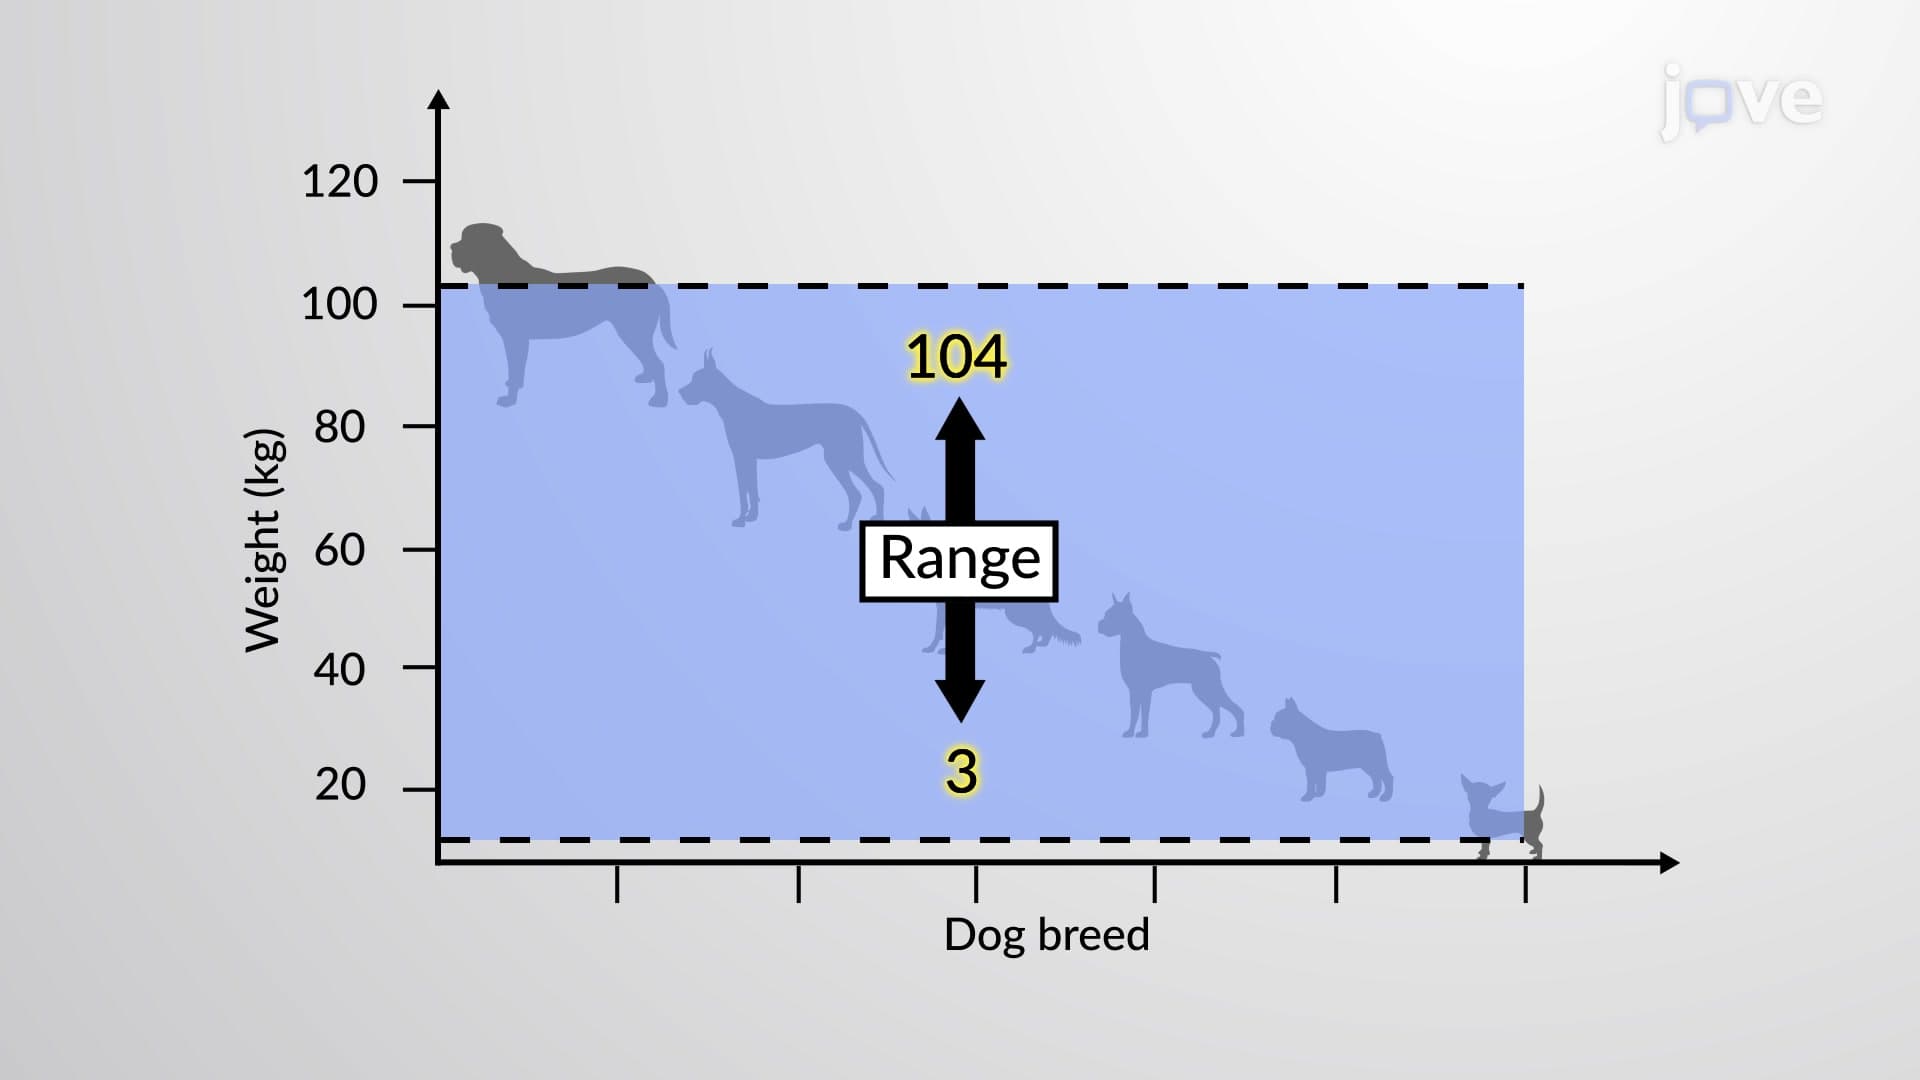
When Netflix's content strategy team evaluates viewer engagement across different shows, or when JPMorgan Chase assesses loan default patterns across regional markets, they're fundamentally dealing with variance-the statistical measure that quantifies how spread out data points are from their average value. Variance represents the average of squared differences from the mean, providing critical insights into consistency, predictability, and risk across business operations.
Professional analysts distinguish between sample variance (s²) and population variance (σ²) based on data availability and business objectives. When Walmart analyzes sales performance across a subset of stores to predict company-wide trends, they're using sample variance as an unbiased estimator of the broader population variance. This distinction matters significantly in business contexts-sample variance helps executives make informed decisions about entire markets or customer segments based on limited but representative data samples.
Financial institutions like Bank of America extensively use variance in Value-at-Risk calculations, measuring how much investment portfolios might lose during adverse market conditions. Similarly, manufacturing companies leverage variance analysis to monitor production quality-high variance in product dimensions signals process inconsistencies that could impact customer satisfaction and operational costs. The mathematical relationship where variance equals the square of standard deviation (Variance = σ²) provides the foundation for advanced risk modeling and predictive analytics.
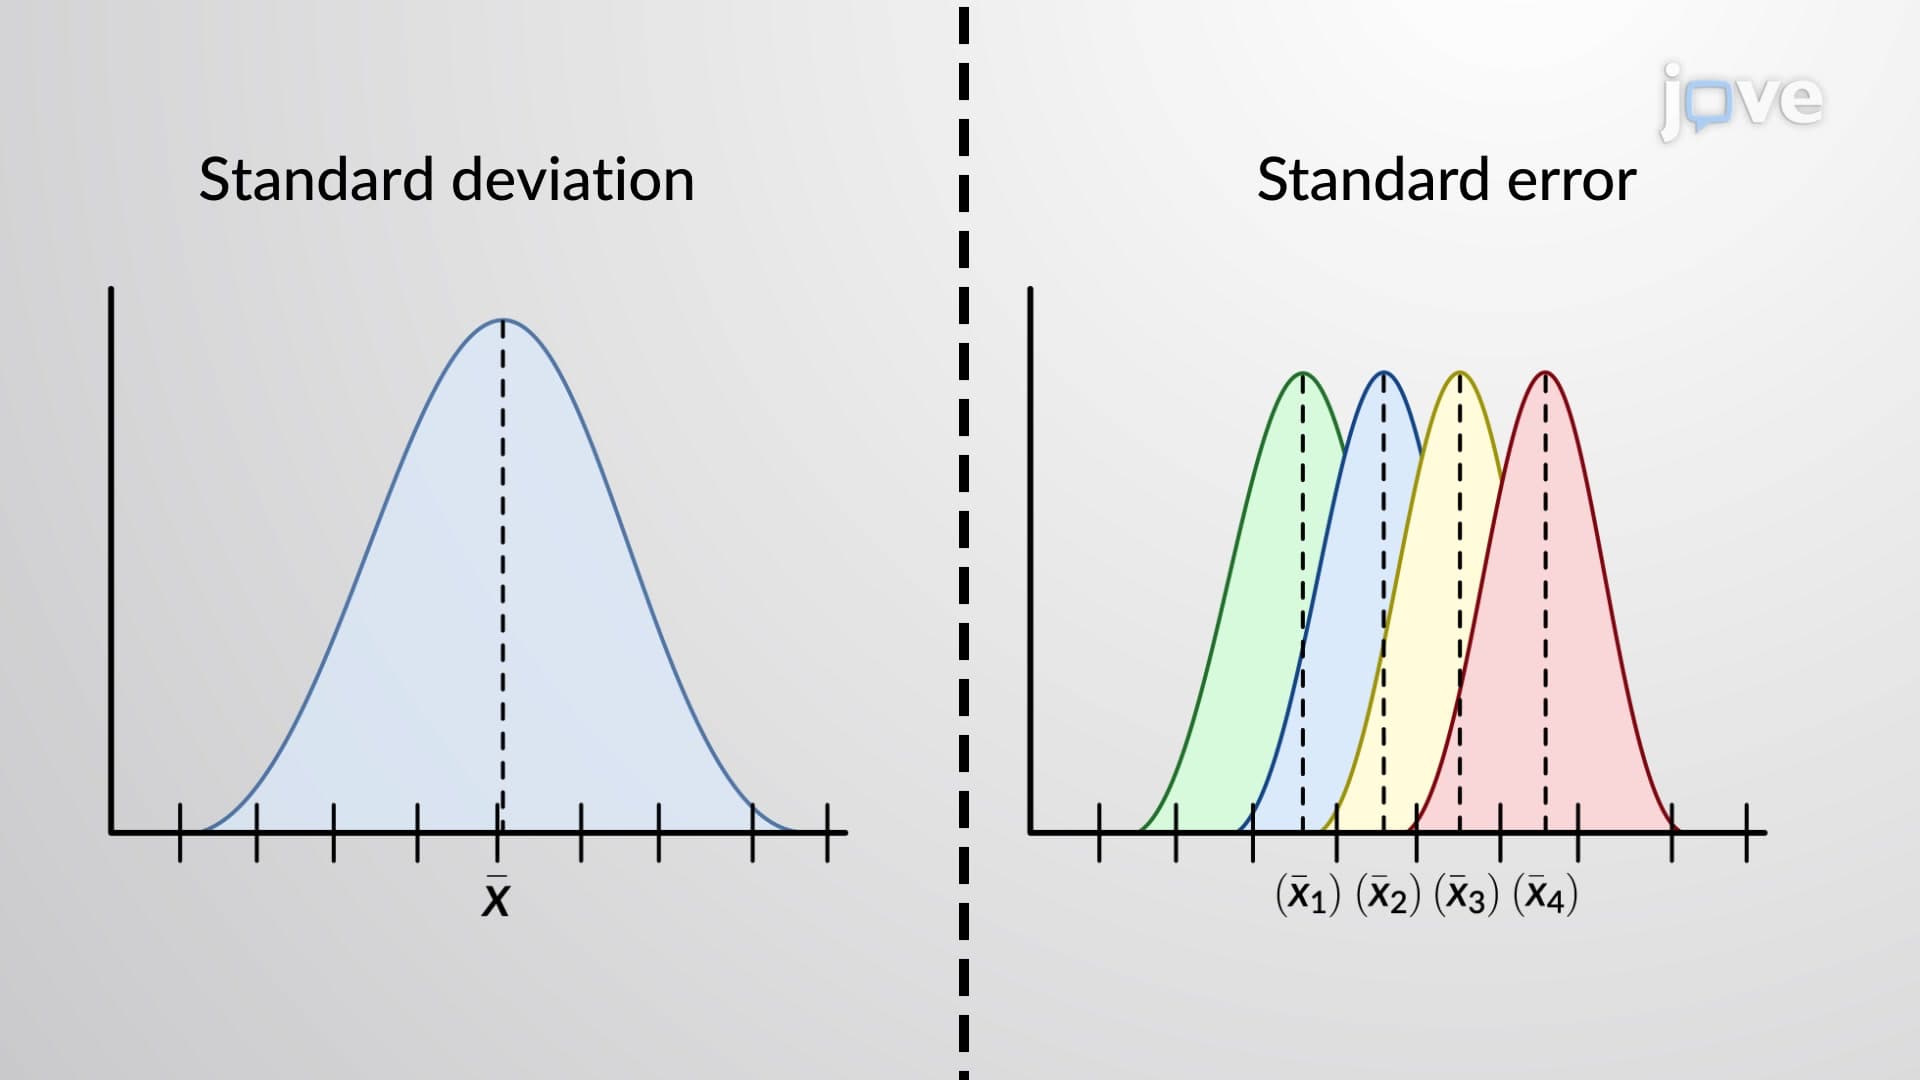
The primary challenge with variance lies in its units-if analyzing quarterly revenue data in millions of dollars, variance appears in "millions of dollars squared," making direct interpretation difficult for executive presentations and stakeholder communications. This explains why most business reports emphasize standard deviation over variance, as standard deviation maintains the same units as the original data. However, variance remains crucial for underlying statistical calculations in business intelligence platforms, financial modeling software, and advanced analytics applications that drive strategic decision-making across industries.
Related Micro-courses