Loading subject page…


118,410 views


Video Summary: What Is Coefficient of Variation
Ever wondered why a $100 stock price swing feels different for Amazon versus a penny stock? The coefficient of variation reveals the true relative risk by comparing variability to the mean, making it invaluable for comparing datasets with different scales or units. From analyzing SAT score distributions across US high schools to evaluating investment portfolios on Wall Street, understanding what is coefficient of variation helps students and professionals make data-driven comparisons. Watch the full video on JoVE Coach to master this concept with expert-led visuals and step-by-step explanations.
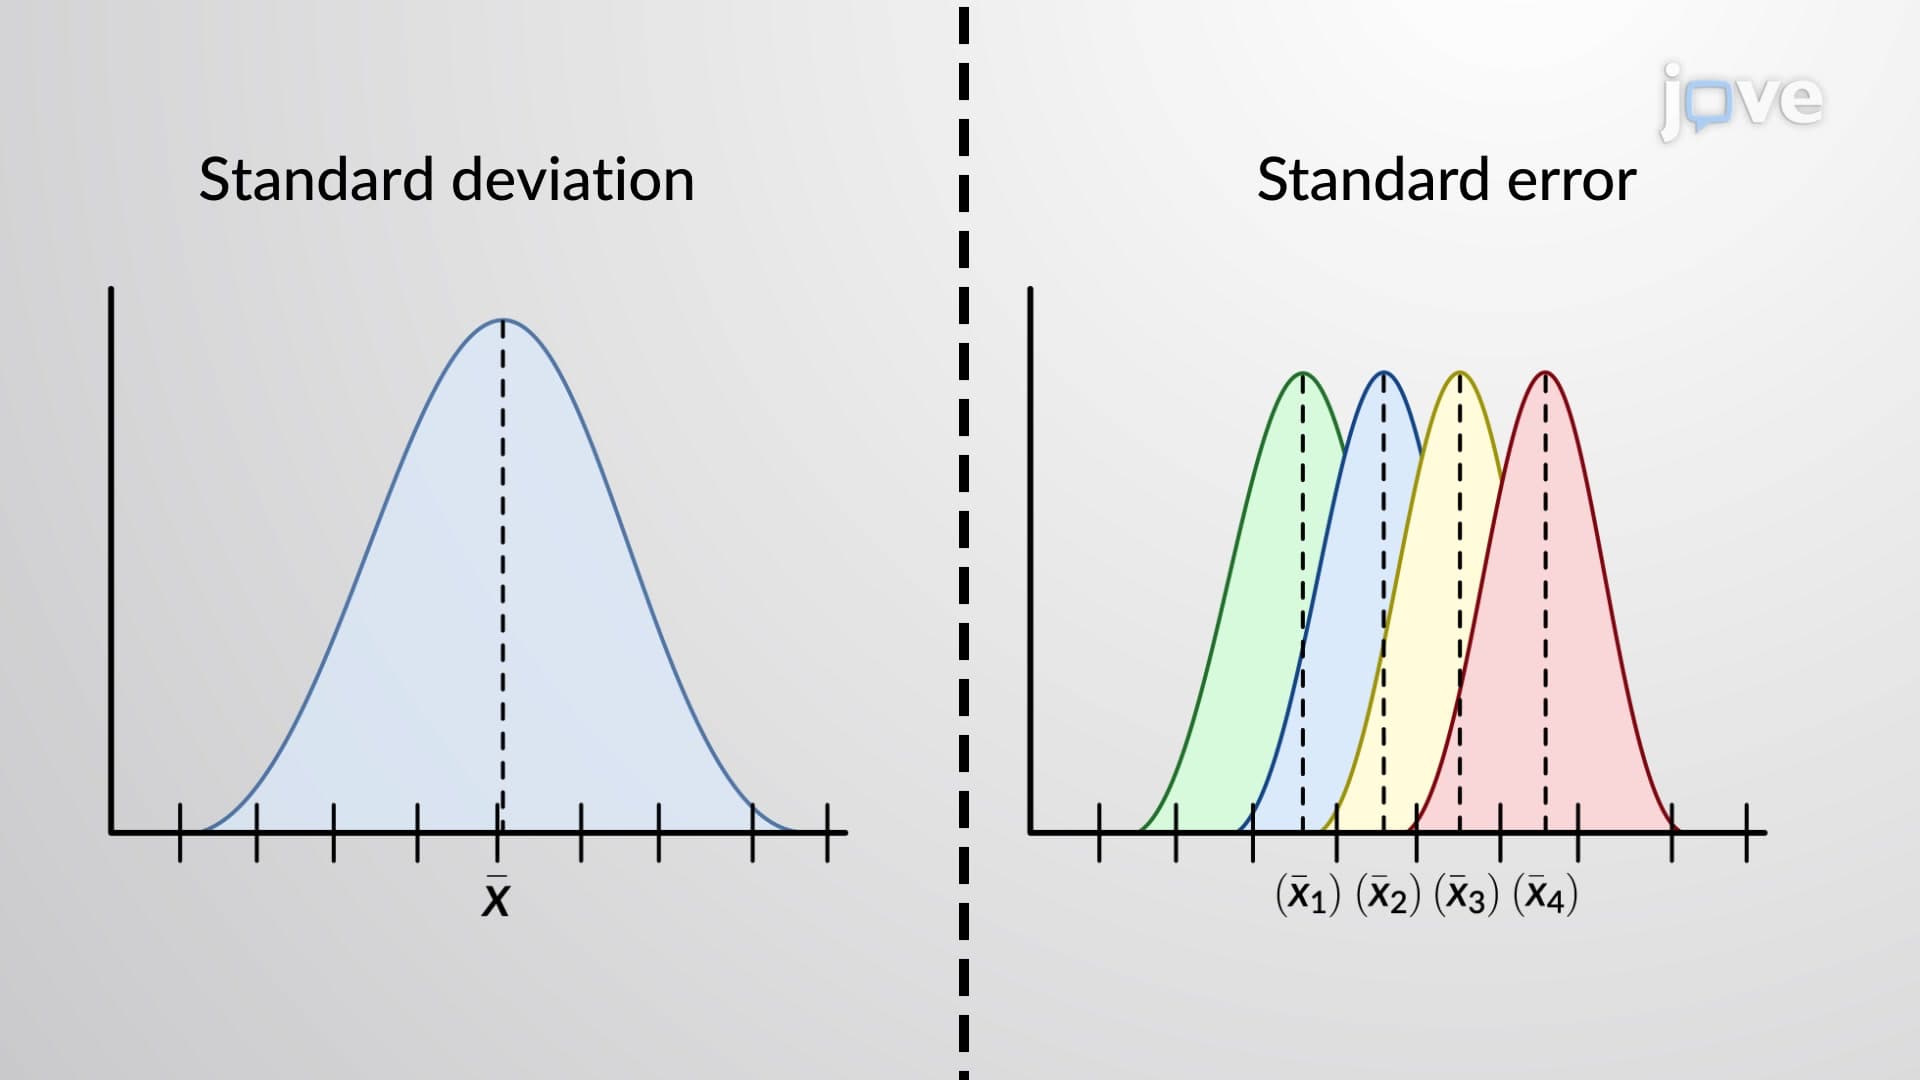
The coefficient of variation serves as statistics' great equalizer, allowing meaningful comparisons between datasets that would otherwise be incomparable. While standard deviation measures absolute spread, coefficient of variation measures relative spread by expressing variability as a percentage of the mean. This standardization makes it particularly valuable when comparing phenomena measured in different units or having vastly different magnitudes.
The coefficient of variation formula is elegantly simple: CV = (Standard Deviation / Mean) × 100%. For sample data, this becomes CV = (s / x̄) × 100%, while population data uses CV = (σ / μ) × 100%. This ratio transforms absolute measures into relative ones, creating a dimensionless percentage that facilitates direct comparisons across diverse datasets.
In American education, coefficient of variation helps compare SAT score variability across different high schools, regardless of their average performance levels. A prestigious prep school with a mean SAT score of 1450 and standard deviation of 50 has a CV of 3.4%, while a diverse public school with mean 1100 and standard deviation 120 has a CV of 10.9%, revealing greater relative variability despite lower absolute spread.
Financial markets provide another compelling application. Consider comparing Apple stock (trading around $180) with Tesla (around $240). A $5 daily price swing represents different relative volatilities for each stock. The coefficient of variation standardizes this comparison, helping investors assess true risk levels. Portfolio managers use CV to evaluate mutual fund consistency, with lower values indicating more predictable performance relative to returns.
Students preparing for AP Statistics or college-level courses must understand coefficient of variation's limitations. When means approach zero, CV becomes unstable or undefined, making it unsuitable for datasets with values clustering around zero. Additionally, CV works best with ratio data (true zero point) rather than interval data. Understanding these constraints proves crucial for proper application in academic and professional settings.
The coefficient of variation frequently appears in college statistics courses, MCAT preparation, and business school curricula, making it essential knowledge for students pursuing STEM or business careers.
Related Micro-courses