Loading video…


 11 Concepts
 118.4K views

Video Summary: Empirical Method to Interpret Standard Deviation Guide
Did you know that 68% of American college students' SAT scores fall within a predictable range? The empirical method to interpret standard deviation makes this statistical prediction possible by revealing how data spreads around the average in bell-shaped distributions. For instance, if US manufacturing quality control finds product weights averaging 500 grams with an 8-gram standard deviation, this method predicts exactly how many items fall within acceptable limits. Watch the full video on JoVE Coach to master this concept with expert-led visuals and step-by-step explanations.
The empirical method to interpret standard deviation, commonly known as the empirical rule or three-sigma rule, serves as a cornerstone of statistical analysis for normally distributed data. This powerful tool transforms abstract standard deviation values into concrete, interpretable percentages that reveal how data clusters around the mean. Unlike complex statistical calculations, this method provides an intuitive framework that high school and college students can readily apply across multiple disciplines.
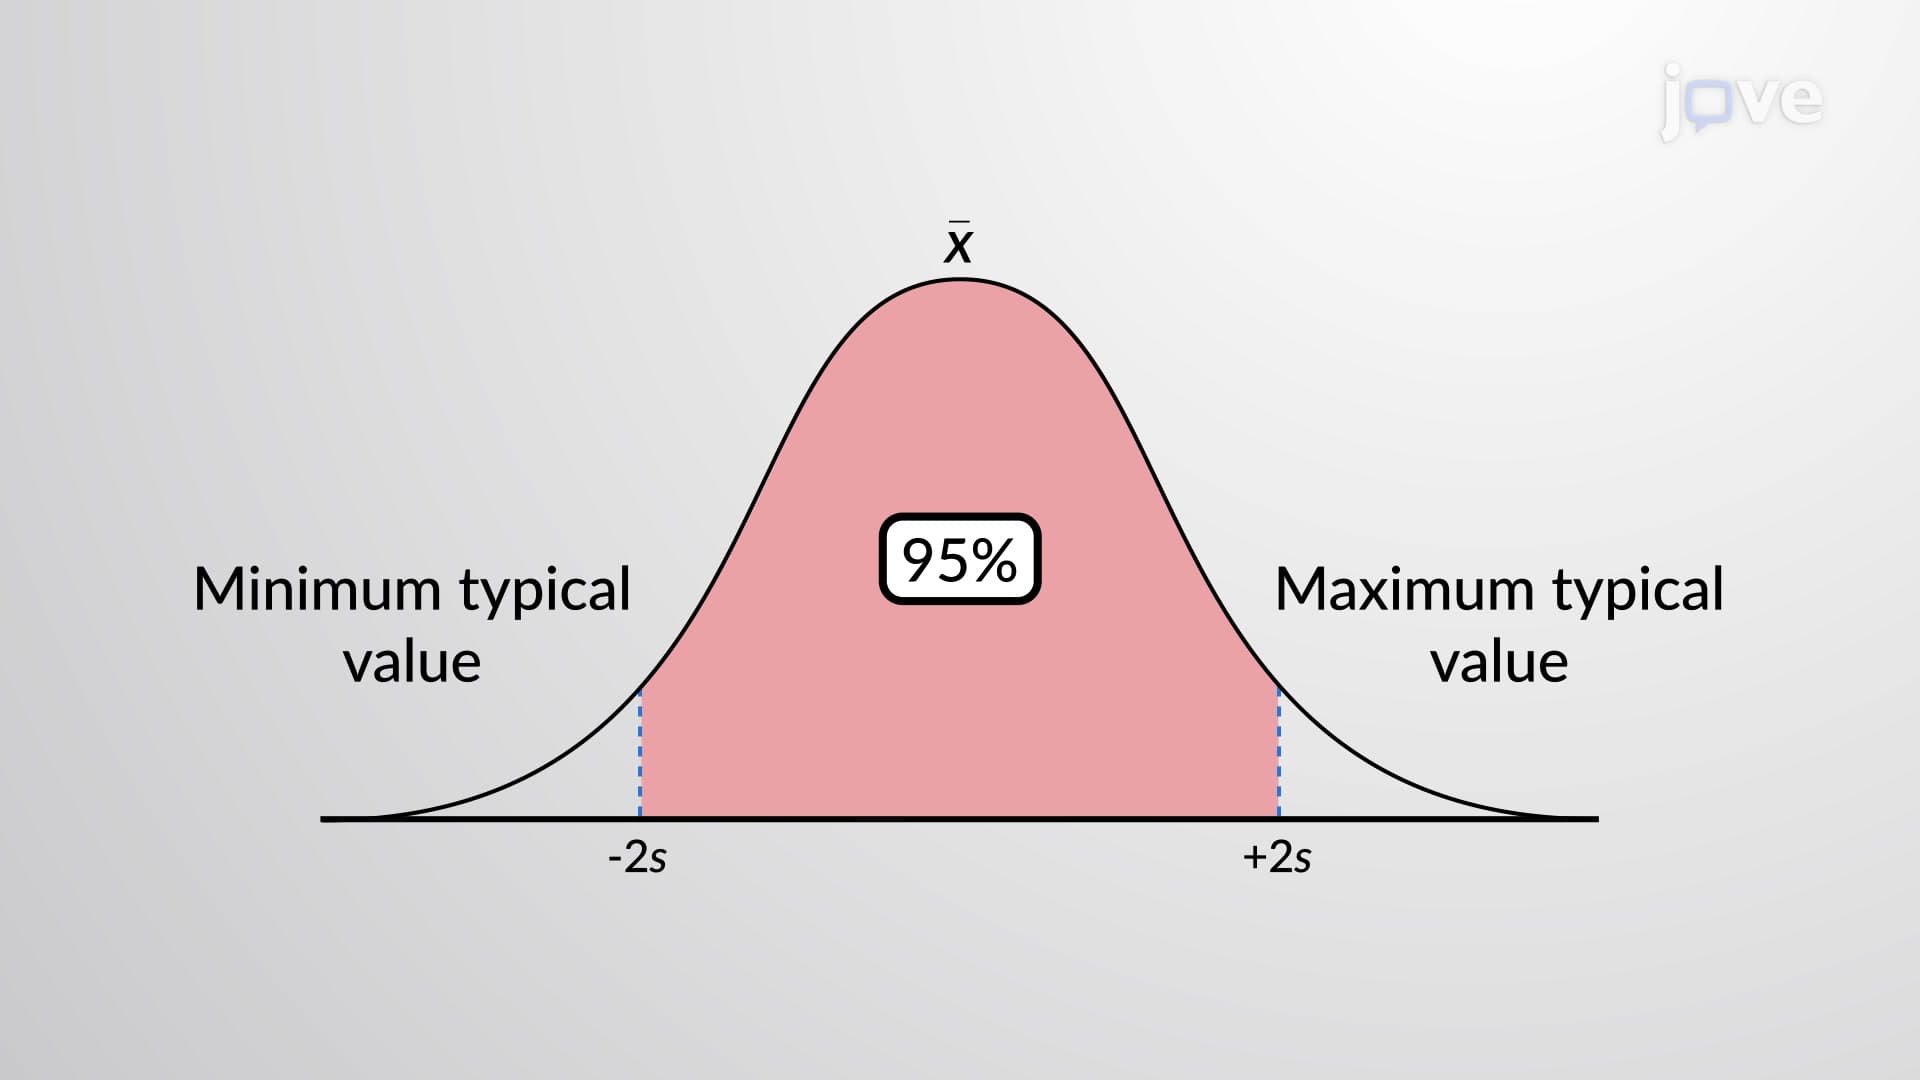
The empirical rule operates on three fundamental principles. Within one standard deviation of the mean, approximately 68% of all data points reside. Expanding to two standard deviations captures roughly 95% of values, while three standard deviations encompass 99.7% of the dataset. Consider US standardized testing: if SAT math scores average 520 with a standard deviation of 115, this rule predicts that 68% of test-takers score between 405 and 635 points. This predictive power makes the empirical method invaluable for educational assessment and college admissions planning.
US quality control managers extensively utilize this empirical method across manufacturing sectors. Boeing aircraft engineers might monitor component tolerances where bolt diameters average 2.50 inches with a 0.02-inch standard deviation. The empirical rule immediately reveals that 95% of acceptable bolts measure between 2.46 and 2.54 inches, establishing clear quality thresholds. Similarly, pharmaceutical companies use this method to ensure drug dosages remain within FDA-approved ranges, while agricultural researchers apply it to crop yield predictions across American farming regions.
Students preparing for AP Statistics, college statistics courses, or standardized exams benefit tremendously from mastering this concept. The empirical method frequently appears on AP exams, where students must interpret real datasets and make predictions. Medical school applicants encounter similar applications on the MCAT, particularly in behavioral sciences sections. Understanding this method also proves essential for business majors analyzing market research data and psychology students interpreting experimental results. The key to exam success lies in recognizing when data follows normal distribution patterns and confidently applying the 68-95-99.7 percentages to solve complex problems.
Related Micro-courses