Loading video…

 11 Concepts
 118.4K views

Video Summary: Variation Definition
Ever wonder why two NBA teams can have identical average player heights but look completely different on the court? The variation definition reveals how data points spread around their center, making it crucial for understanding datasets beyond simple averages. Consider SAT scores from two high schools: both might average 1200, but one school's scores cluster tightly (1180-1220) while another spans widely (1000-1400). Variation measures like range, standard deviation, and variance quantify this spread, helping analysts interpret data accurately in fields from sports analytics to college admissions. Watch the full video on JoVE Coach to master this concept with expert-led visuals and step-by-step explanations.
The variation definition forms a cornerstone of statistical analysis, describing how individual data points deviate from the dataset's central value. Unlike measures of central tendency (mean, median, mode) that identify where data clusters, variation quantifies the scatter or dispersion of values. This distinction proves critical when analyzing everything from standardized test performance to manufacturing quality control.
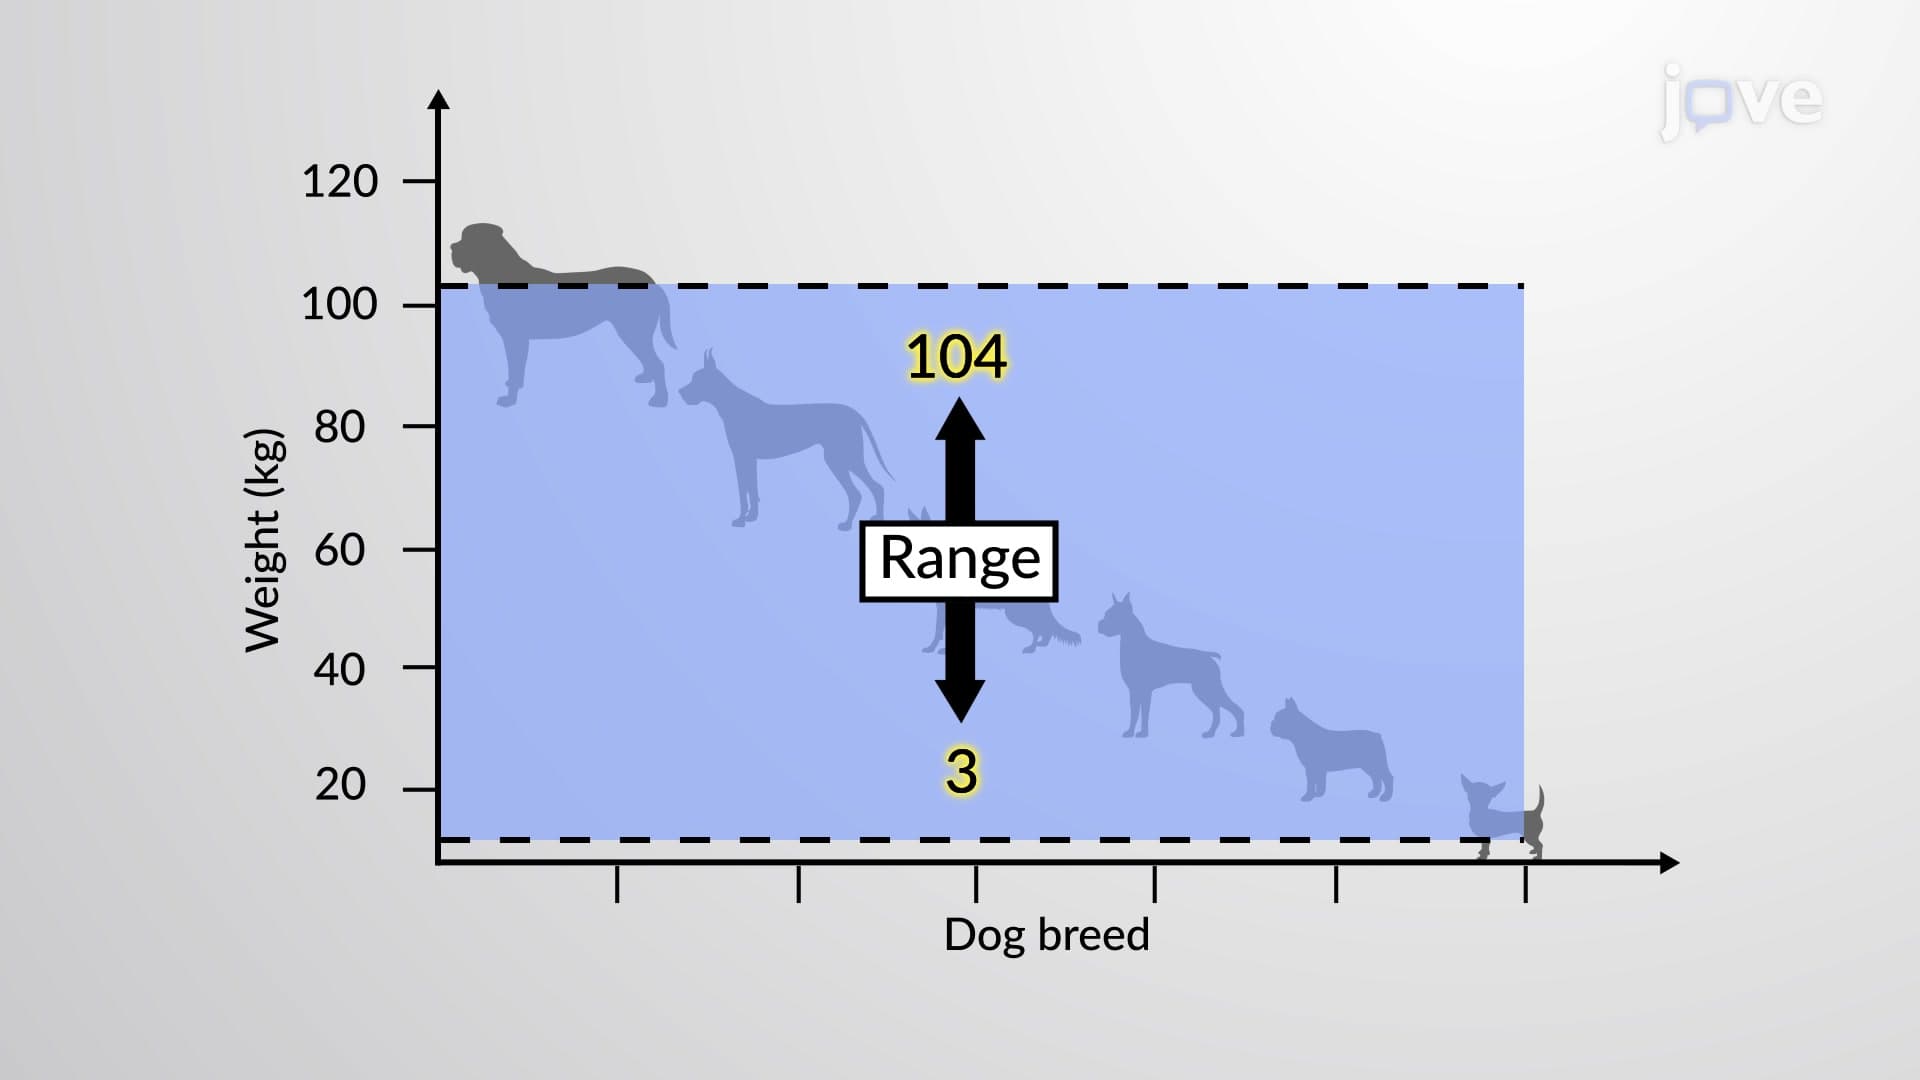
Range represents the simplest variation measure, calculated as the difference between maximum and minimum values. For instance, if AP Calculus scores in a class range from 3 to 5, the range equals 2 points. While easy to compute, range only considers extreme values and ignores the distribution of intermediate data points.
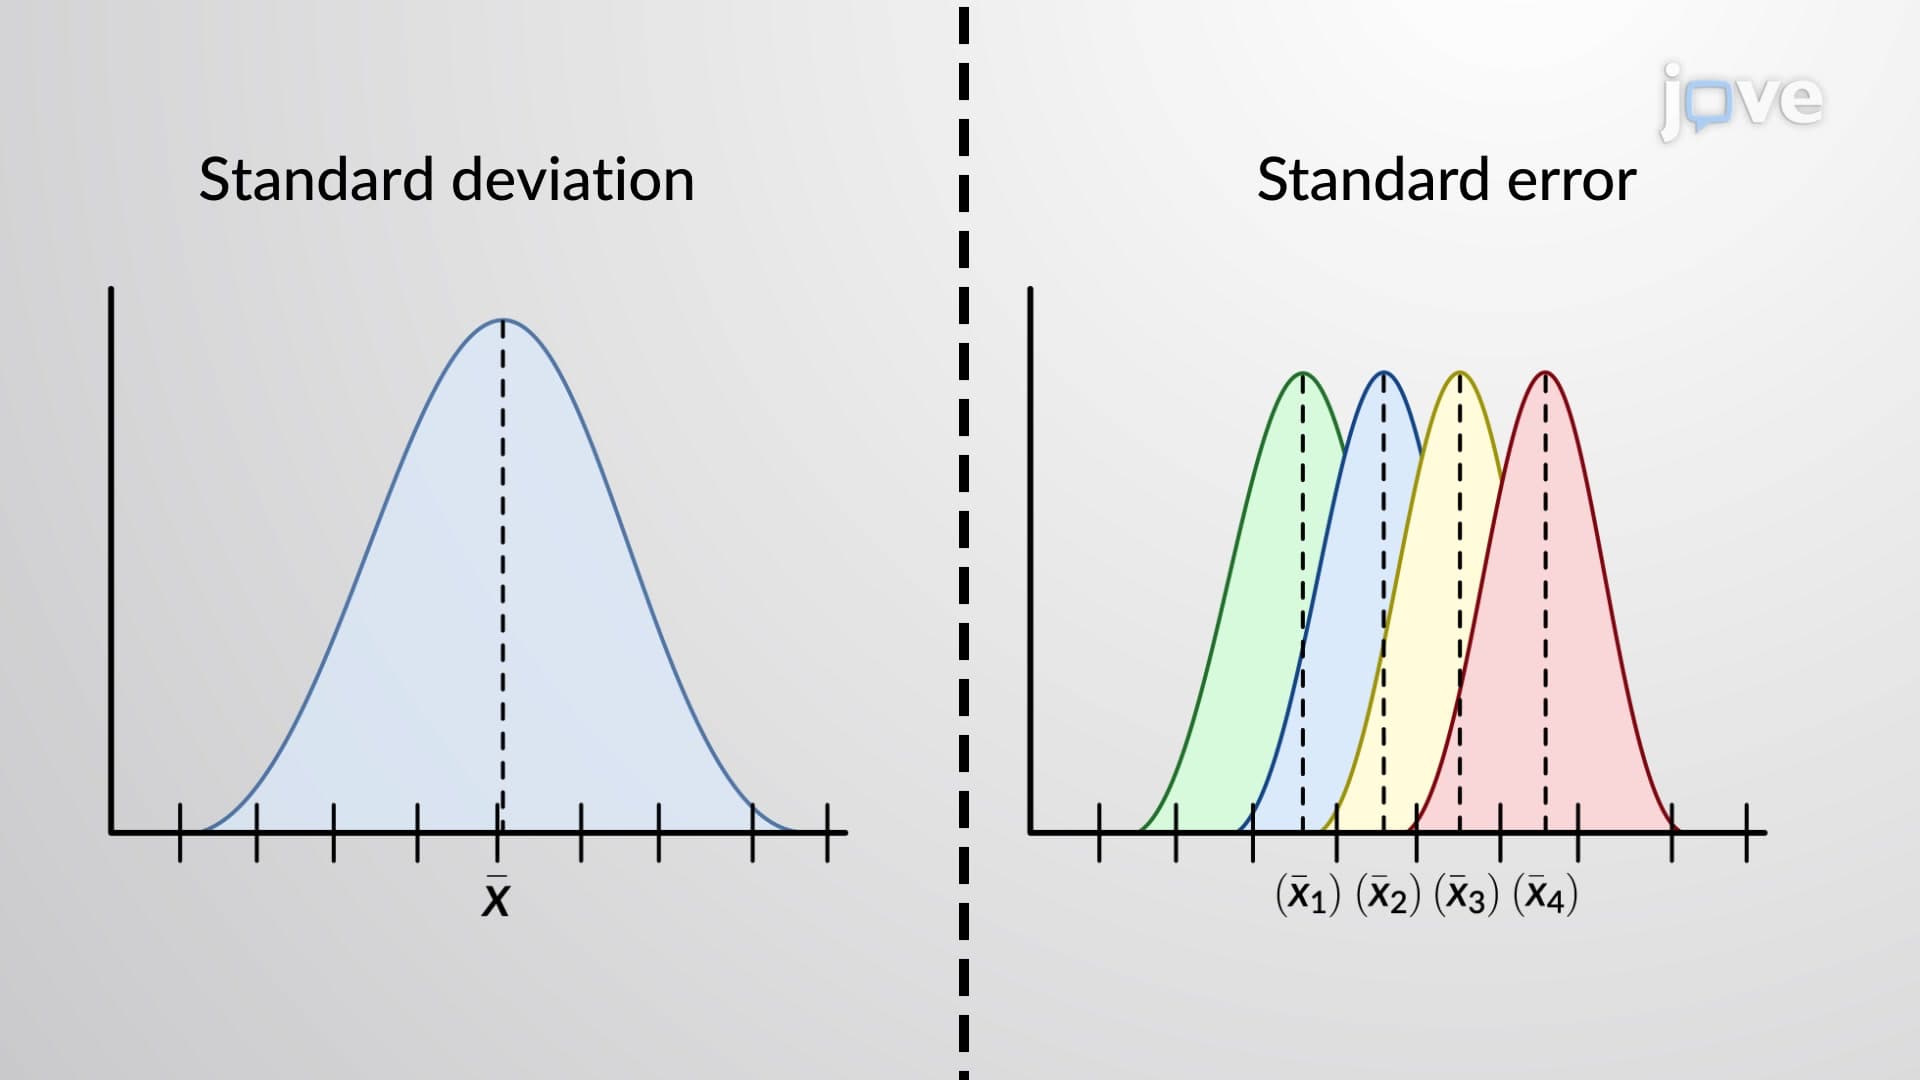
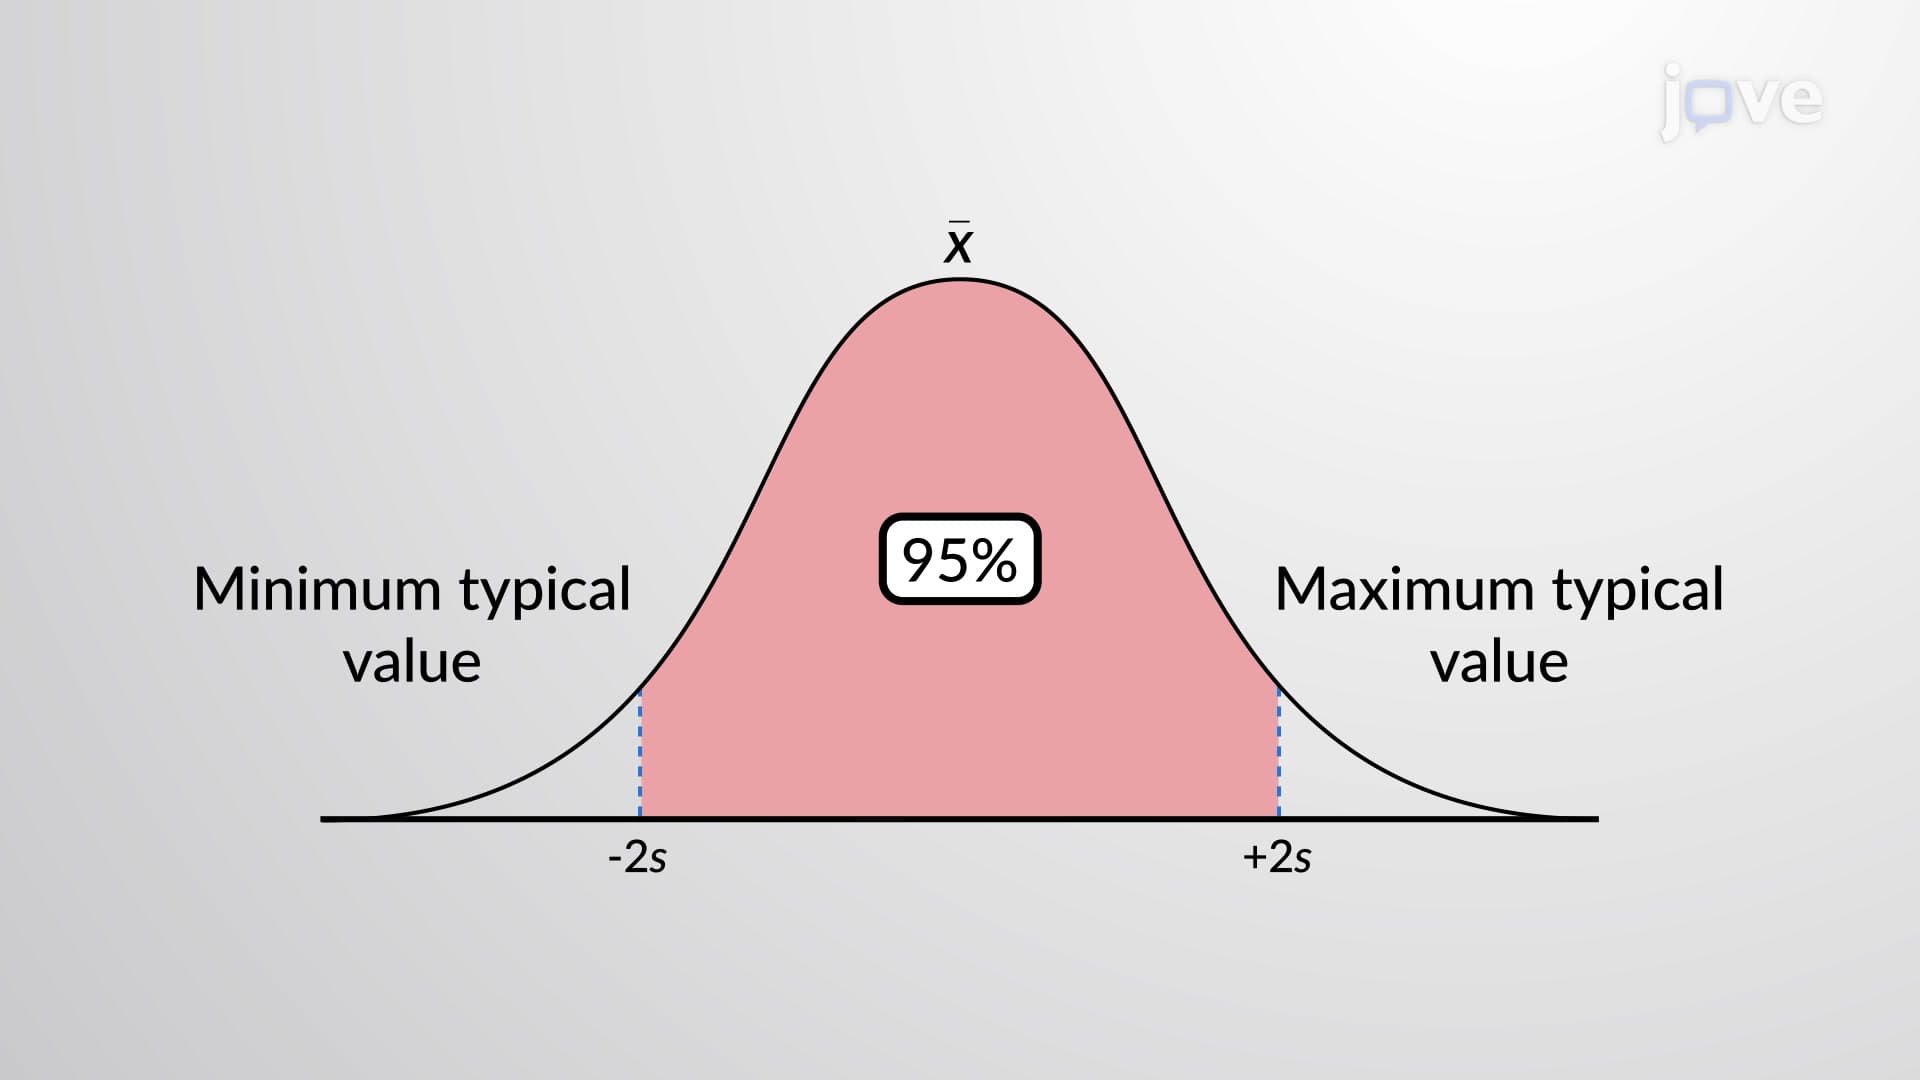
Standard deviation provides a more comprehensive view by measuring average distance from the mean. In college admissions, universities often report average SAT scores with standard deviations-a school might list 1300 ± 120, indicating most students score between 1180-1420. This measure helps admissions counselors understand score consistency within applicant pools.
Variance equals the squared standard deviation, amplifying larger deviations while maintaining mathematical properties useful in advanced statistics. Though less intuitive than standard deviation, variance plays crucial roles in hypothesis testing and regression analysis covered in AP Statistics and introductory college courses.
Stock market analysis exemplifies variation's practical importance. Two mutual funds might generate identical 8% annual returns, but Fund A's consistent 7-9% range appeals to conservative investors while Fund B's volatile 0-16% range attracts risk-takers. Understanding variation helps investors align choices with risk tolerance.
In healthcare, variation analysis guides treatment decisions. Blood pressure readings averaging 130/85 mmHg with low variation suggest stable hypertension, while high variation might indicate medication compliance issues or underlying conditions requiring different interventions.
Academic assessments frequently test variation concepts. AP Statistics exams regularly include problems comparing dataset spreads, while college statistics courses emphasize variation's role in inferential statistics. SAT Math sections may present box plots or histograms requiring variation interpretation for college-bound students.
Related Micro-courses