Loading subject page…
- Statistics
- Measures of Variation
- Range Rule of Thumb to Interpret Standard Deviation
Micro-course: Measures of Variation
118,400 views
Learn key concepts and earn your certificate.





Range Rule of Thumb to Interpret Standard Deviation

00:00
01:13
Video Summary: Range Rule of Thumb to Explained
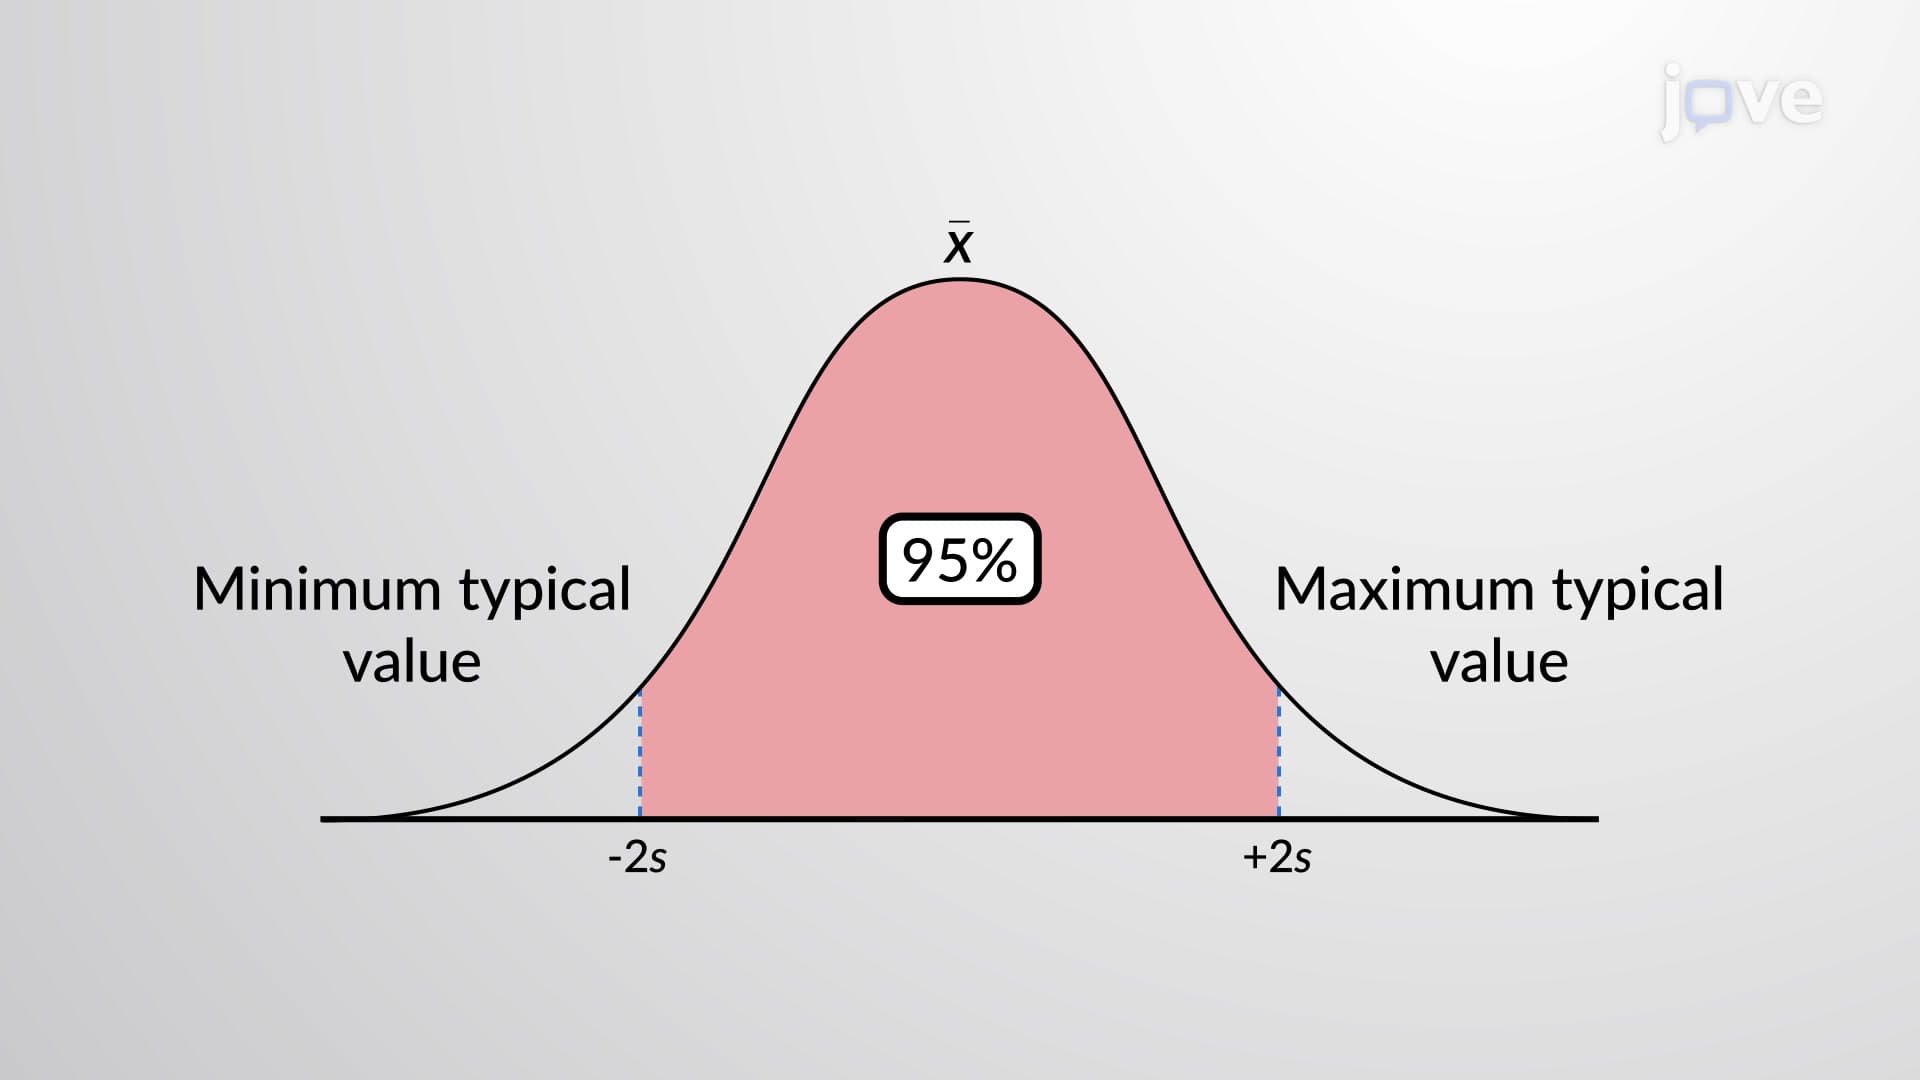
Ever wondered how the SAT predicts that 95% of test scores fall between 400-1600? The range rule of thumb to estimate data spread makes this possible through a simple statistical shortcut. This fundamental concept helps students quickly identify unusual scores-like a student scoring 200 on the SAT-as clear outliers. By applying basic formulas, you can estimate standard deviation from known ranges or predict typical value ranges from standard deviation, making complex datasets instantly interpretable. Watch the full video on JoVE Coach to master this concept with expert-led visuals and step-by-step explanations.
- Understand how the Range Rule of Thumb To Explained simplifies standard deviation interpretation using the 95% rule
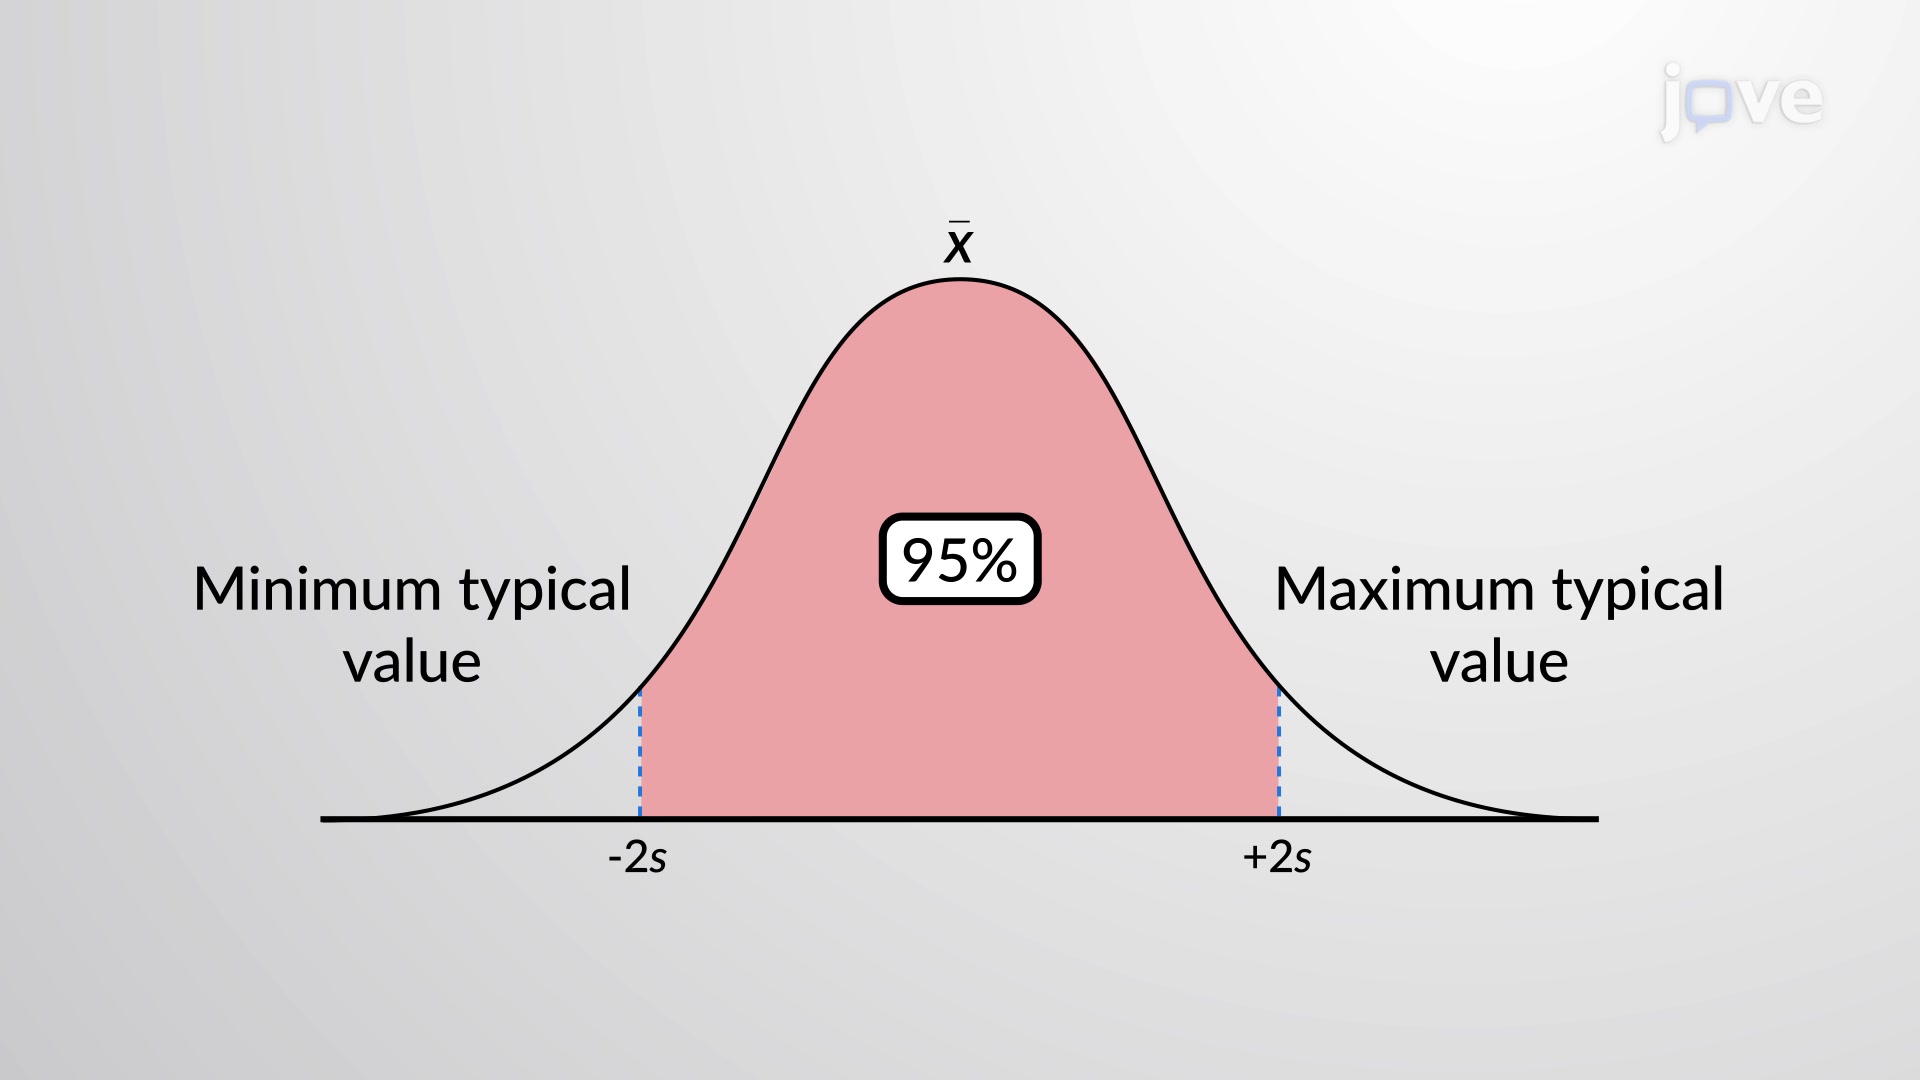
- Identify outliers in datasets by calculating typical value ranges using two standard deviations from the mean
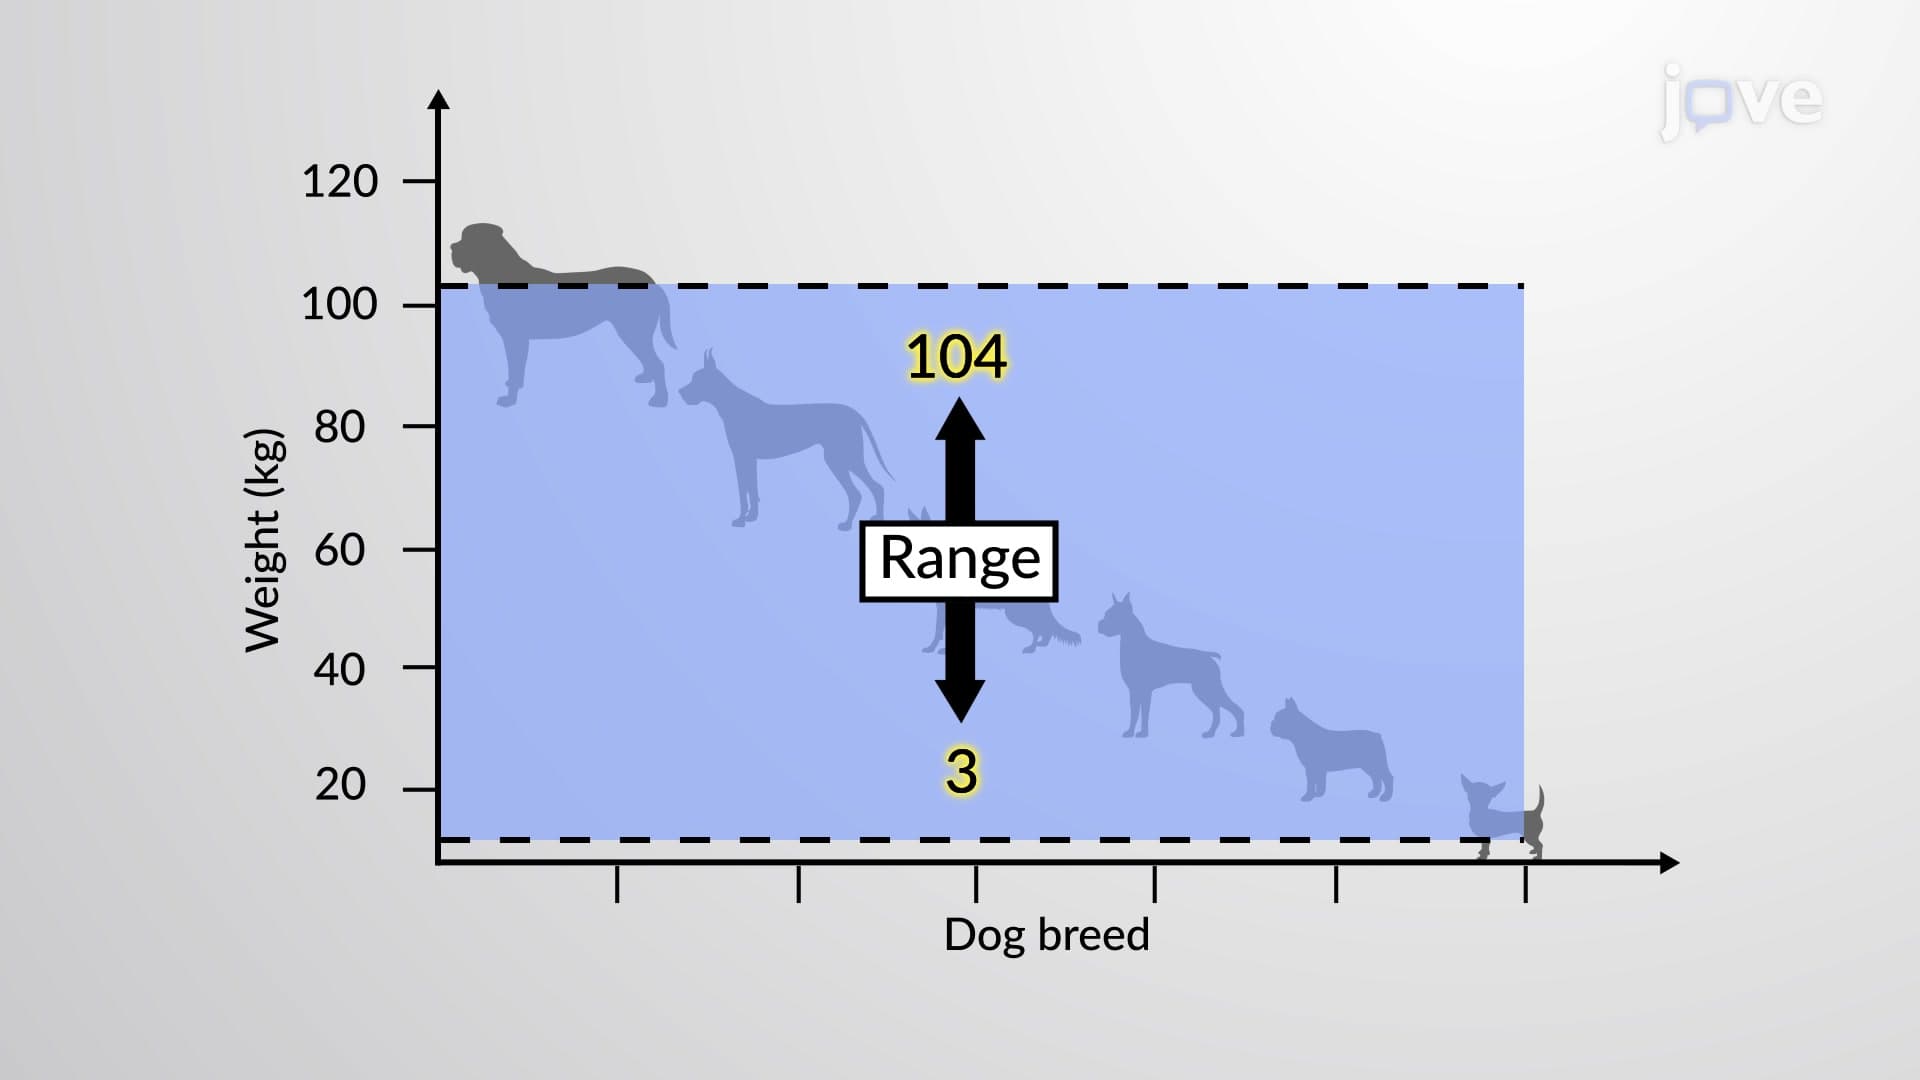
- Apply the range-to-standard-deviation formula (range ÷ 4) to estimate unknown standard deviations
- Analyze real exam score distributions to predict minimum and maximum typical performance levels
- Evaluate when the range rule of thumb fails to accurately predict outliers in skewed datasets
- Compare range rule estimates with actual calculated standard deviations to assess accuracy
- Recognize the practical limitations and appropriate applications of this statistical estimation tool
- Explore how the empirical rule (68-95-99.7 rule) provides the theoretical foundation for range rule calculations
Understanding the Range Rule of Thumb To Explained
The Range Rule of Thumb To Explained represents one of statistics' most practical estimation tools, allowing students to quickly interpret data spread without complex calculations. This method leverages the empirical rule, which states that approximately 95% of normally distributed data falls within two standard deviations of the mean. For high school and college students encountering statistics in AP courses, SAT prep, or introductory college statistics, this concept provides an accessible entry point into understanding data variability.
Calculating Typical Values from Standard Deviation
When you know a dataset's mean and standard deviation, the range rule helps estimate typical minimum and maximum values using the formula: Typical Range = Mean ± 2 × Standard Deviation. Consider ACT scores with a national mean of 21 and standard deviation of 5. Using this formula, typical scores range from 11 to 31 (21 - 10 to 21 + 10). Students scoring below 11 or above 31 would be considered outliers, representing the top 5% of unusual performances. This application proves invaluable for college admissions counselors and students setting realistic score targets.
Estimating Standard Deviation from Known Ranges
Conversely, when you know a dataset's range but not its standard deviation, divide the range by 4 for a rough estimate. If AP Biology exam scores range from 20 to 80 points, the estimated standard deviation equals (80-20) ÷ 4 = 15 points. This quick calculation helps teachers understand class performance variability without accessing individual student data or performing complex statistical computations.
Real-World Applications and Limitations
The range rule of thumb finds extensive application in quality control, medical research, and educational assessment. Manufacturing companies use it to identify defective products, while healthcare professionals apply it to flag abnormal lab results. However, this method assumes normal distribution and fails with highly skewed data or datasets containing extreme outliers. For instance, income distributions often contain extreme high earners that violate the rule's assumptions, leading to inaccurate standard deviation estimates. Students preparing for MCAT or nursing entrance exams should recognize these limitations when analyzing biological or medical data.
Frequently Asked Questions
The Range Rule of Thumb To Explained is a statistical estimation method that uses the principle that 95% of normally distributed data falls within two standard deviations of the mean. It allows you to quickly estimate either typical value ranges from known standard deviation or approximate standard deviation from known data ranges. This tool simplifies complex statistical analysis into manageable calculations perfect for quick assessments.
AP Statistics frequently tests this concept through multiple-choice questions asking students to identify outliers or estimate standard deviations from given scenarios. Students must apply the ±2 standard deviation rule to determine if specific values are unusual. Practice problems often involve SAT scores, manufacturing quality control, or biological measurements requiring range rule applications.
Yes, MCAT psychology and sociology sections occasionally test statistical reasoning including outlier identification and data interpretation. The range rule helps you quickly assess whether research findings represent typical or unusual results. Medical school preparation courses emphasize this concept for analyzing experimental data and understanding population health statistics.
Nurses apply the range rule when monitoring vital signs to identify patients requiring immediate attention. If a patient's blood pressure, heart rate, or temperature falls outside the typical range (mean ± 2 standard deviations), it triggers clinical assessment protocols. This statistical tool helps healthcare professionals distinguish between normal variation and potentially dangerous outliers requiring medical intervention.
Not at all-the range rule requires only basic arithmetic operations like addition, subtraction, multiplication, and division. Students comfortable with algebra can master this concept quickly. The mathematical foundation involves simple formulas that high school students regularly encounter, making it one of statistics' most accessible estimation tools.
Practice with real datasets from familiar contexts like test scores, sports statistics, or scientific measurements. Create flashcards with the key formulas and work through multiple examples calculating both directions-from standard deviation to range and from range to standard deviation. Focus on identifying when the rule applies versus when data violates normal distribution assumptions.
Absolutely-confidence intervals represent the natural next step in statistical inference. While the range rule provides quick estimates, confidence intervals offer precise probability statements about population parameters. Understanding the range rule's 95% foundation prepares you for more sophisticated statistical concepts including hypothesis testing and margin of error calculations.
The range rule provides reasonable approximations for normally distributed data but becomes less accurate with skewed distributions or small sample sizes. Expect accuracy within 10-20% for well-behaved datasets, making it suitable for quick estimates but insufficient for precise statistical analysis requiring exact calculations.
Related Micro-courses