Loading video…

 11 Concepts
 118.4K views

Video Summary: What Is Standard Error Mean
Ever wondered why different polls about the same presidential election show slightly different results? The standard error mean explains this statistical phenomenon by measuring how much sample means vary from the true population mean. For instance, if three different polling companies survey 1,000 Americans each about voting preferences, each poll will likely yield slightly different percentages due to sampling variation. This concept helps statisticians understand the precision of their estimates and is fundamental to interpreting research data accurately. Watch the full video on JoVE Coach to master this concept with expert-led visuals and step-by-step explanations.
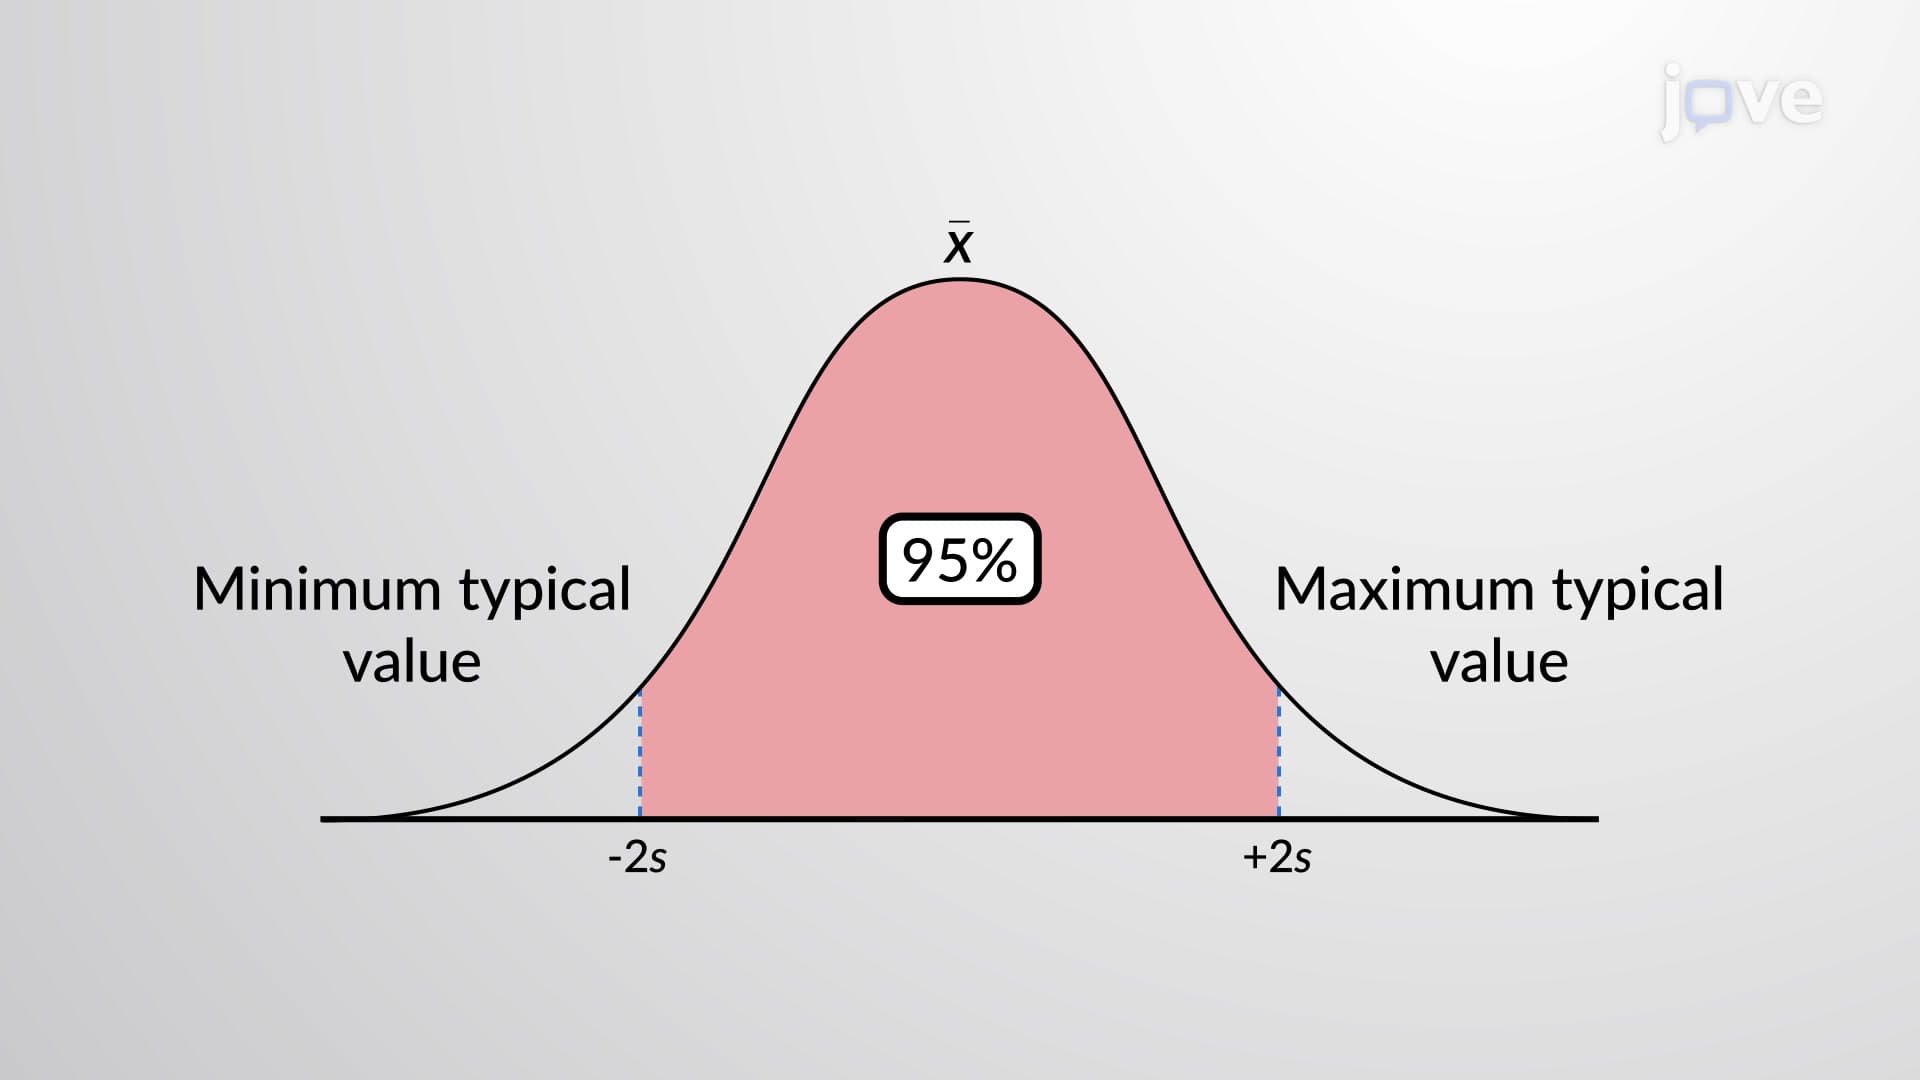
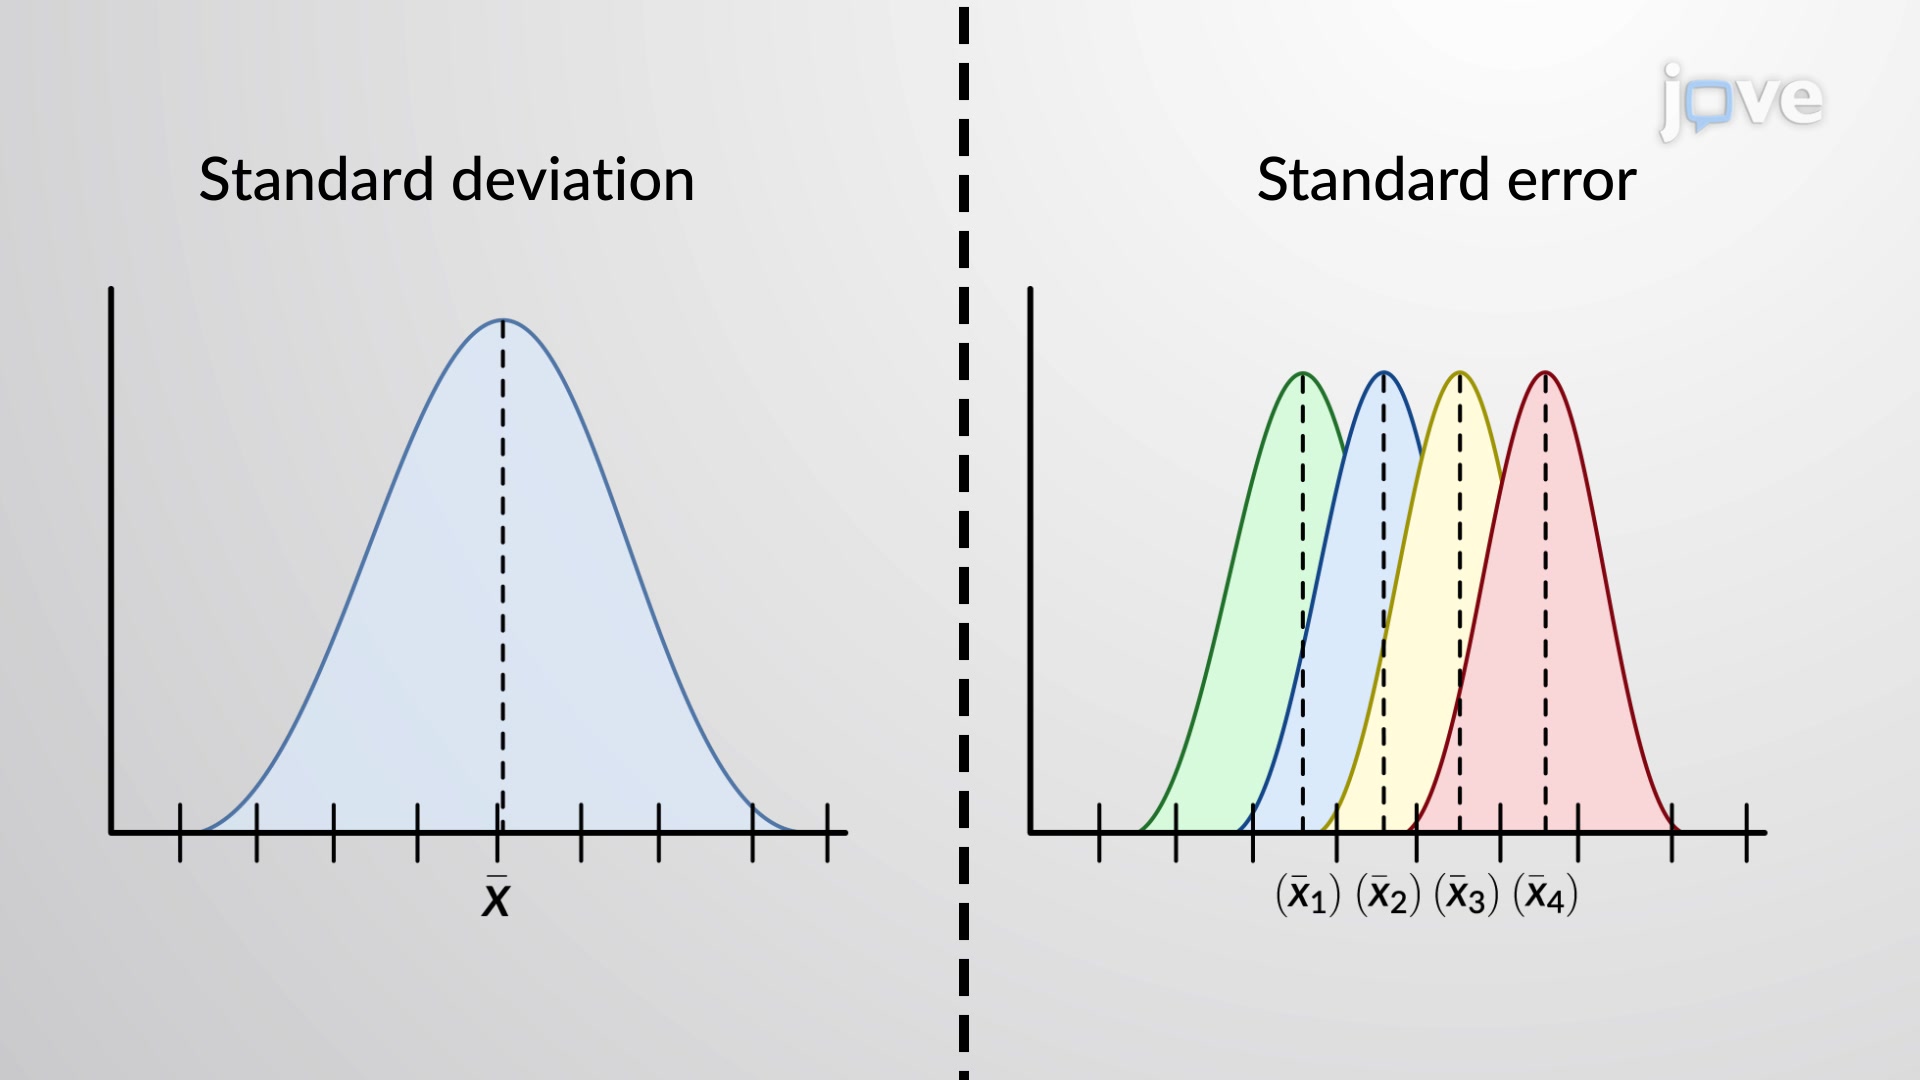
The standard error mean quantifies the precision of a sample mean as an estimate of the population mean. Unlike standard deviation, which measures variability within a single sample, standard error measures how much sample means would vary if we repeatedly drew samples from the same population. This distinction is crucial for understanding statistical inference and research methodology.
Consider a practical example: The CDC wants to estimate the average height of American teenagers. If they survey different high schools across the country, each school's sample will yield a slightly different average height. The standard error tells us how much these sample averages typically differ from the true population average.
The standard error of the mean follows the formula: SE = σ/√n, where σ represents the population standard deviation and n represents the sample size. This elegant relationship reveals two key insights: larger samples produce more precise estimates (smaller standard error), and populations with greater variability require larger samples for the same precision.
For example, if the population standard deviation of SAT scores is 100 points and we sample 25 students, the standard error would be 100/√25 = 20 points. This means our sample mean likely falls within 20 points of the true population mean.
Standard error appears frequently in medical research, educational assessment, and quality control. Clinical trials report standard errors to indicate the precision of treatment effects. The College Board uses standard error concepts when reporting SAT score ranges. Market researchers apply it when interpreting consumer surveys.
In AP Statistics and college-level courses, understanding standard error is essential for hypothesis testing, confidence interval construction, and interpreting p-values. Students encounter this concept in MCAT preparation when analyzing research studies and experimental design questions.
Standard error directly relates to the sampling distribution of means, which follows a normal distribution regardless of the original population's shape (given sufficient sample size). This connection underlies many statistical procedures taught in introductory statistics courses and appears on standardized tests like the AP Statistics exam.
Related Micro-courses