Loading video…

 11 Concepts
 118.4K views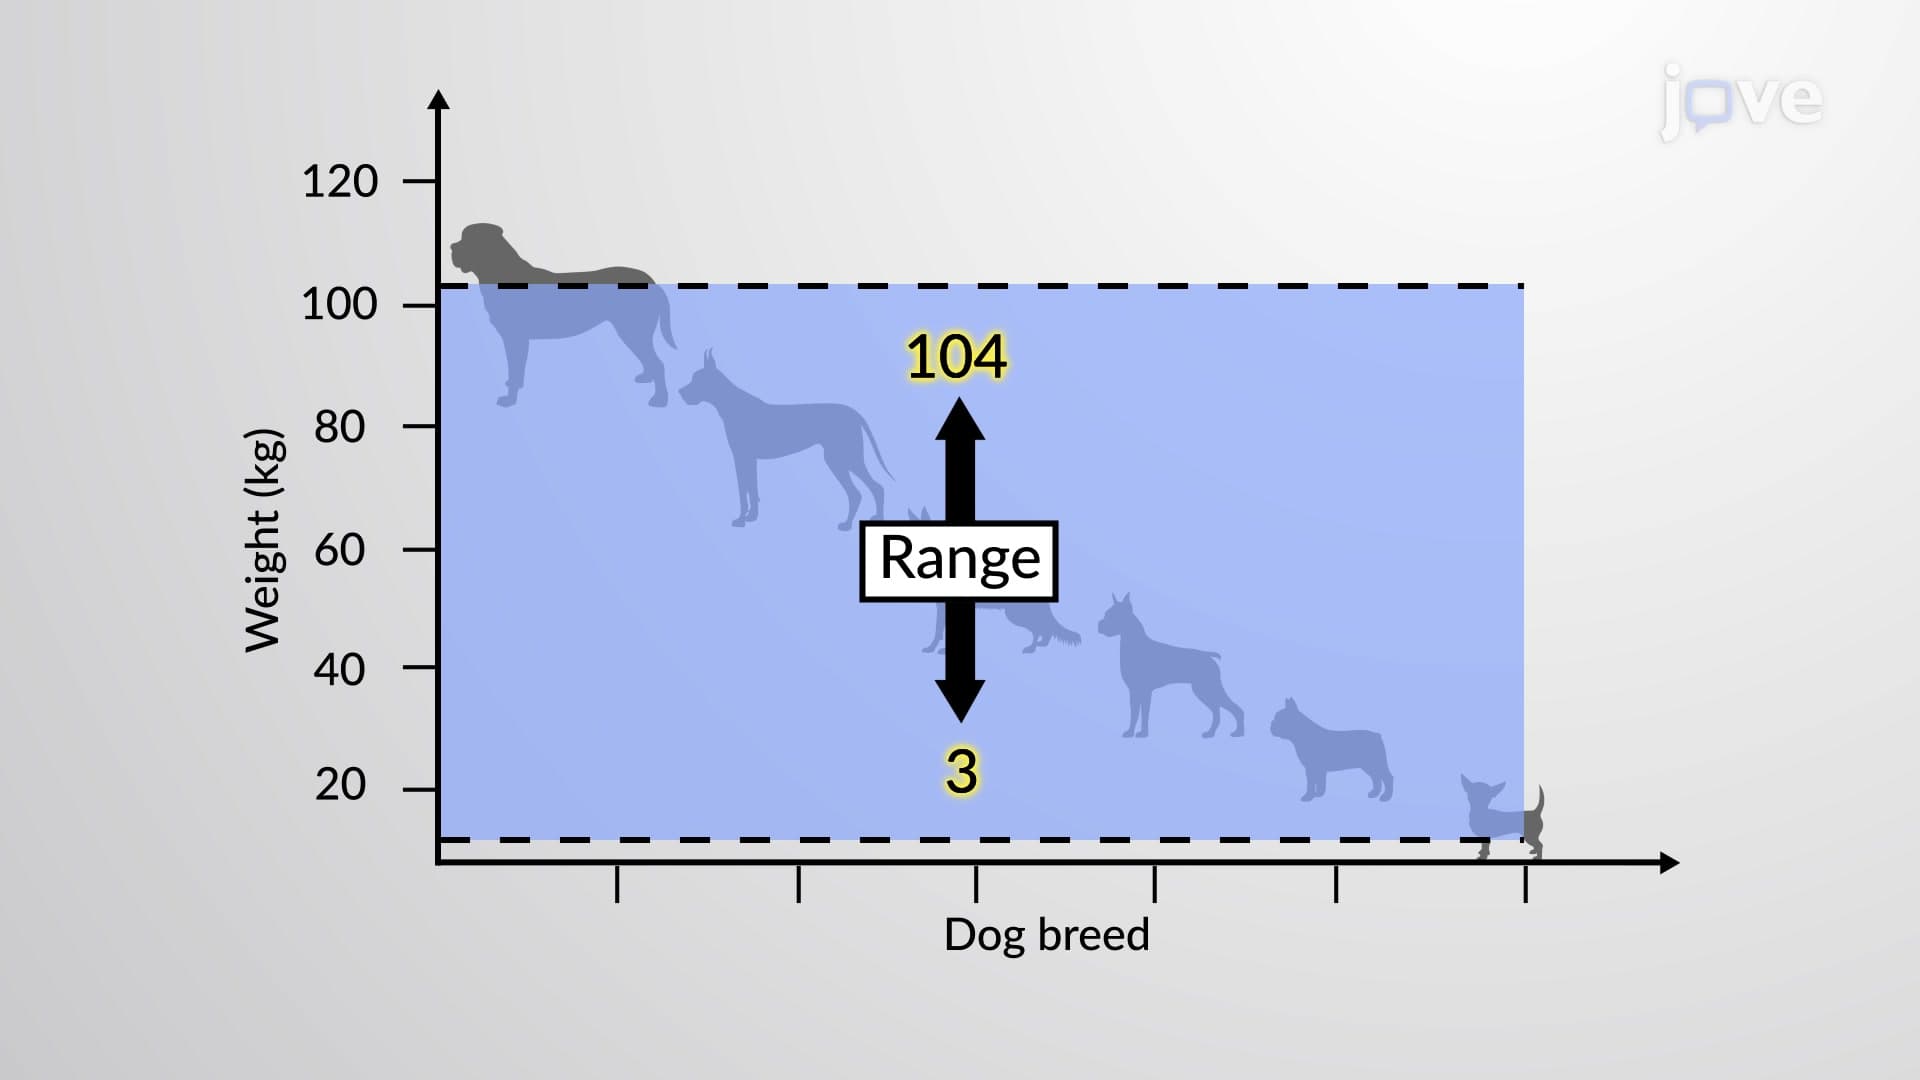

Video Summary: What Is Range
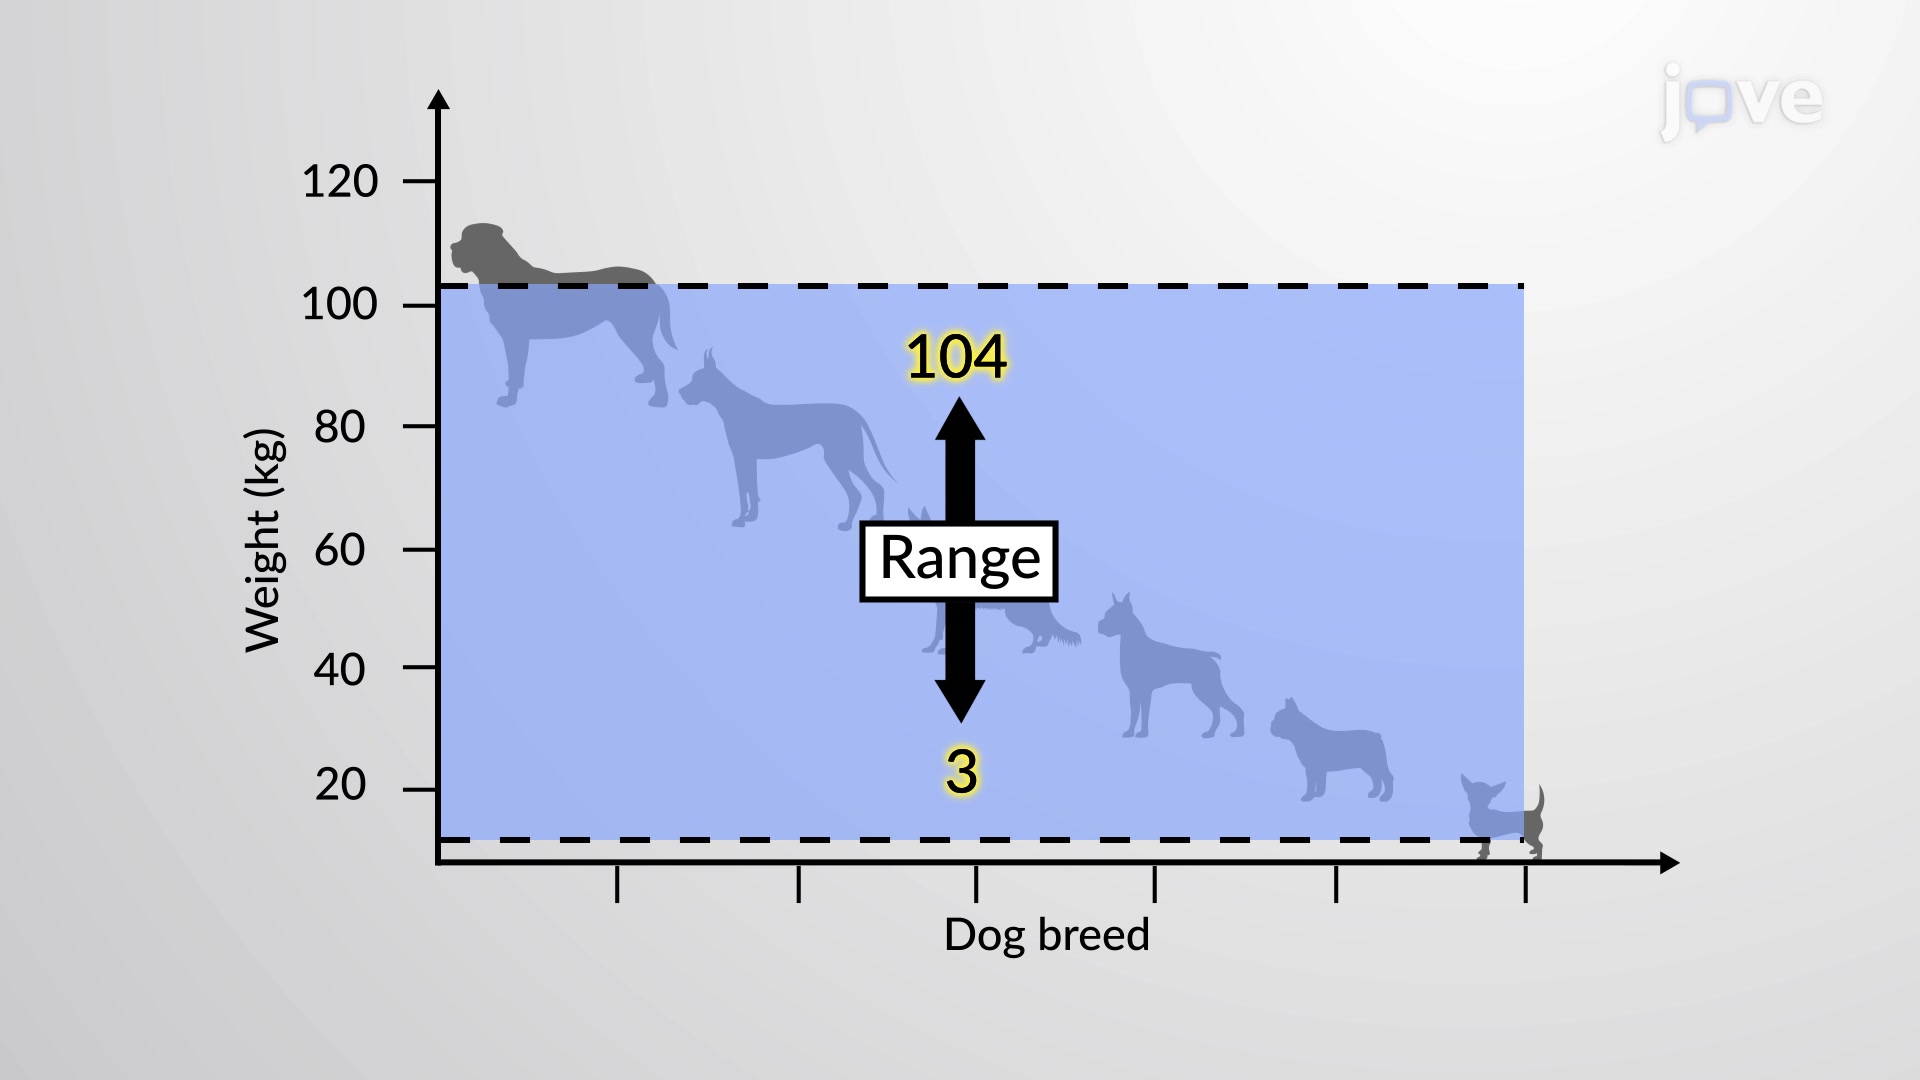
Did you know that the weight difference between America's heaviest dog breed, the English Mastiff, and the lightest, the Chihuahua, spans over 100 pounds? This dramatic difference illustrates range, a fundamental statistical measure that captures the spread in any dataset by calculating the difference between maximum and minimum values. From tracking temperature variations across US states to analyzing test scores in your AP Statistics class, understanding What is Range helps you quantify variability in countless real-world scenarios. Watch the full video on JoVE Coach to master this concept with expert-led visuals and step-by-step explanations.
Range represents the most intuitive measure of variability in statistics, capturing how spread out data points are by focusing on the extreme values. The range definition is straightforward: subtract the smallest value from the largest value in your dataset. This simplicity makes range an excellent starting point for students beginning their journey into statistical analysis.
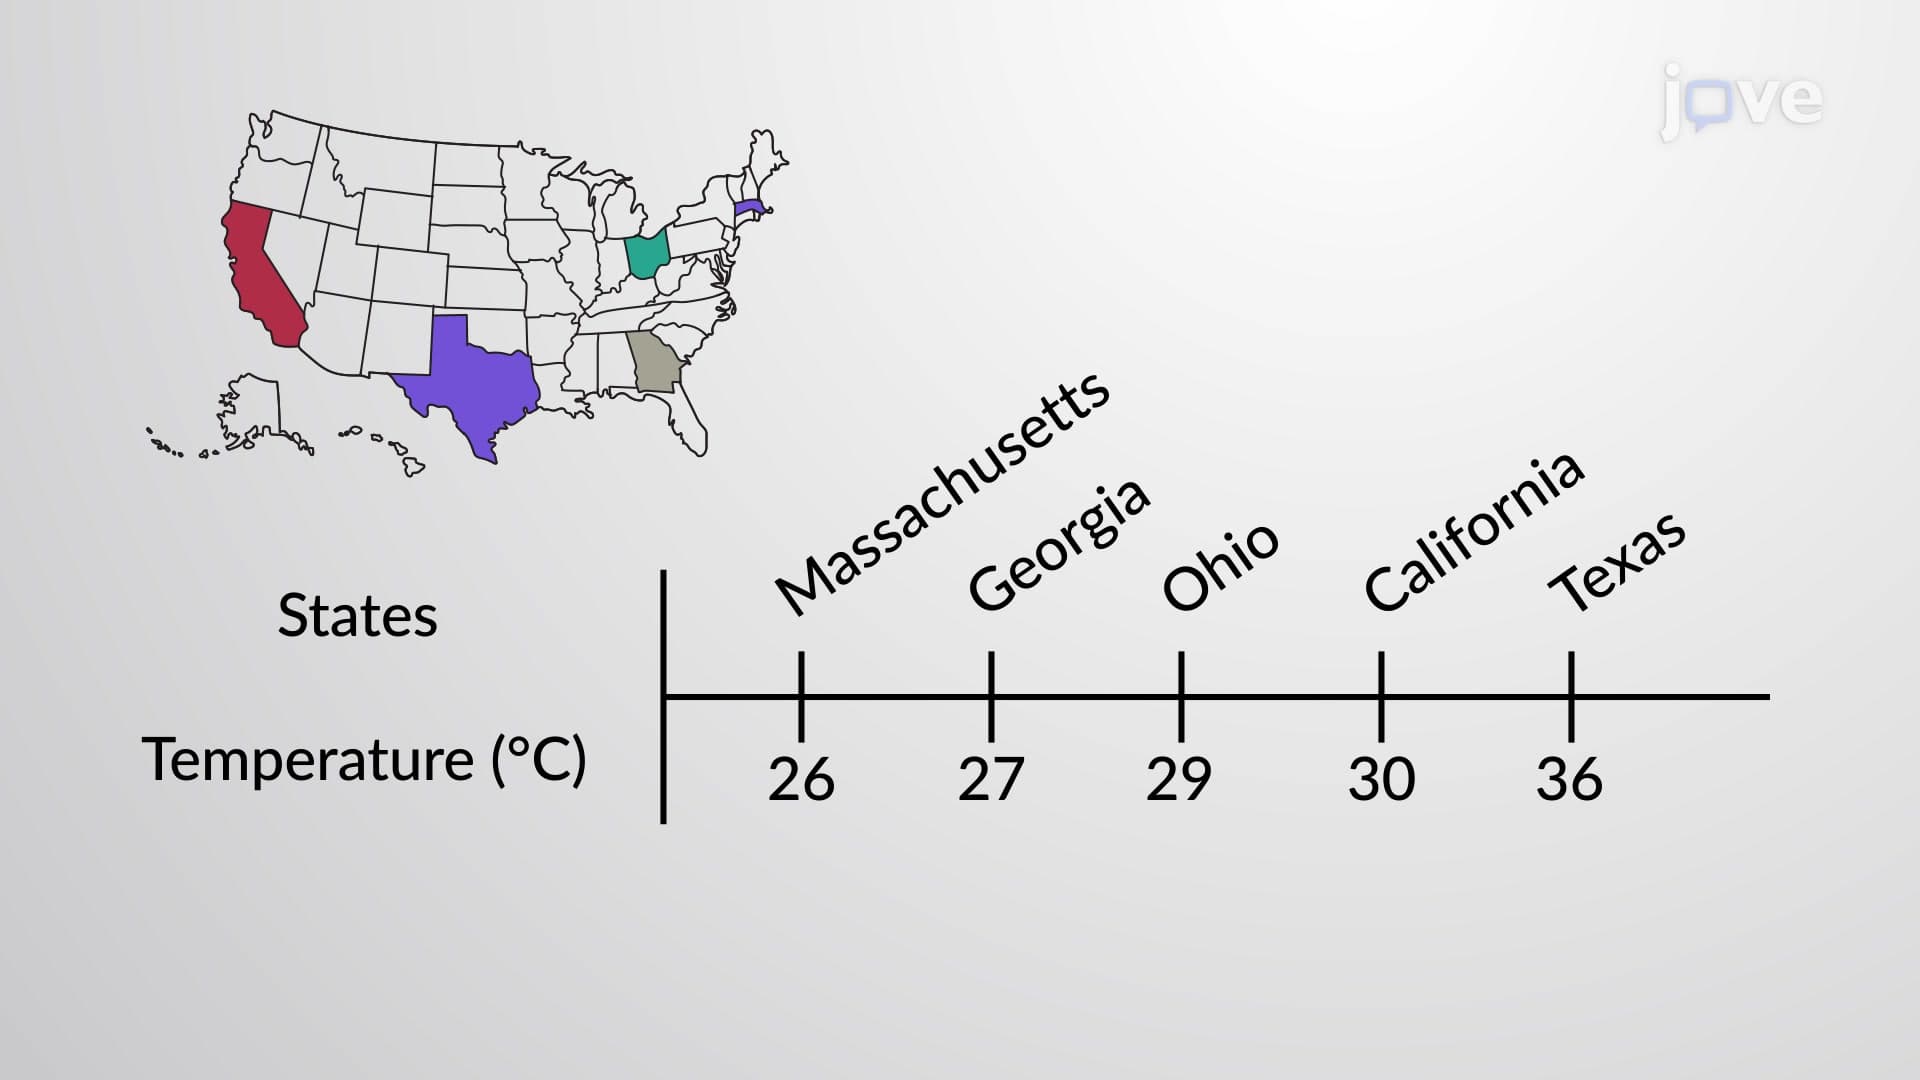
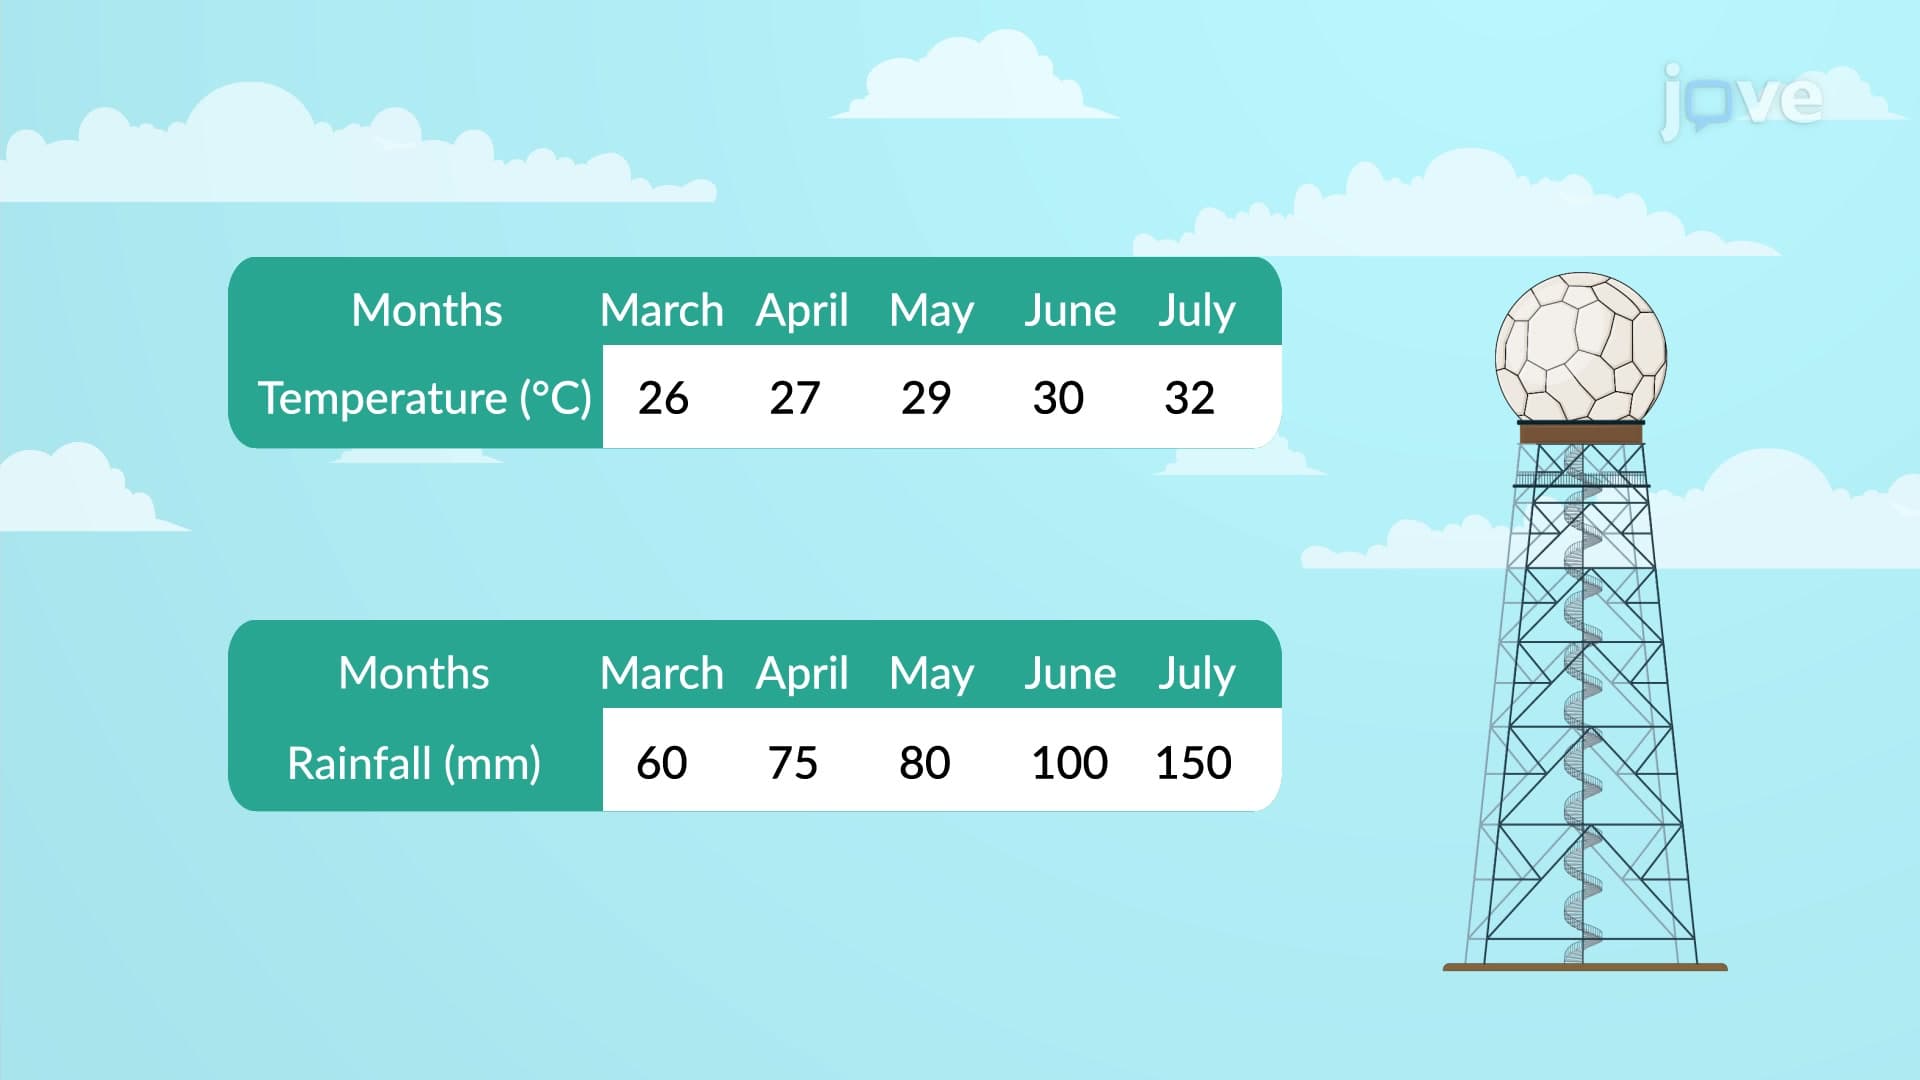
When exploring what is range in detail, consider how this measure appears everywhere in daily life. Stock market analysts use range to describe daily price fluctuations, meteorologists report temperature ranges across different US cities, and educators analyze score ranges on standardized tests like the SAT or AP exams. The range concept provides immediate insight into data spread without complex calculations.
The range basics involve a simple two-step process: identify your dataset's maximum and minimum values, then subtract. For example, if SAT Math scores in a high school class range from 480 to 750, the range equals 270 points (750 - 480 = 270). This range overview tells us that student performance varies significantly within this particular group.
However, understanding range requires recognizing its limitations. Unlike standard deviation or interquartile range, this measure depends entirely on extreme values. A single outlier, perhaps one student who scored exceptionally high or low, can dramatically inflate the range, potentially misrepresenting the actual data distribution.
Range finds extensive use in quality control across American manufacturing industries. Production managers monitor ranges in product dimensions, ensuring consistency within acceptable tolerances. Weather services use temperature ranges to help farmers in states like Iowa and California make crucial agricultural decisions.
This range study guide wouldn't be complete without addressing when NOT to use range. In datasets with significant outliers or skewed distributions, range provides misleading information about typical variability. For instance, if analyzing household incomes in a neighborhood where most families earn $40,000-$80,000 annually, but one billionaire lives there, the range becomes meaningless for understanding typical income variation.
Students encounter range frequently in AP Statistics, college statistics courses, and standardized test preparation. The concept appears regularly on exams like the MCAT's psychology/sociology section and various nursing entrance exams including HESI A2 and TEAS. Understanding range provides foundational knowledge for more advanced statistical concepts taught in undergraduate business, psychology, and STEM programs at universities across the United States.
Related Micro-courses