Loading concepts…


15 Concepts
15 Concepts
13 Concepts
11 Concepts
9 Concepts
14 Concepts
11 Concepts
15 Concepts
13 Concepts
7 Concepts
10 Concepts
10 Concepts
22 Concepts
19 Concepts
16 Concepts
16 Concepts
7 Concepts
 19 Concepts
 15.5K Views
 Popular topics






Biostatistics applies statistical principles to health sciences, analyzing data from clinical trials, epidemiological studies, and public health research. This comprehensive course covers essential statistical methods used in biomedical research, from basic concepts like prevalence and incidence to advanced techniques including survival analysis and outbreak investigation. Students will master key biostatistical tools used by researchers at institutions like the CDC, NIH, and major U.S. medical centers, preparing them for careers in healthcare, research, or further study with JoVE Coach guidance.
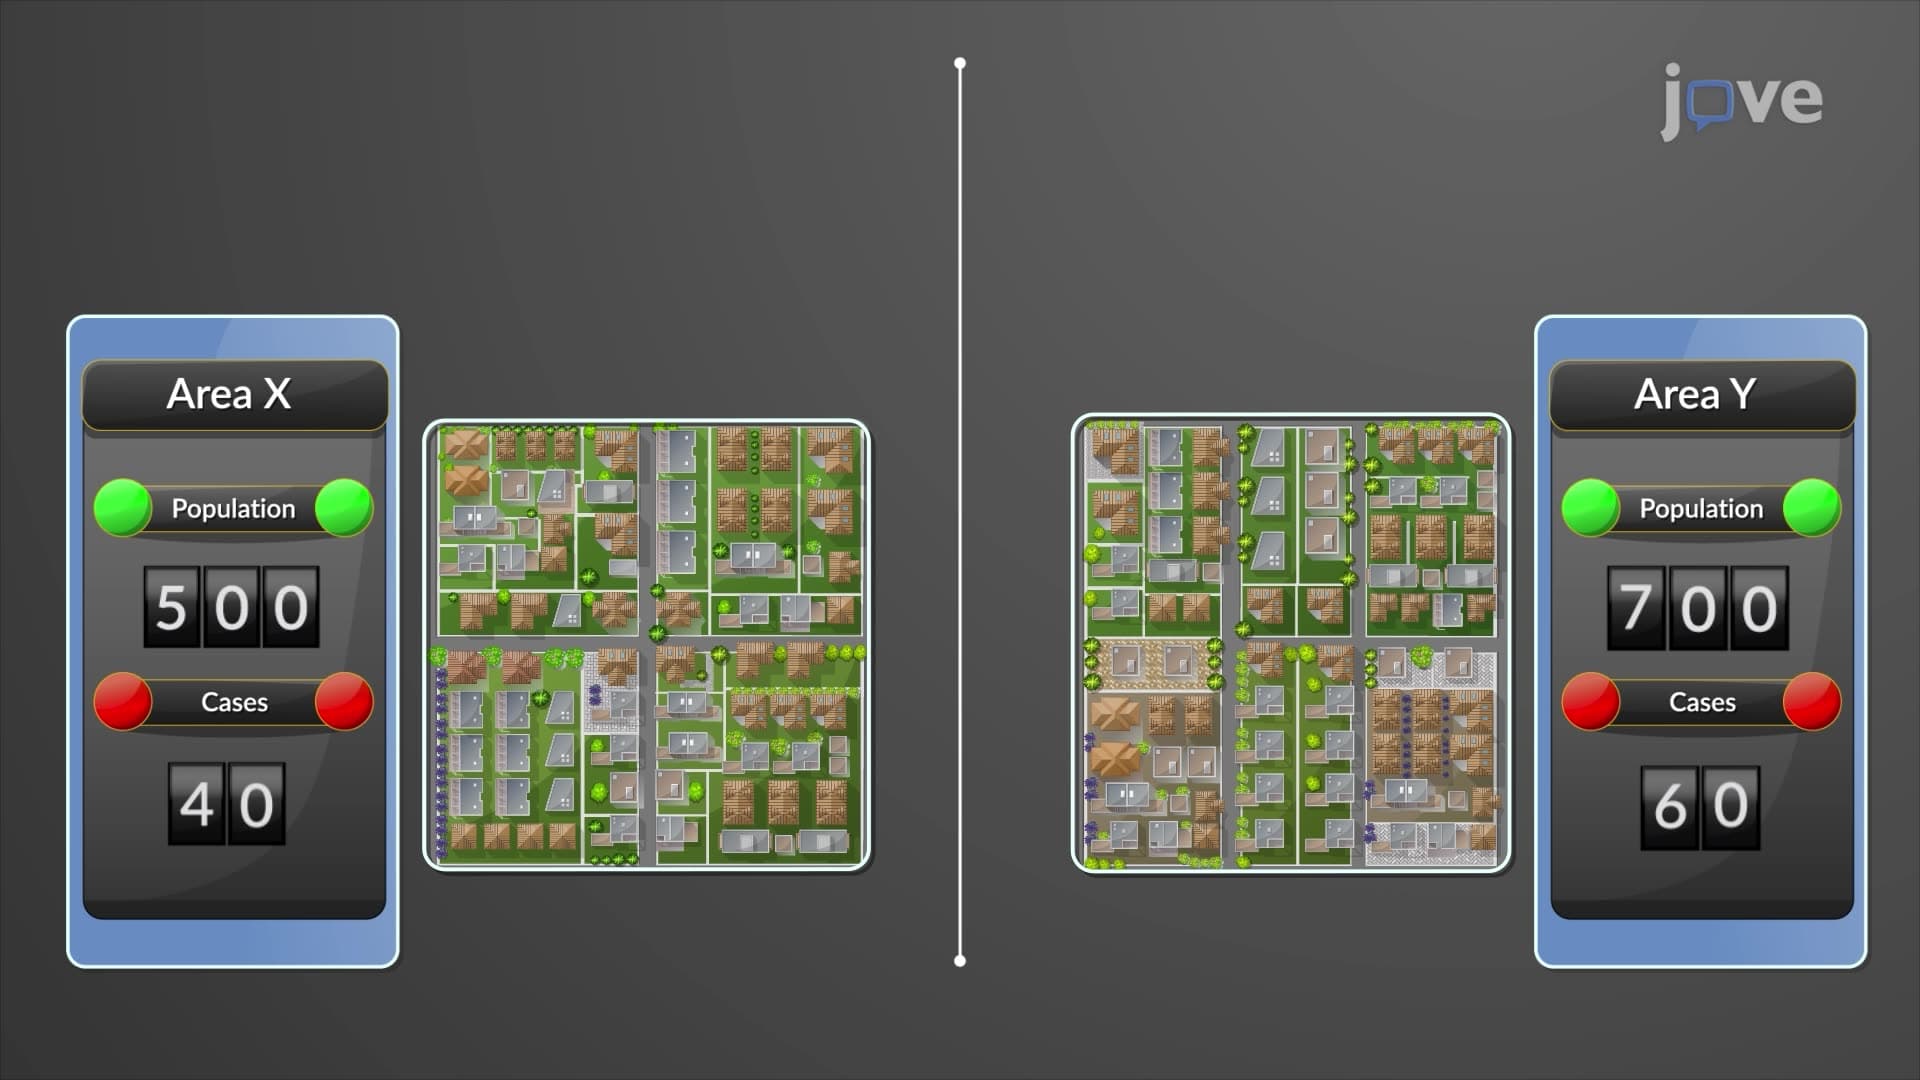
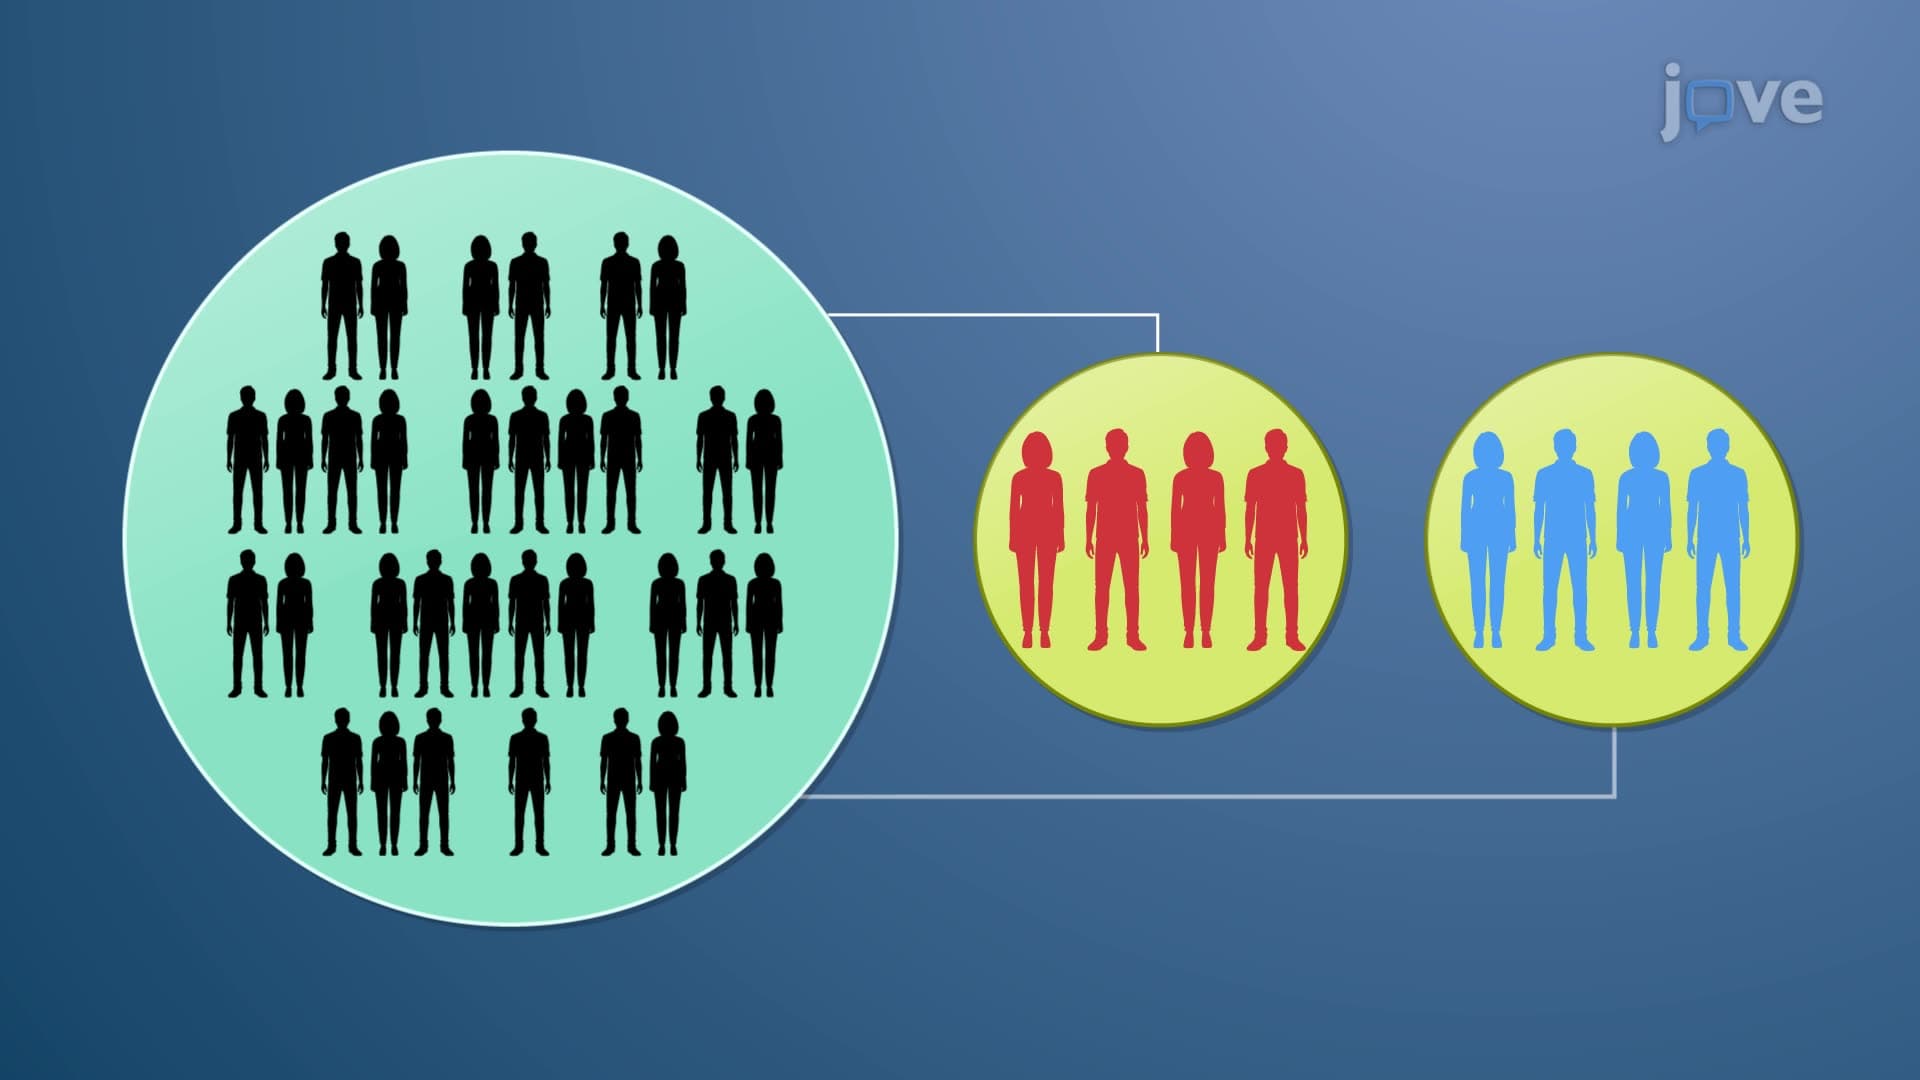
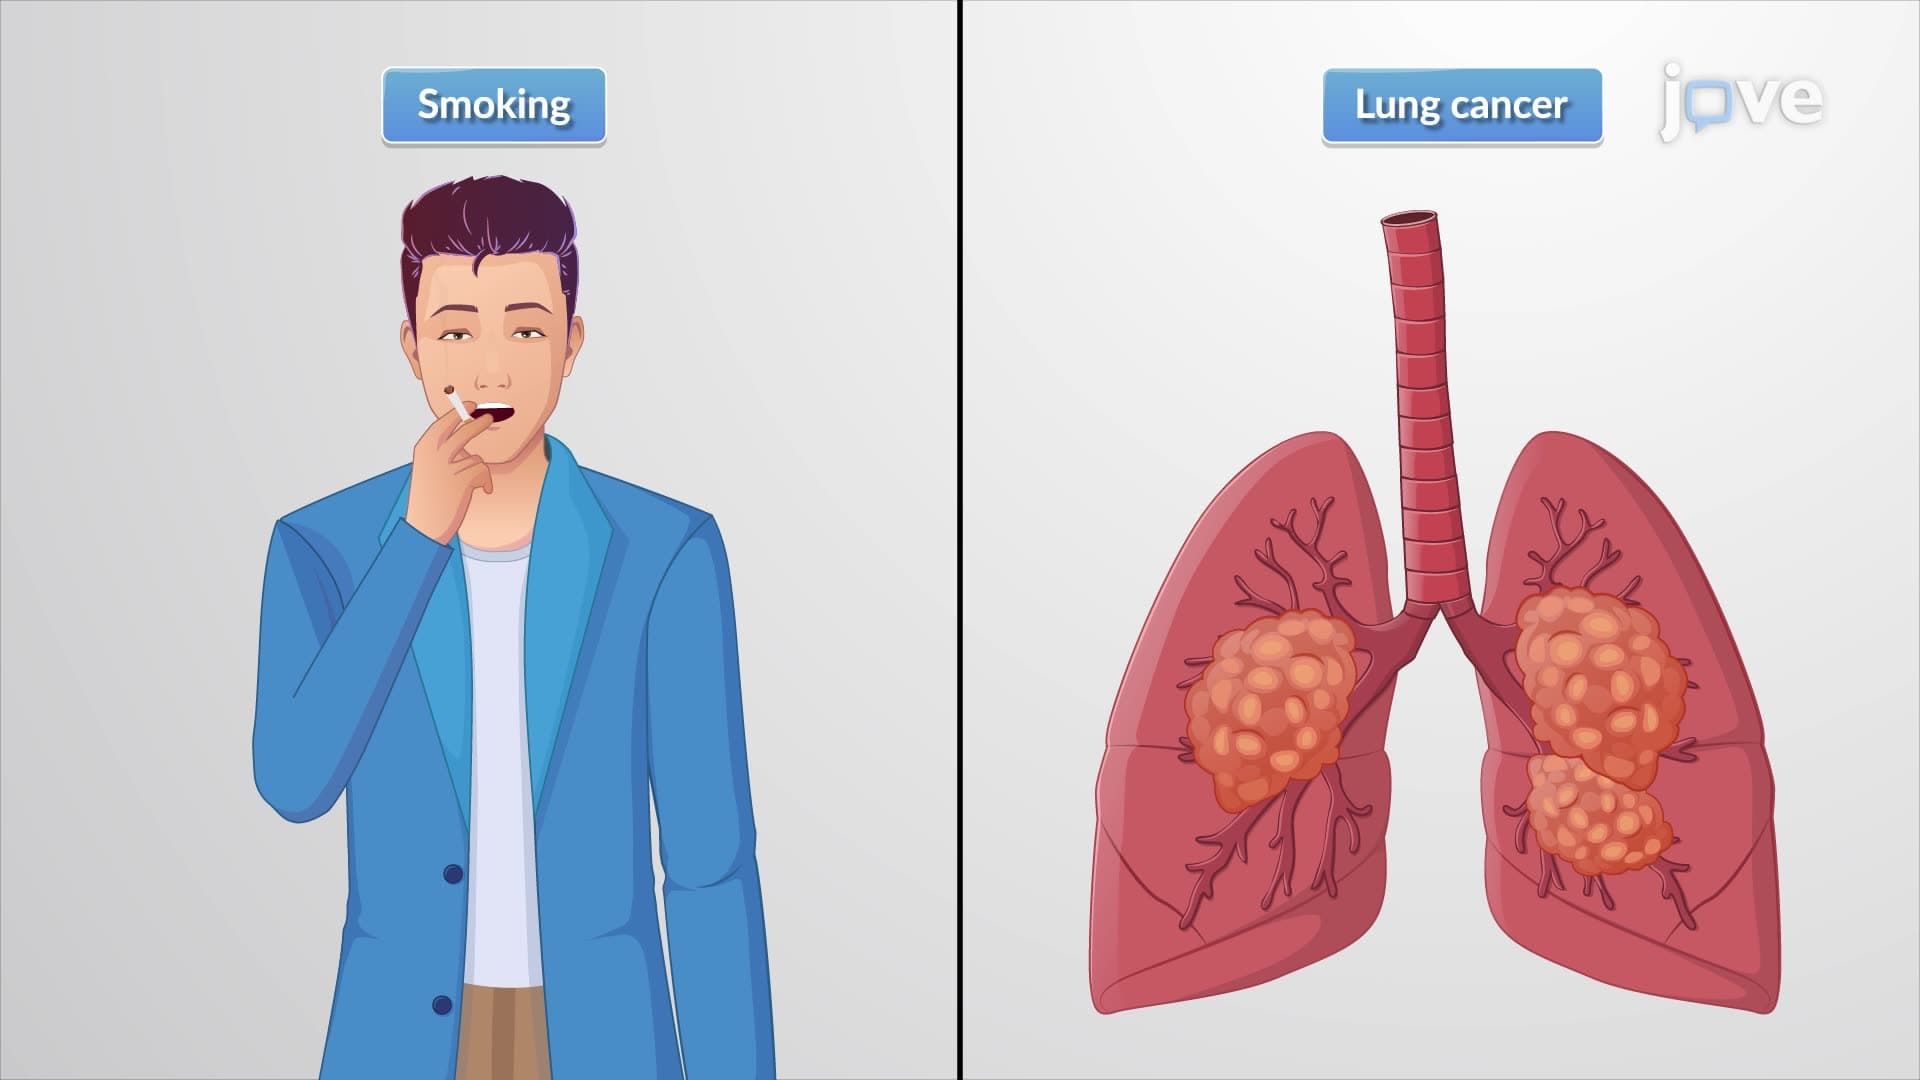
1. Epidemiological Measures and Study Designs Understanding the foundation of biostatistics begins with mastering key epidemiological concepts. Students learn to calculate prevalence (the proportion of a population affected by disease at a specific time) and incidence (new disease cases over a time period). For example, if 50 out of 1,000 college students have influenza during flu season, the prevalence is 5%. The course covers various study designs including case-control studies, cohort studies, and clinical trials. Case-control studies, like comparing lung cancer patients to healthy controls to study smoking effects, are particularly useful for rare diseases. Cohort studies, such as the famous Framingham Heart Study, follow groups over time to identify risk factors.
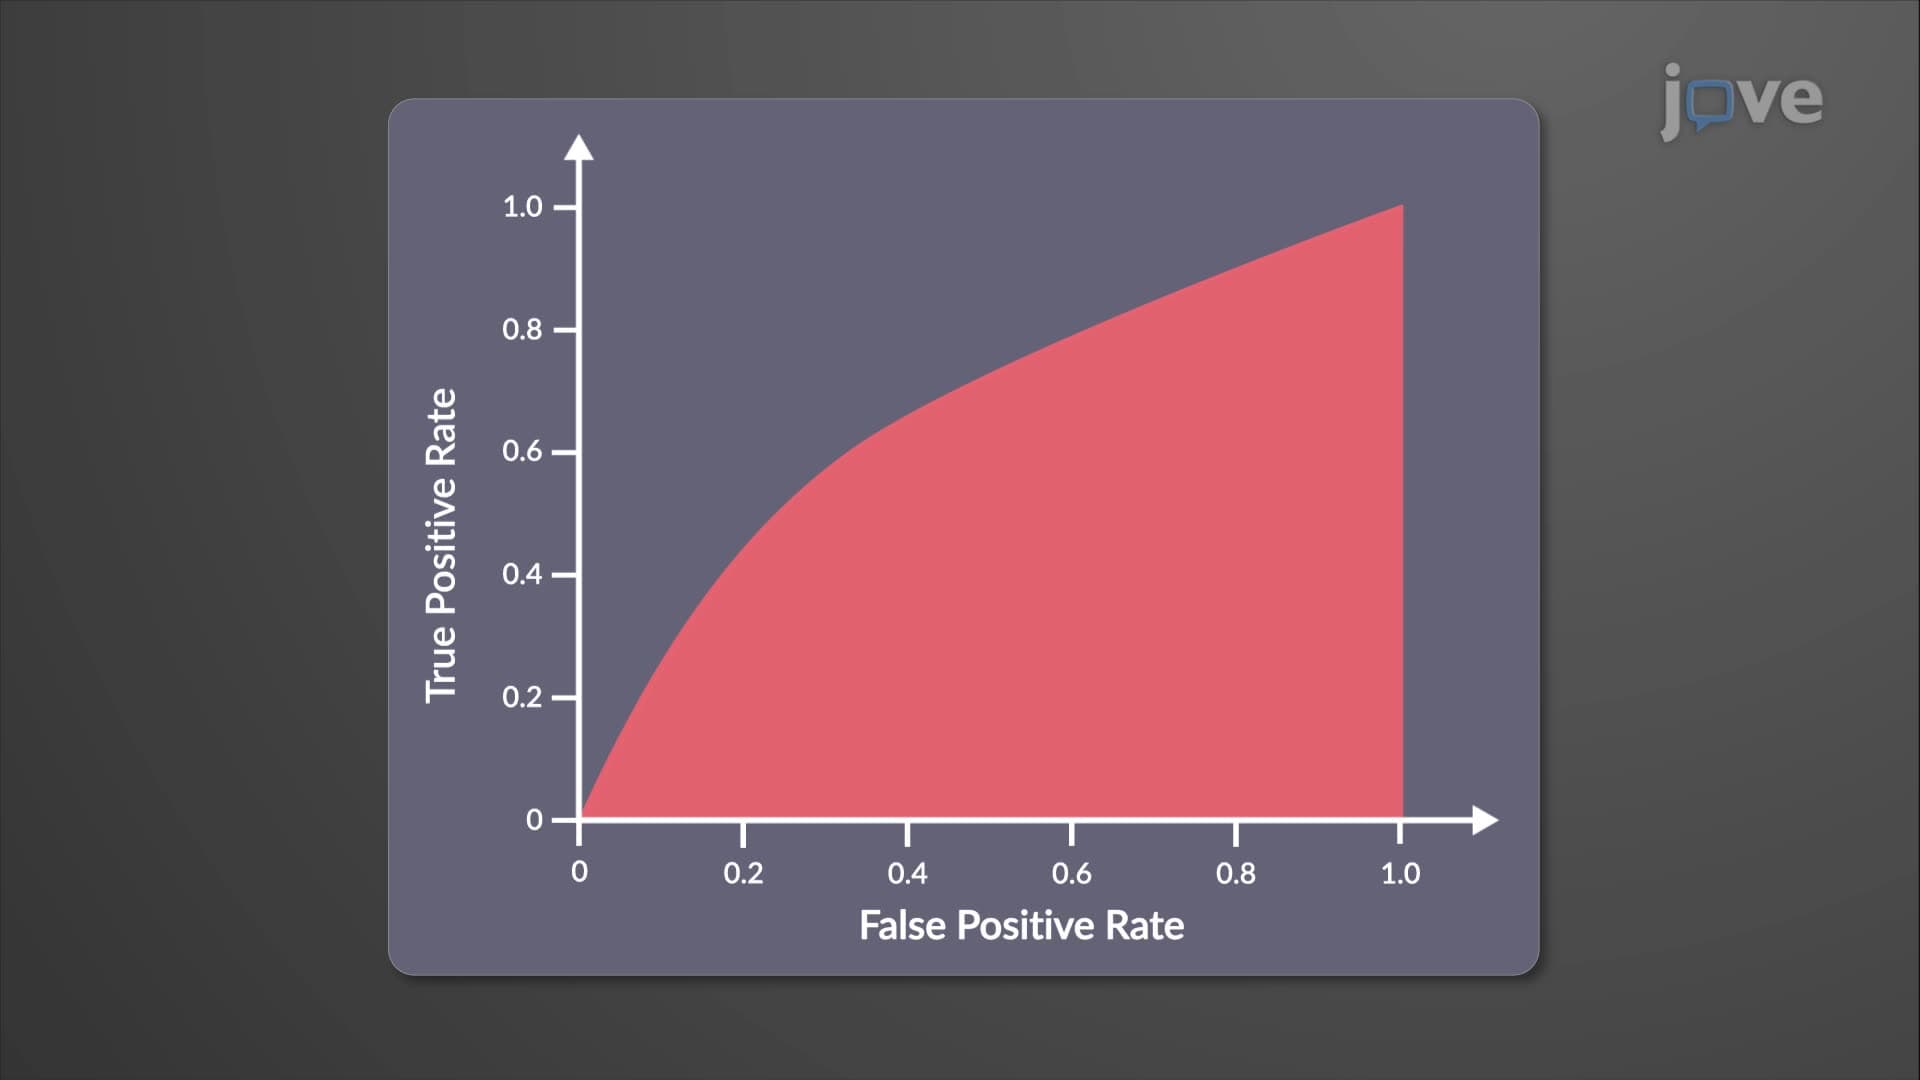
2. Diagnostic Test Evaluation and ROC Analysis Medical professionals rely on diagnostic tests, making it crucial to understand their accuracy. Sensitivity measures how well a test identifies disease when present (true positive rate), while specificity measures how well it identifies absence of disease (true negative rate). For instance, a COVID-19 test with 95% sensitivity correctly identifies 95% of infected individuals. Positive predictive value indicates the probability of having disease given a positive test result. ROC curves plot sensitivity against (1-specificity) to evaluate overall test performance. The area under the ROC curve ranges from 0.5 (no better than chance) to 1.0 (perfect test). Clinical laboratories use these metrics to validate new diagnostic procedures.
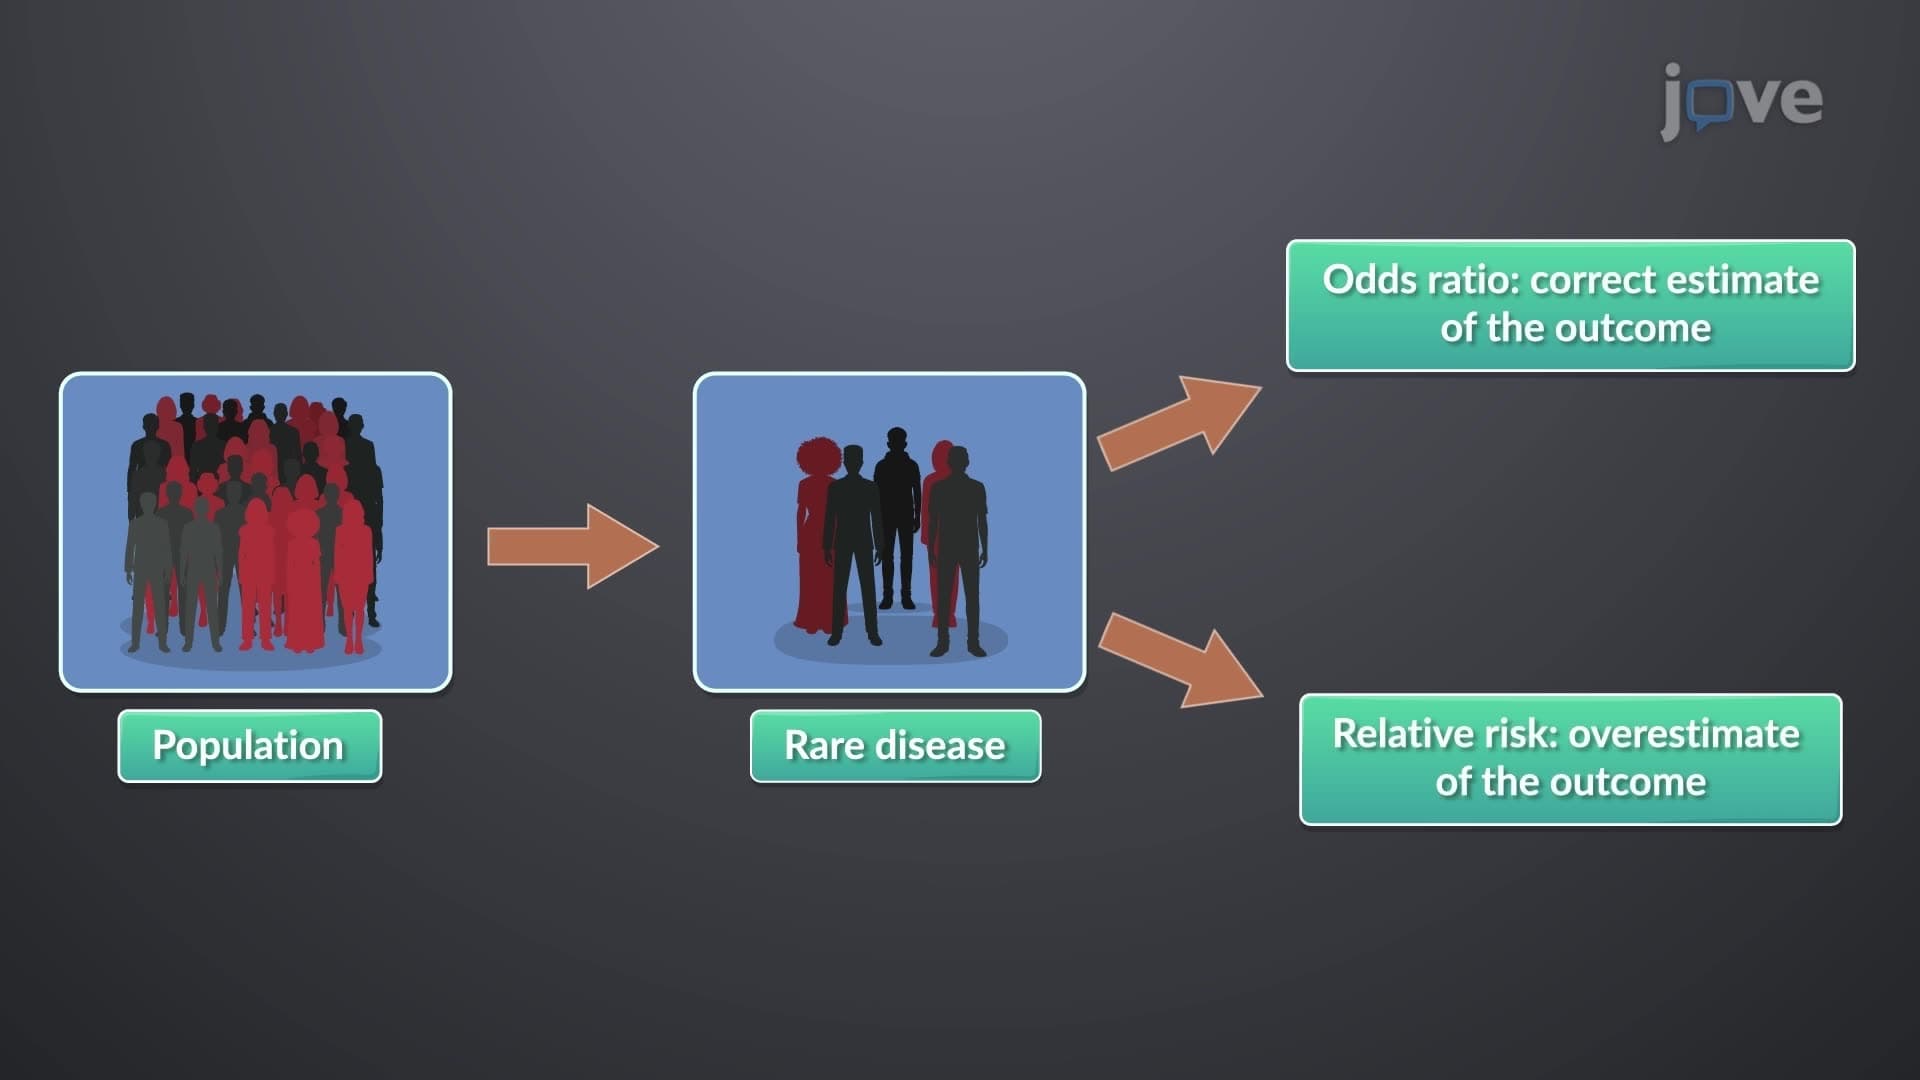
3. Risk Assessment: Relative Risk and Odds Ratios Quantifying associations between exposures and outcomes forms the core of epidemiological research. Relative risk compares disease probability between exposed and unexposed groups. If smokers have a lung cancer rate of 8 per 1,000 and non-smokers have 2 per 1,000, the relative risk is 4.0, meaning smokers are four times more likely to develop lung cancer. Odds ratios, commonly used in case-control studies, compare odds of exposure between cases and controls. These measures help researchers and clinicians understand the strength of associations. For example, studies showing strong associations between HPV infection and cervical cancer led to preventive vaccination programs across U.S. colleges and high schools.
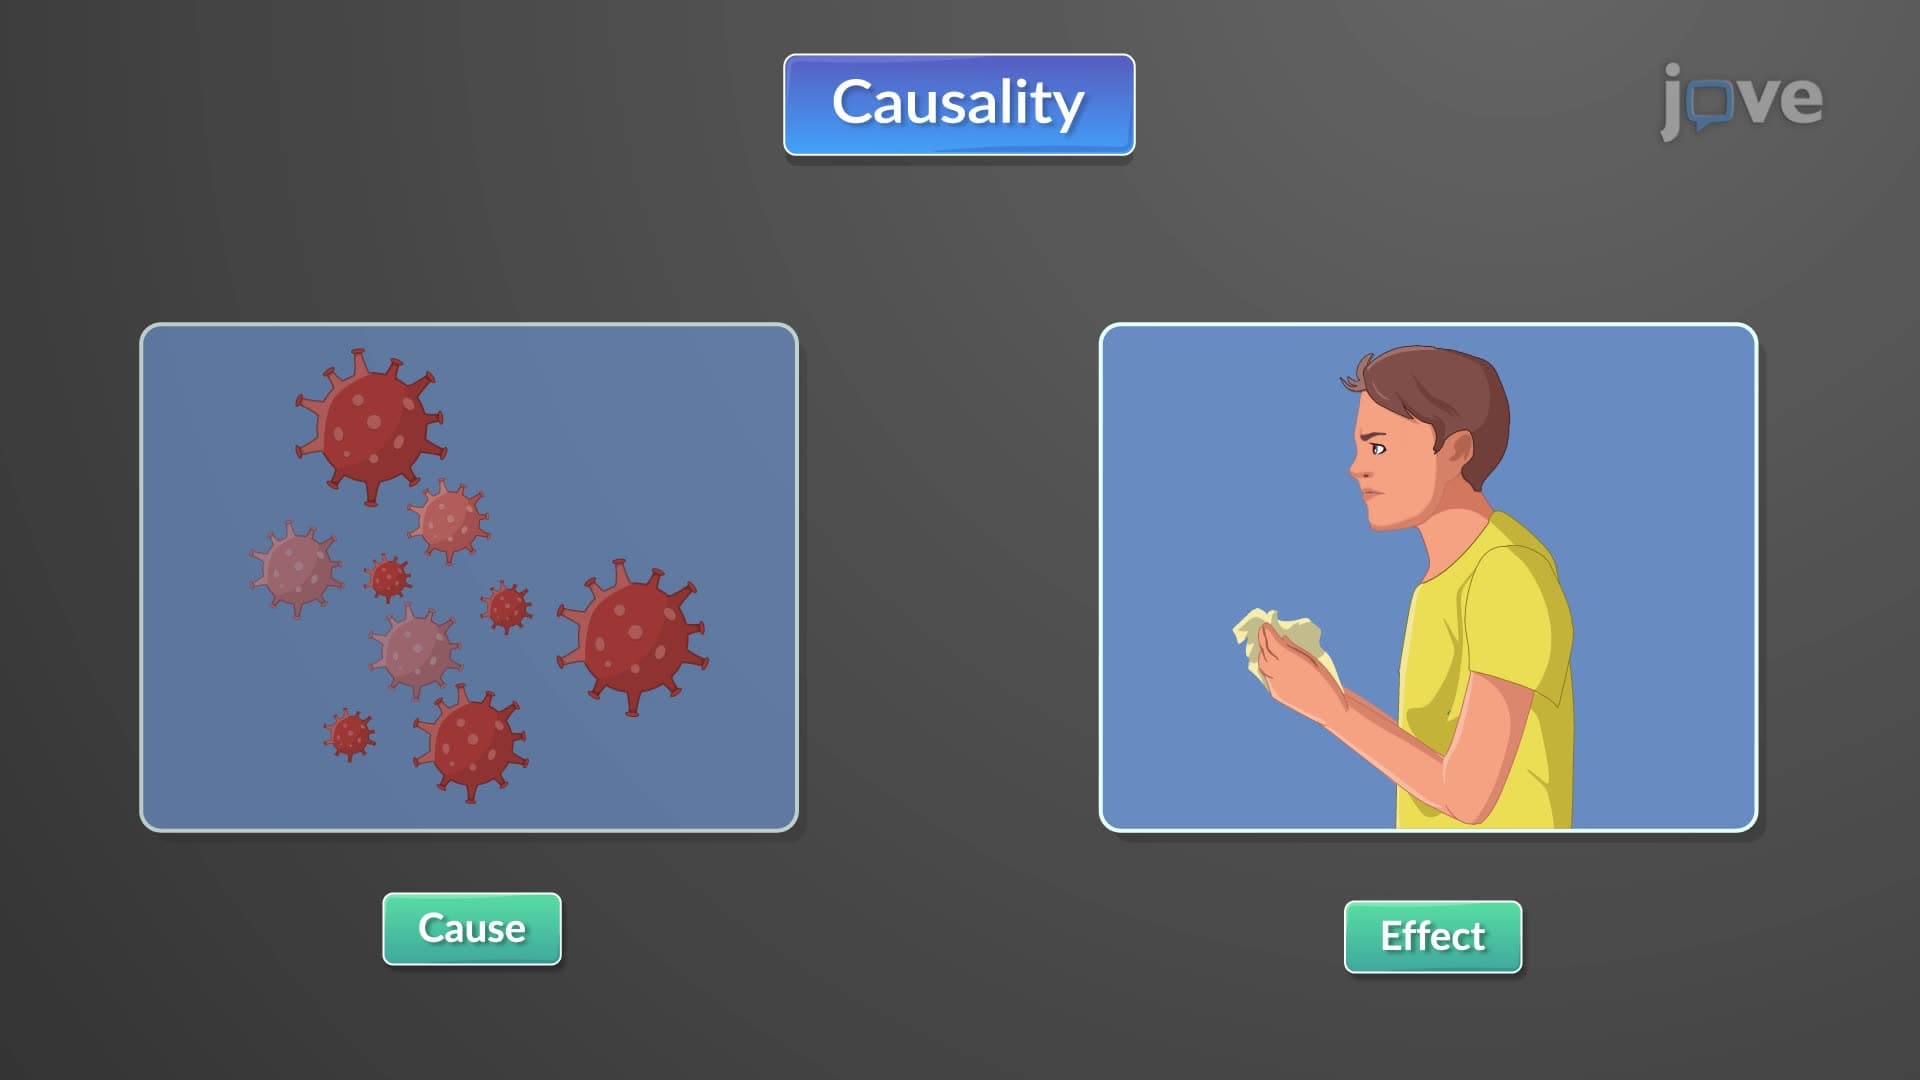
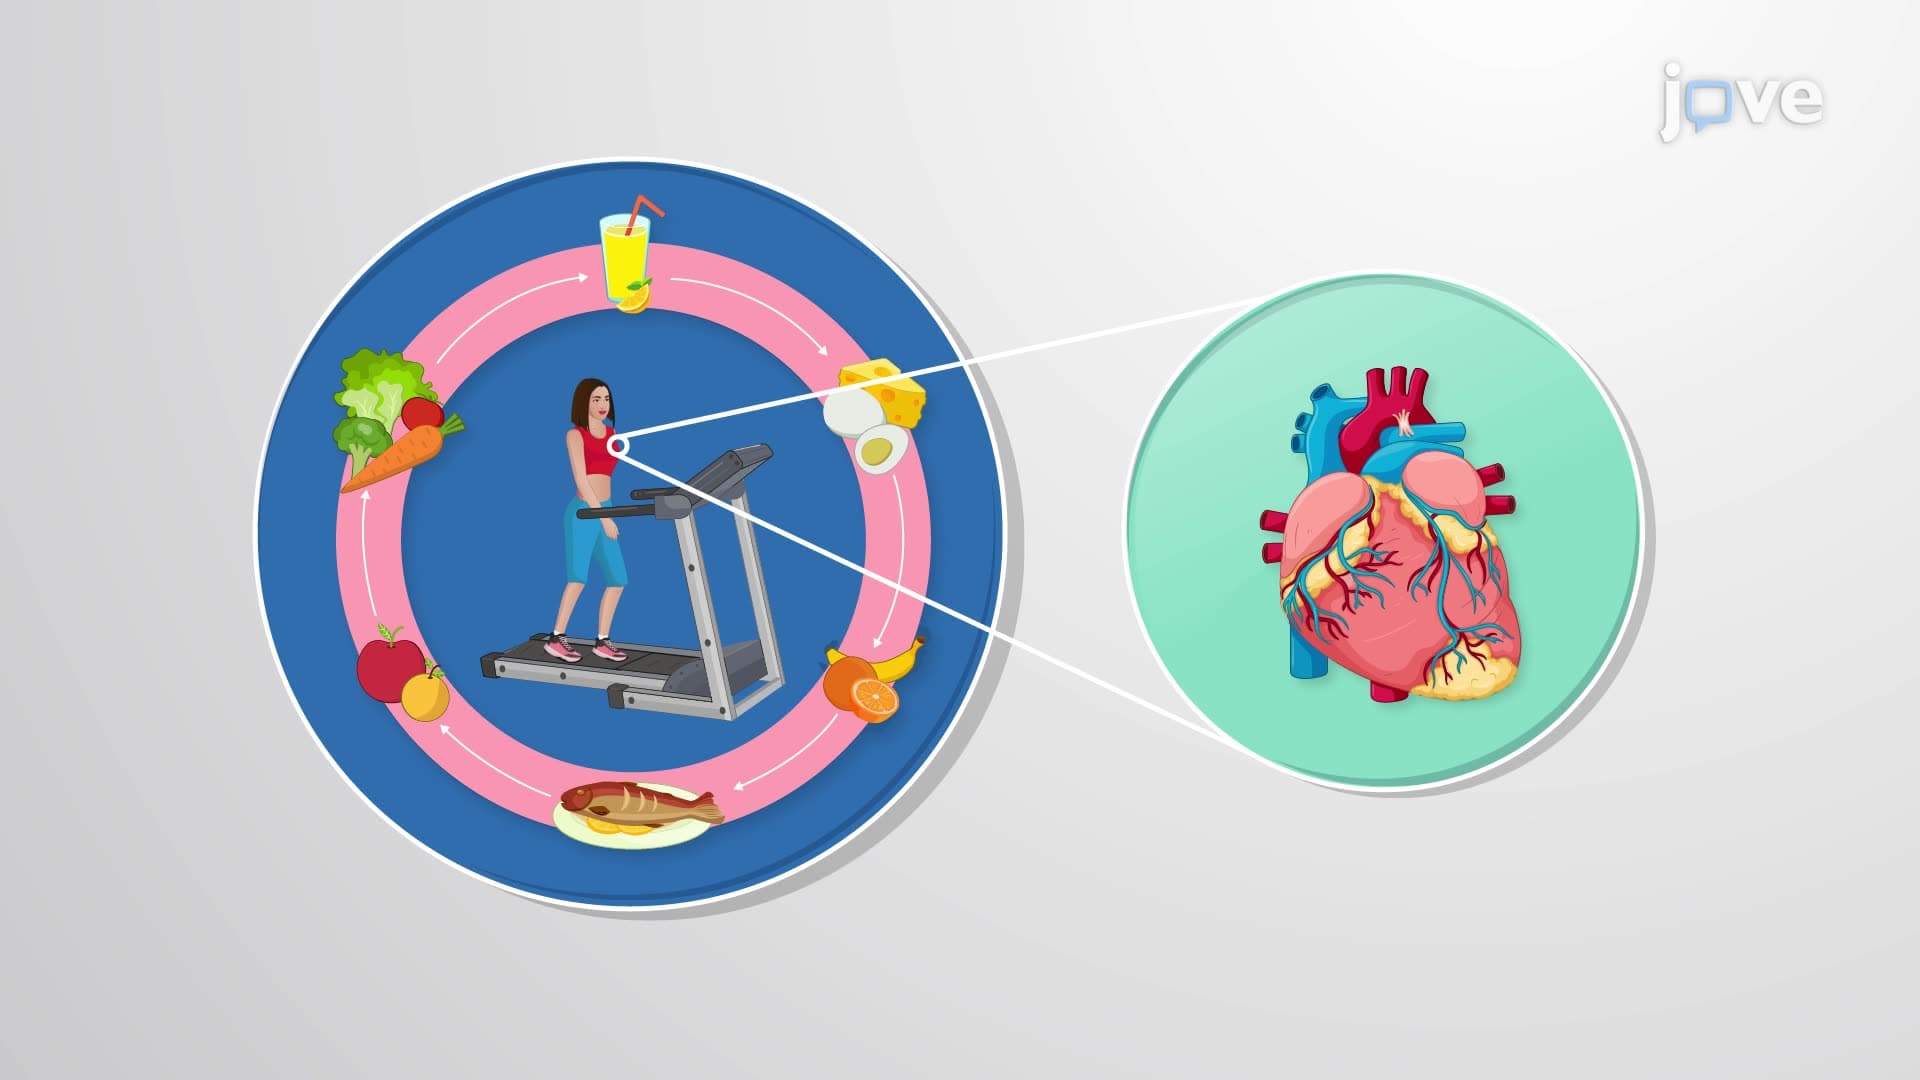
4. Confounding and Causality Assessment Establishing true causal relationships requires careful consideration of confounding variables that can distort associations. Age often confounds studies of disease and exposure relationships. For instance, when studying heart disease and diet, researchers must account for age since both dietary habits and heart disease risk change with age. The Bradford Hill criteria provide a framework for assessing causality, including temporal sequence (cause must precede effect), dose-response relationship (higher exposure leads to increased risk), and biological plausibility. These principles guided recognition of tobacco's role in lung cancer and helped establish regulatory policies. Students learn strategies like randomization, stratification, and multivariate analysis to address confounding in research design and data analysis.
5. Advanced Statistical Applications and Outbreak Investigation Public health emergencies require rapid statistical analysis and response. Outbreak investigation follows systematic steps: confirming the outbreak exists, defining cases, conducting epidemiological studies, implementing control measures, and monitoring effectiveness. During the 2014-2016 Ebola outbreak, statisticians used contact tracing data and transmission models to guide containment efforts. Response Surface Methodology helps optimize treatment protocols by analyzing multiple factors simultaneously. Survival analysis techniques, commonly used in cancer research, account for time-to-event data and censoring. Disease surveillance systems, like those operated by state health departments, use statistical methods to detect unusual disease patterns and trigger investigations. These advanced methods prepare students for careers in epidemiology, clinical research, and public health practice.