Loading video…

 19 Concepts
 15.5K views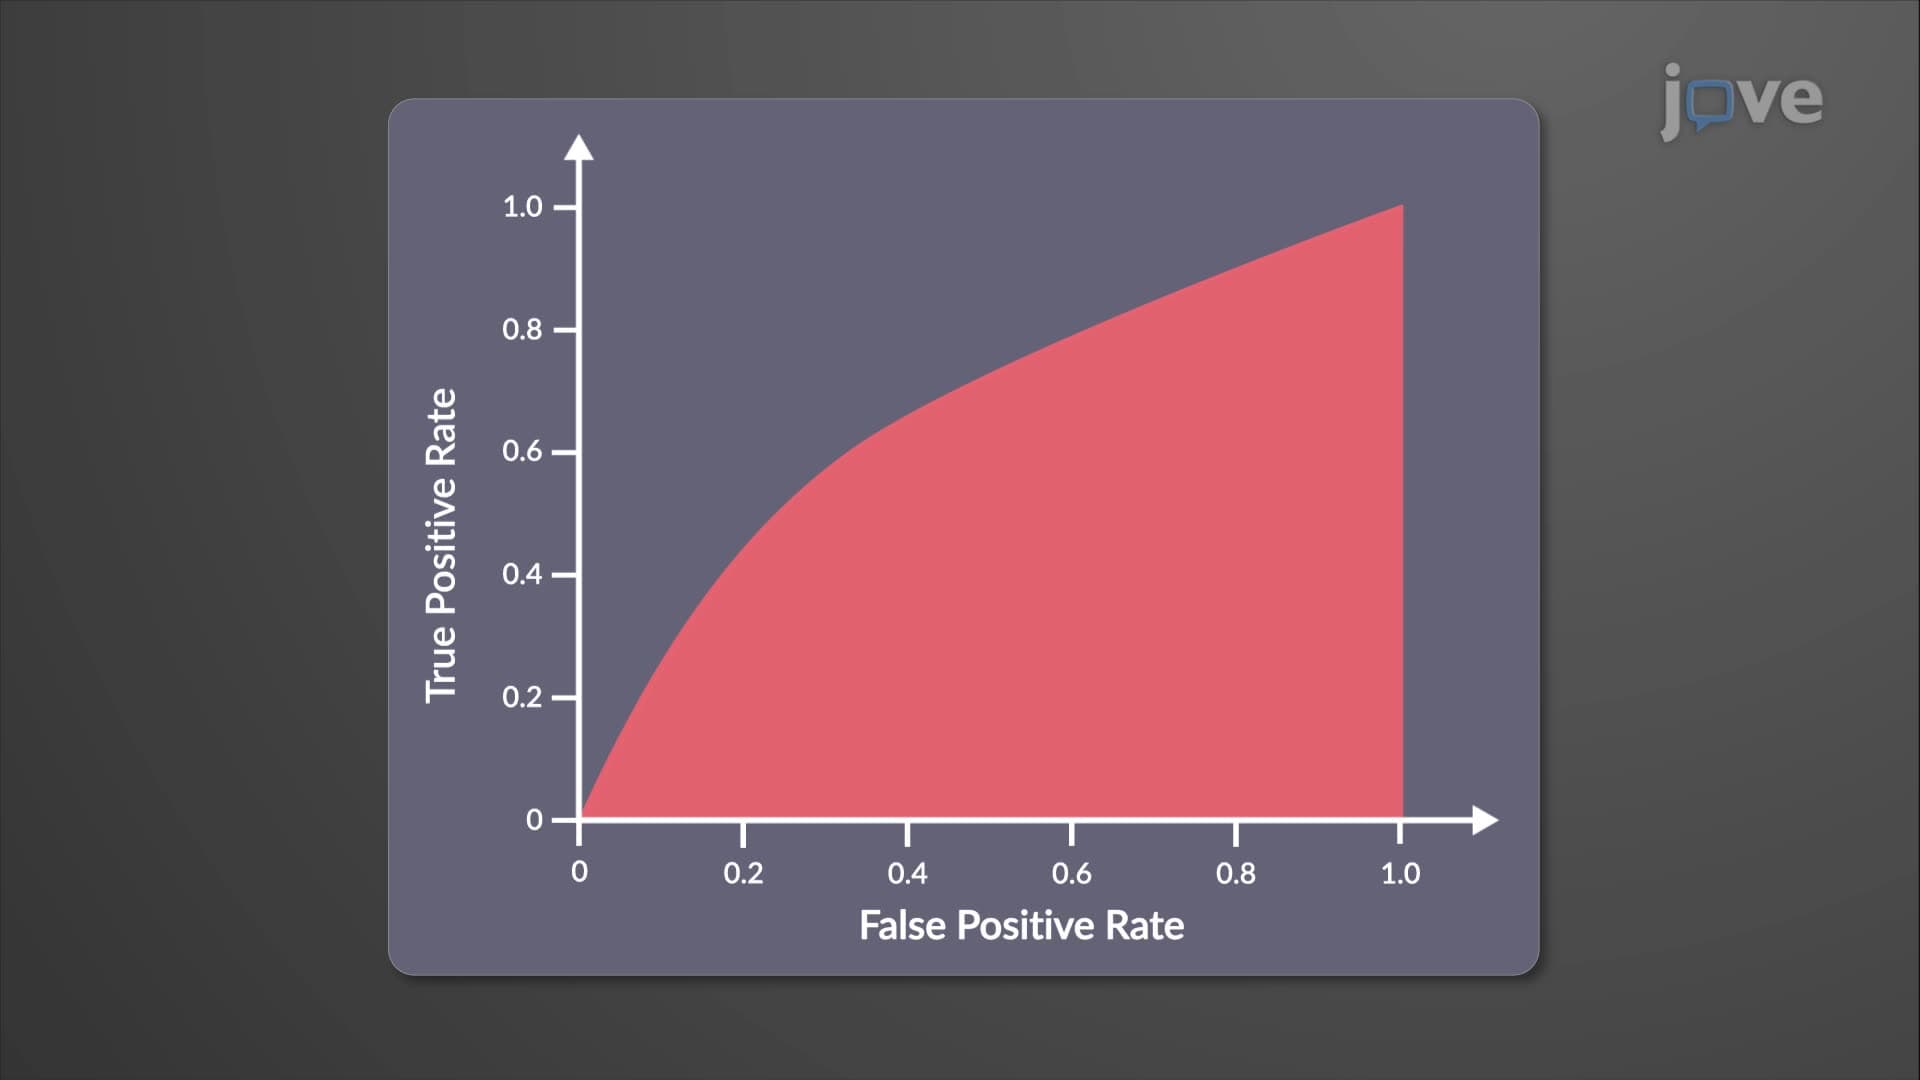

Video Summary: What Is Receiver Operating Characteristic Plot
Ever wonder how doctors determine if a COVID-19 rapid test is actually reliable? A receiver operating characteristic plot is a powerful statistical graph that measures how well diagnostic tests distinguish between healthy and sick patients. The U.S. FDA uses ROC curves to evaluate everything from mammography screening tools to pregnancy tests before approving them for clinical use. This essential biostatistics concept helps medical professionals balance test sensitivity with specificity to minimize both false positives and false negatives. Watch the full video on JoVE Coach to master this concept with expert-led visuals and step-by-step explanations.
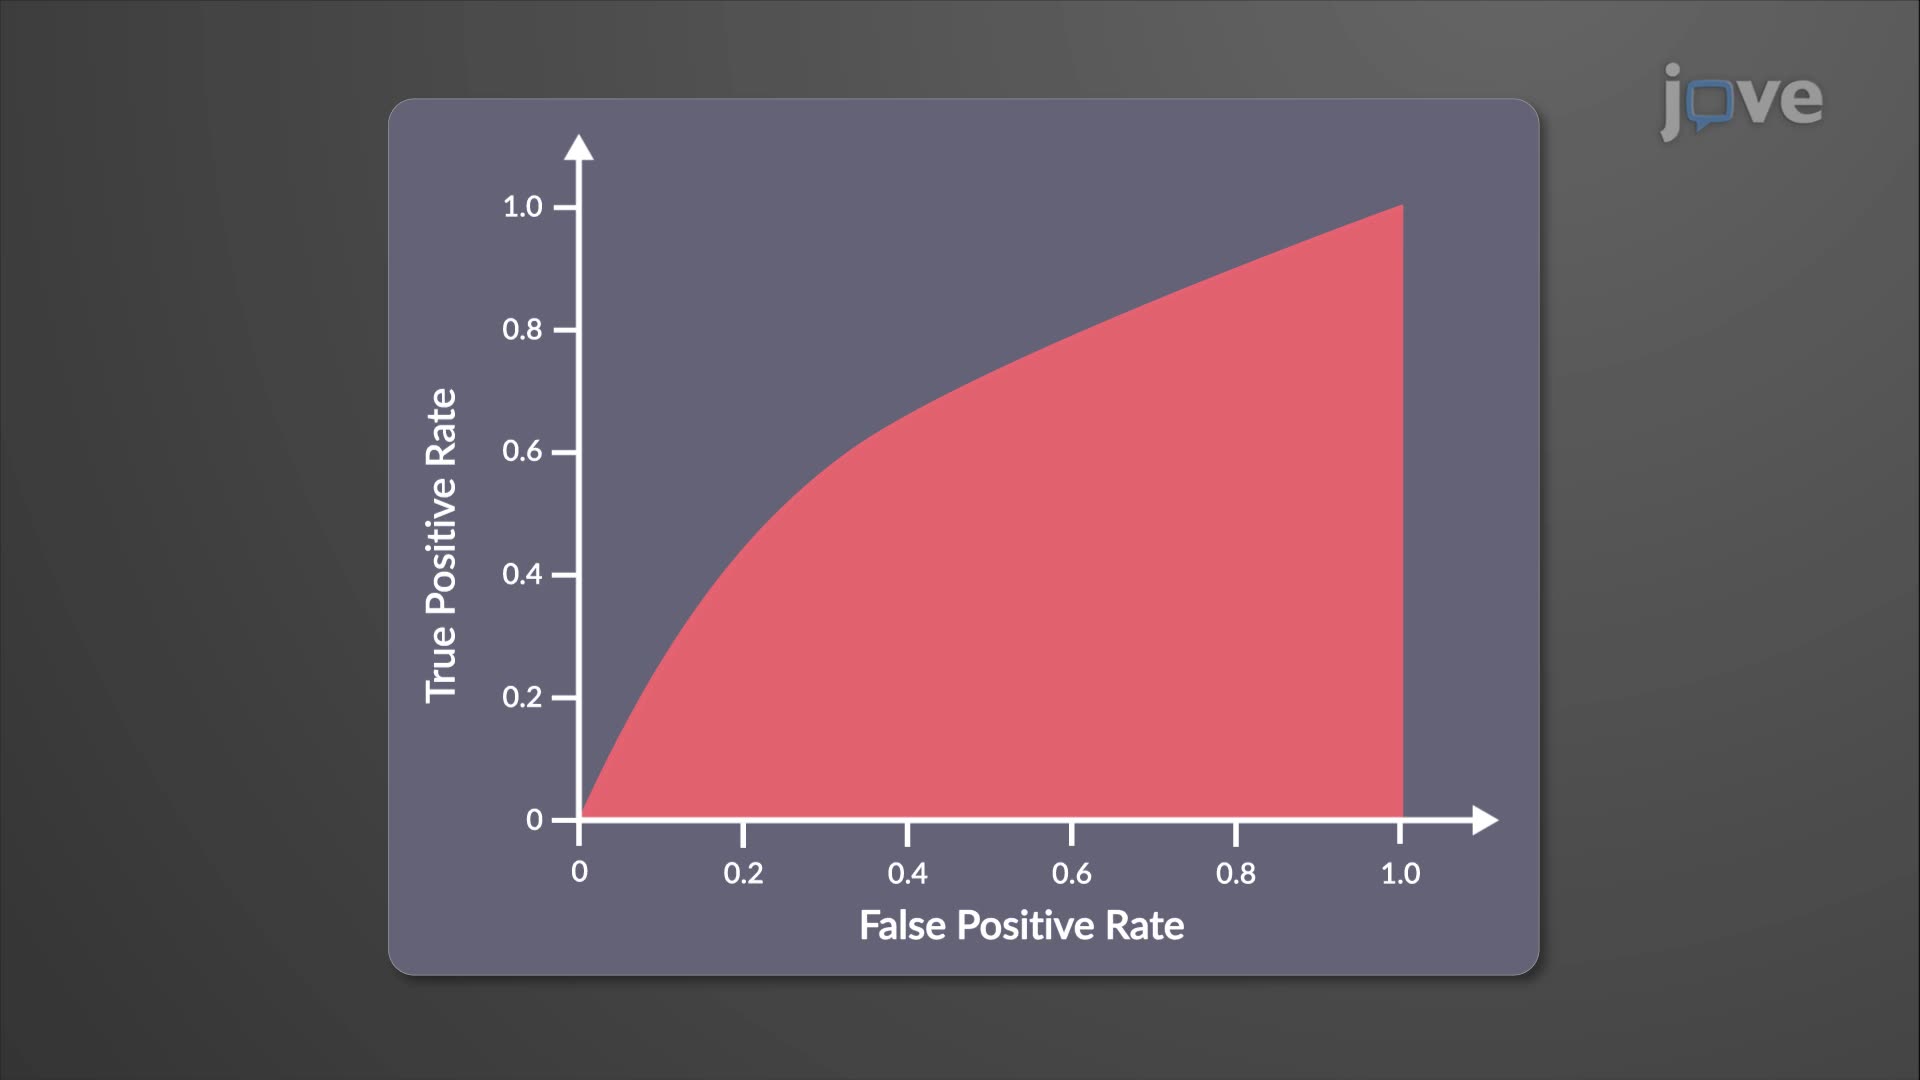
A receiver operating characteristic plot serves as a critical tool in medical statistics and diagnostic testing, originally developed during World War II for radar signal detection. This graphical representation plots the true positive rate (sensitivity) against the false positive rate (1-specificity) across various threshold settings, creating a curve that reveals a test's discriminatory power.
The receiver operating characteristic plot definition encompasses its role as a performance measurement tool that helps clinicians and researchers evaluate how well a diagnostic test separates diseased from non-diseased individuals. Unlike simple accuracy measurements, ROC curves provide comprehensive insights into test behavior across all possible decision thresholds.
When examining what is receiver operating characteristic plot in detail, three key elements emerge: the diagonal reference line, the ROC curve itself, and the area under the curve (AUC). The diagonal line represents random chance performance (AUC = 0.5), where a test performs no better than flipping a coin. Effective diagnostic tests produce curves that bow toward the upper-left corner, maximizing sensitivity while minimizing false positives.
The AUC quantifies overall test performance, with values approaching 1.0 indicating excellent diagnostic accuracy. For instance, the Pap smear for cervical cancer screening typically achieves an AUC of 0.85-0.90, while cardiac troponin tests for heart attack diagnosis often exceed 0.95. These metrics help the FDA and medical professionals determine which tests merit clinical implementation.
Understanding receiver operating characteristic plot concepts proves essential for optimizing diagnostic strategies in U.S. healthcare systems. Emergency departments at institutions like Johns Hopkins and Mayo Clinic rely on ROC analysis to establish decision thresholds for conditions ranging from pulmonary embolism to sepsis. The optimal threshold depends on clinical consequences: cancer screening tests typically favor high sensitivity to minimize missed cases, while confirmatory tests prioritize high specificity to reduce unnecessary treatments.
ROC curves feature prominently in standardized examinations including the MCAT, USMLE Step 1, and AP Statistics. College biostatistics courses at universities like UCLA and University of Michigan emphasize ROC interpretation as fundamental to evidence-based medicine. Students encounter these concepts in epidemiology, clinical research methods, and healthcare quality assessment coursework, making mastery essential for pre-med and public health career tracks.
Related Micro-courses