Loading video…


 19 Concepts
 15.5K views

Video Summary: Statistical Methods for Analyzing Epidemiological Data Guide
Did you know that the groundbreaking link between smoking and lung cancer was established using statistical methods for analyzing epidemiological data? These powerful techniques help researchers identify disease patterns and risk factors in populations. For instance, the landmark Framingham Heart Study has used these methods for over 70 years to understand cardiovascular disease risk factors in American communities. Statistical Methods For Analyzing Epidemiological Data Guide reveals how descriptive statistics, regression models, and ratio calculations transform raw health data into actionable public health insights. Watch the full video on JoVE Coach to master this concept with expert-led visuals and step-by-step explanations.
Epidemiological statistics form the backbone of modern public health research, transforming observations about disease patterns into evidence-based interventions. These methods help researchers answer critical questions: Why do certain populations experience higher disease rates? What factors increase or decrease health risks? How effective are prevention strategies?
The foundation begins with descriptive statistics, which paint the initial picture of health data. When the Centers for Disease Control and Prevention (CDC) investigates disease outbreaks, epidemiologists first calculate means, medians, and frequency distributions to understand who is affected, when symptoms appeared, and where cases cluster geographically.
Logistic regression serves as a cornerstone technique for analyzing binary health outcomes-essentially "yes" or "no" questions like "Does this person have diabetes?" or "Will this patient survive?" This method proves invaluable because most epidemiological research focuses on the presence or absence of disease. The famous Nurses' Health Study, which has followed American nurses since 1976, extensively uses logistic regression to examine relationships between lifestyle factors and chronic diseases.
Linear regression complements this approach when researchers study continuous health measures. For example, researchers might use linear regression to predict how daily exercise minutes relate to blood pressure readings or how air pollution levels correlate with lung function measurements across different US cities.
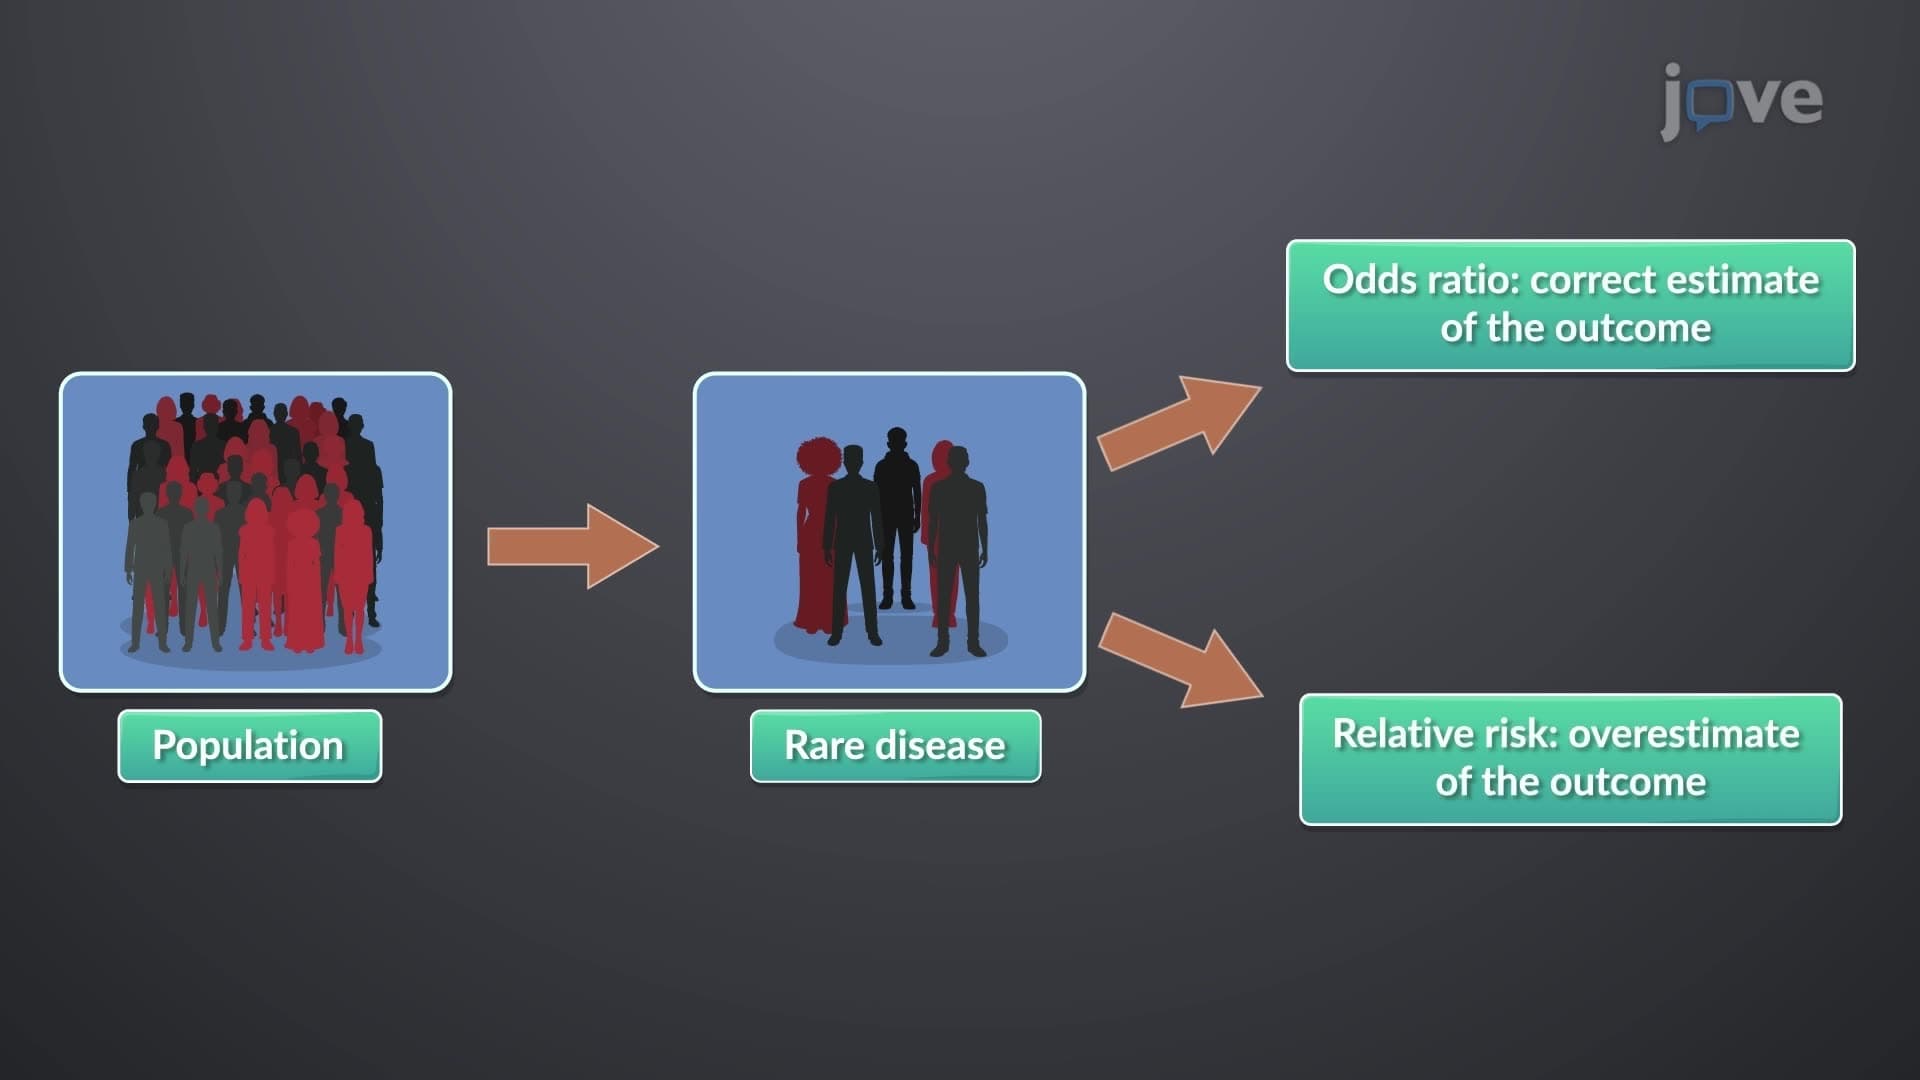
Risk ratios and odds ratios provide the mathematical foundation for understanding disease associations. When Harvard researchers demonstrated that regular aspirin use reduces heart attack risk, they calculated risk ratios showing the probability of cardiac events in aspirin users versus non-users. Case-control studies, like those investigating environmental causes of birth defects, rely heavily on odds ratios to compare exposure histories between affected and healthy children.
Standardized ratios represent sophisticated tools that adjust for demographic differences between populations. When comparing cancer rates between Florida (with many elderly residents) and Utah (with a younger population), crude rates would be misleading. Standardized incidence ratios account for age differences, revealing true patterns of disease risk.
These concepts frequently appear in Advanced Placement (AP) Statistics courses and form essential background knowledge for pre-med students preparing for the MCAT. College-level biostatistics courses build extensively on these foundations, preparing students for careers in public health, medicine, and health policy research.
Related Micro-courses