Loading video…


 14 Concepts
 173.2K views

Video Summary: What Is Binomial Probability Distribution
Did you know that predicting election outcomes, quality control in manufacturing, and even determining your chances of passing a multiple-choice exam all rely on the same mathematical principle? Binomial probability distribution models scenarios with fixed trials and two possible outcomes per trial, like a pharmaceutical company testing drug effectiveness across 100 patients or calculating the likelihood of getting exactly 7 correct answers on a 10-question true/false quiz. This fundamental binomial probability distribution concept appears throughout statistics courses and standardized tests. Watch the full video on JoVE Coach to master this concept with expert-led visuals and step-by-step explanations.
Binomial probability distribution serves as one of the most practical probability models in statistics, appearing frequently in AP Statistics, college-level courses, and professional certifications. This distribution applies when you have exactly two possible outcomes (success/failure) across multiple independent trials with constant probability.
For a scenario to follow binomial probability distribution, four critical conditions must be met. First, you need a fixed number of trials (n) - whether testing 50 light bulbs or surveying 200 voters. Second, each trial must have exactly two outcomes: success or failure, pass or fail, heads or tails. Third, the probability of success (p) remains constant across all trials - crucial for maintaining statistical validity. Finally, trials must be independent, meaning one outcome doesn't influence another.
Consider the FDA approving new medications: if a drug has a 70% success rate, binomial probability distribution helps predict outcomes across patient groups. Manufacturing quality control provides another example - if 95% of smartphones pass inspection, companies use this distribution to calculate defect probabilities in production batches. College admissions officers analyzing standardized test performance, medical researchers studying treatment effectiveness, and polling organizations predicting election results all rely on binomial distribution principles.
The binomial probability formula P(X = x) = C(n,x) × p^x × q^(n-x) determines exact probabilities for specific outcomes. Here, C(n,x) represents combinations, calculating how many ways you can arrange x successes among n trials. This formula appears extensively in standardized exams like the AP Statistics test and college statistics courses, making mastery essential for academic success.
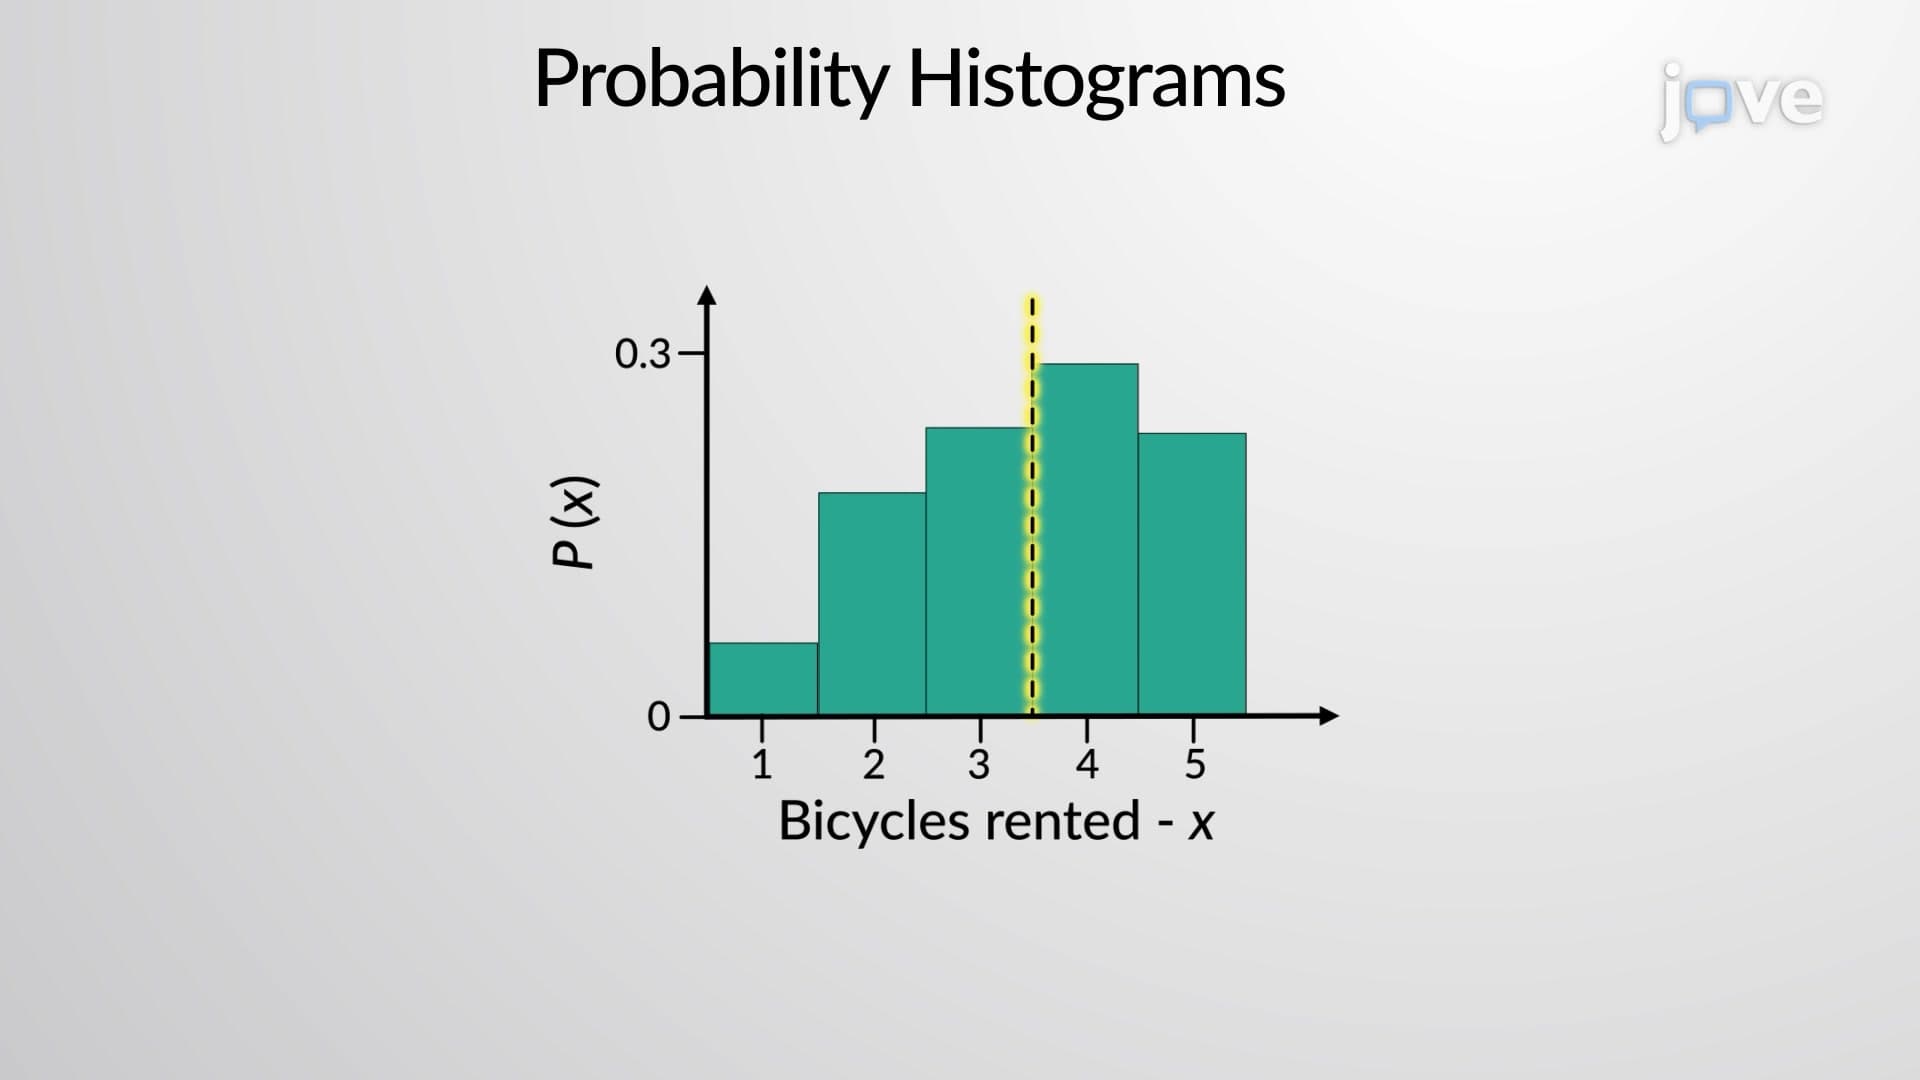
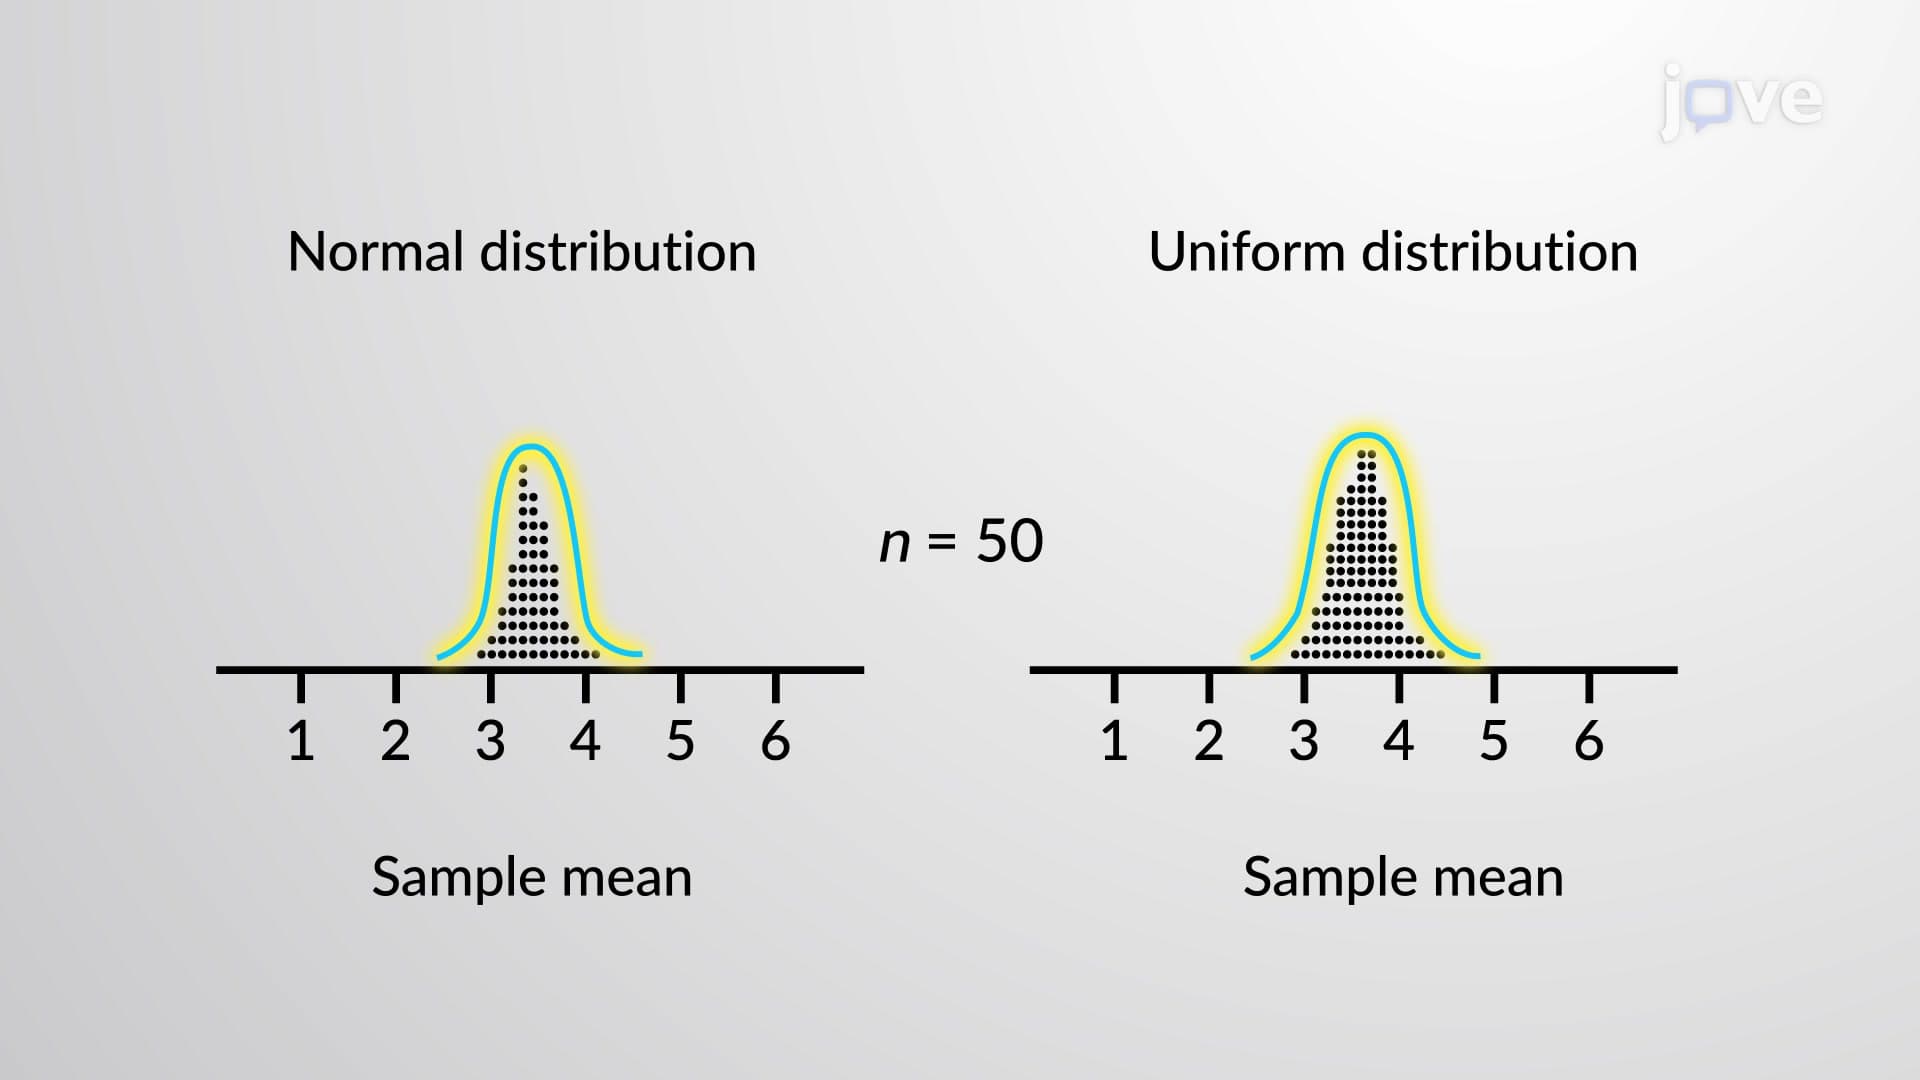
Students preparing for the MCAT encounter binomial distribution in research methodology questions, while nursing students see it in NCLEX questions about treatment protocols. The graphical representation - typically bell-shaped for large samples - helps visualize probability distributions and connects to normal approximation concepts taught in advanced statistics courses.
Related Micro-courses