Loading video…

 10 Concepts
 65.9K views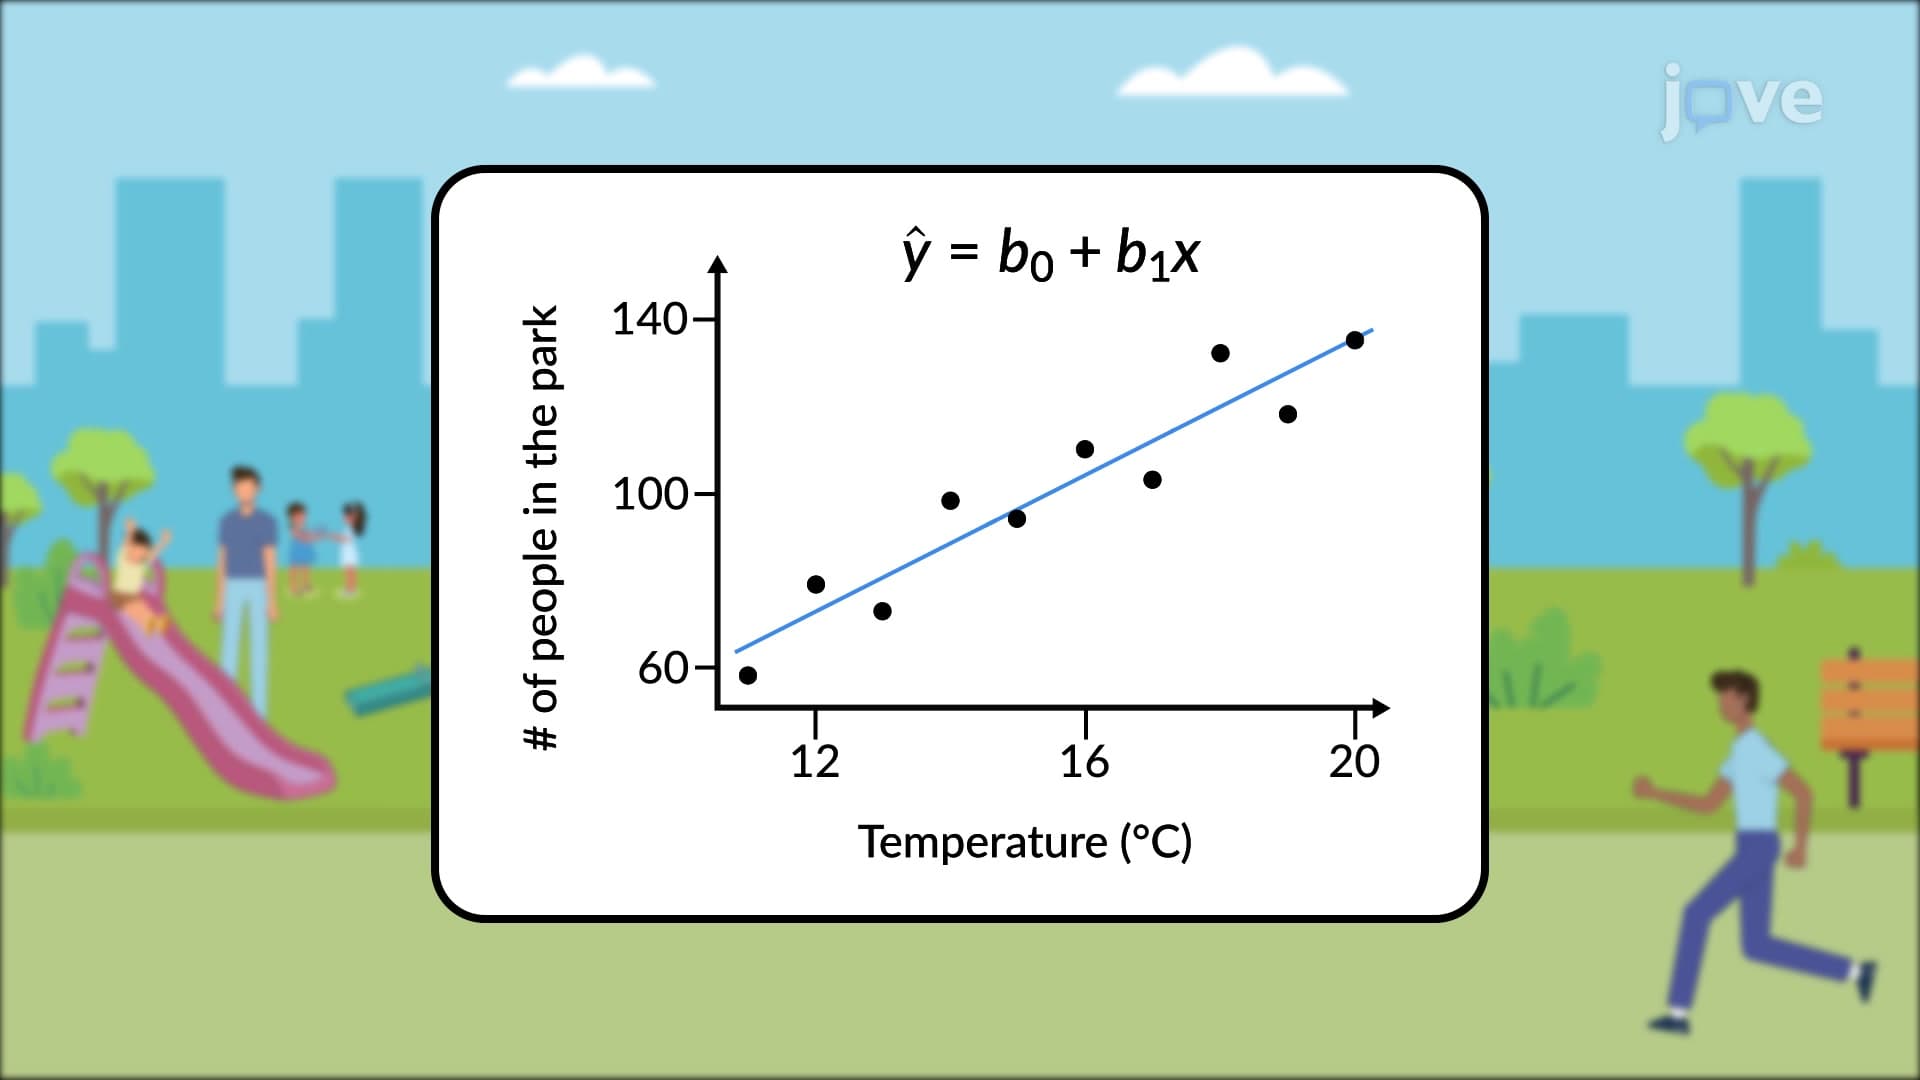

Video Summary: What Is Variation
Variation measures how much data points spread out from predictions in statistical analysis. When examining SAT score relationships, for instance, variation helps explain why some students with identical study hours achieve different results. The concept breaks down into explained variation (predicted by relationships) and unexplained variation (random factors), with their ratio forming the crucial r-squared value that statisticians use daily. Watch the full video on JoVE Coach to master this concept with expert-led visuals and step-by-step explanations.
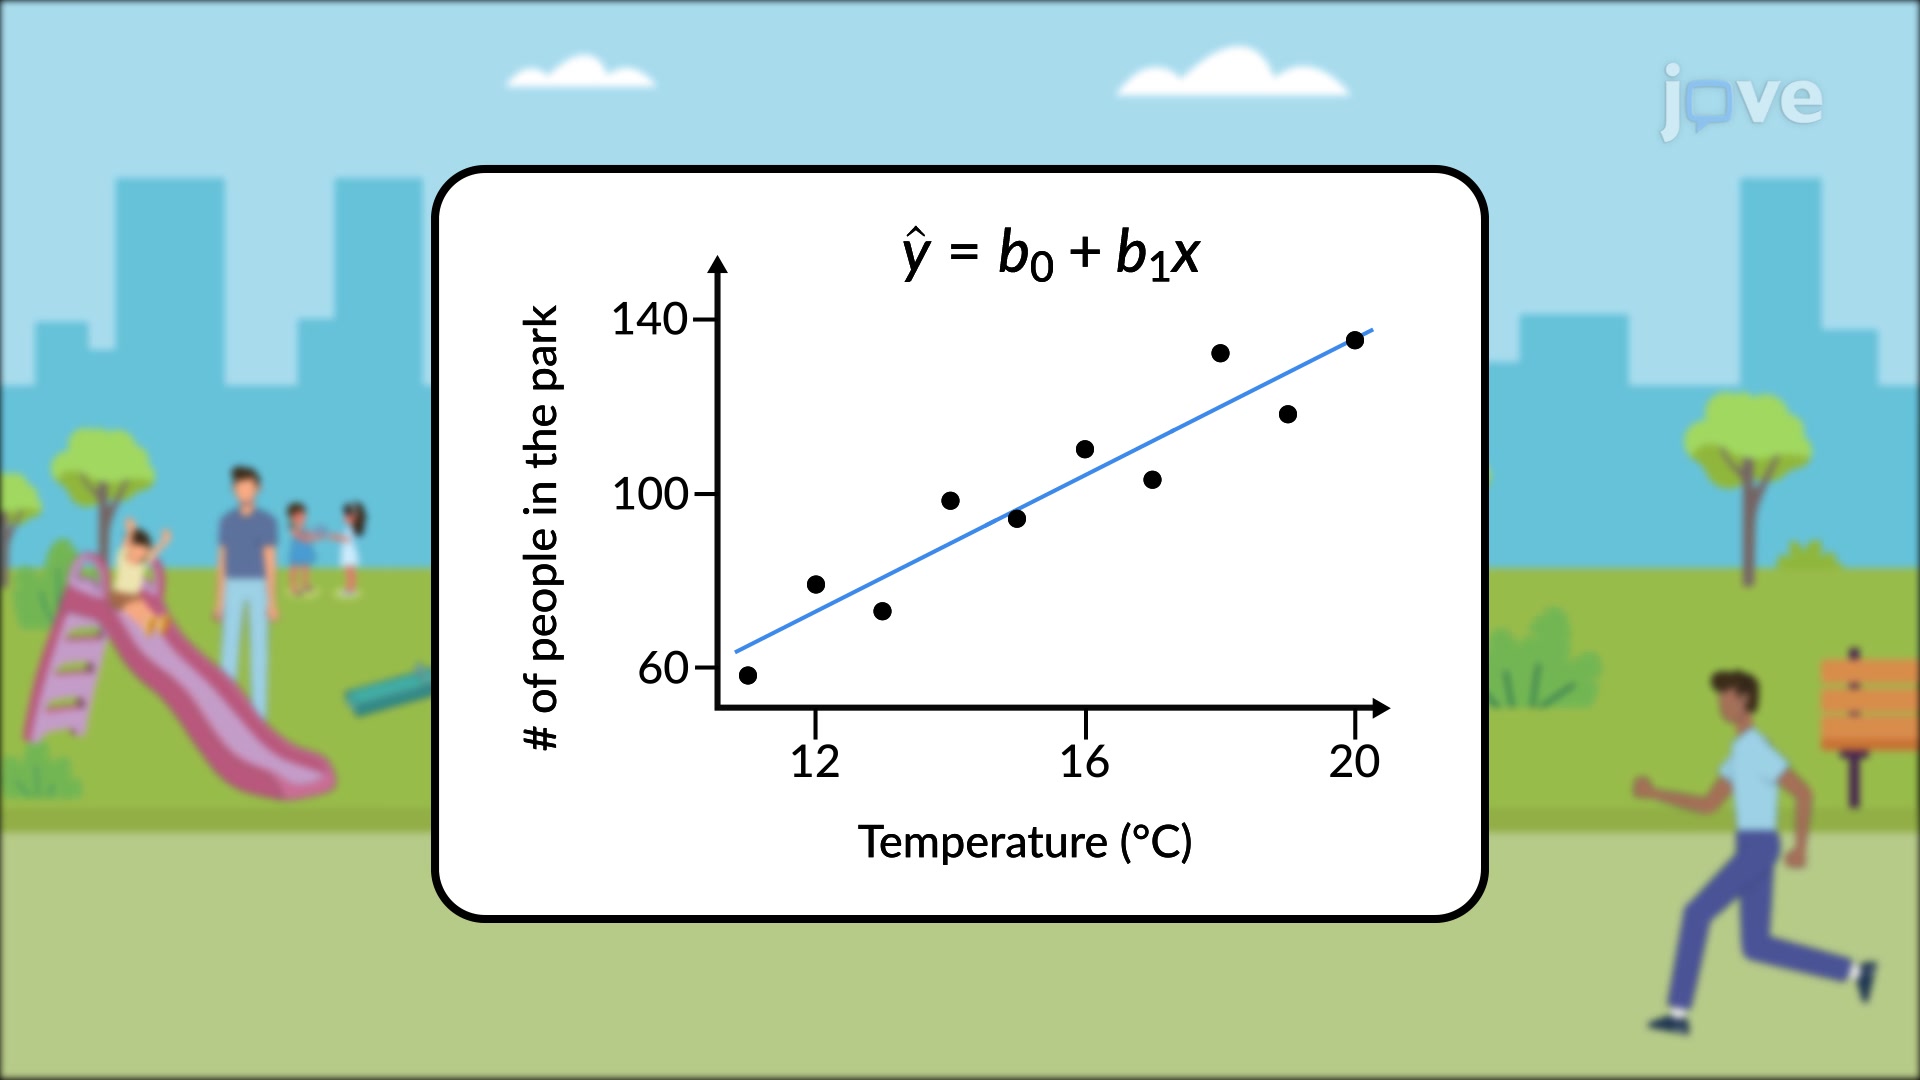
Variation represents the fundamental concept of how data points differ from predicted values and central tendencies in statistical analysis. This variation overview reveals why some predictions work better than others and helps quantify the reliability of statistical relationships. In uncorrelated data sets, the best prediction for any y-value simply equals the mean, but when linear correlation exists, regression equations provide more accurate predictions.
The variation definition encompasses three distinct components that work together. Explained variation measures the vertical distance between predicted y-values and the sample mean, representing deviation that the relationship between variables can account for. For example, when analyzing how GPA predicts MCAT scores, explained variation captures the predictable relationship between academic performance and test results.
Unexplained variation, also called residuals, represents the vertical distance between actual data points and predicted values. This variation basics concept acknowledges that relationships rarely explain everything perfectly. In the GPA-MCAT example, unexplained variation might result from test anxiety, preparation differences, or unmeasured factors affecting individual performance.
Total variation combines both explained and unexplained components, providing the complete picture of data spread. The mathematical relationship follows: Total Variation = Explained Variation + Unexplained Variation. Statisticians square these deviations and sum them across all data points to calculate precise variation measurements, similar to variance calculations students encounter in AP Statistics.
The coefficient of determination (r-squared) emerges from dividing explained variation by total variation, creating a proportion between 0 and 1. This variation concept becomes crucial for college statistics courses and standardized tests. An r-squared value of 0.85 means the regression model explains 85% of the variation, while 15% remains unexplained. Medical schools examining MCAT predictors, for instance, might find undergraduate GPA explains 60% of score variation, with other factors accounting for the remaining 40%.
Understanding variation proves essential for AP Statistics students, pre-med undergraduates analyzing research data, and anyone interpreting statistical studies. This variation study guide principle appears frequently on college entrance exams and helps students evaluate the strength and reliability of statistical relationships in their coursework and future careers.
Related Micro-courses