Loading video…

 10 Concepts
 65.9K views

Video Summary: What Is Correlation
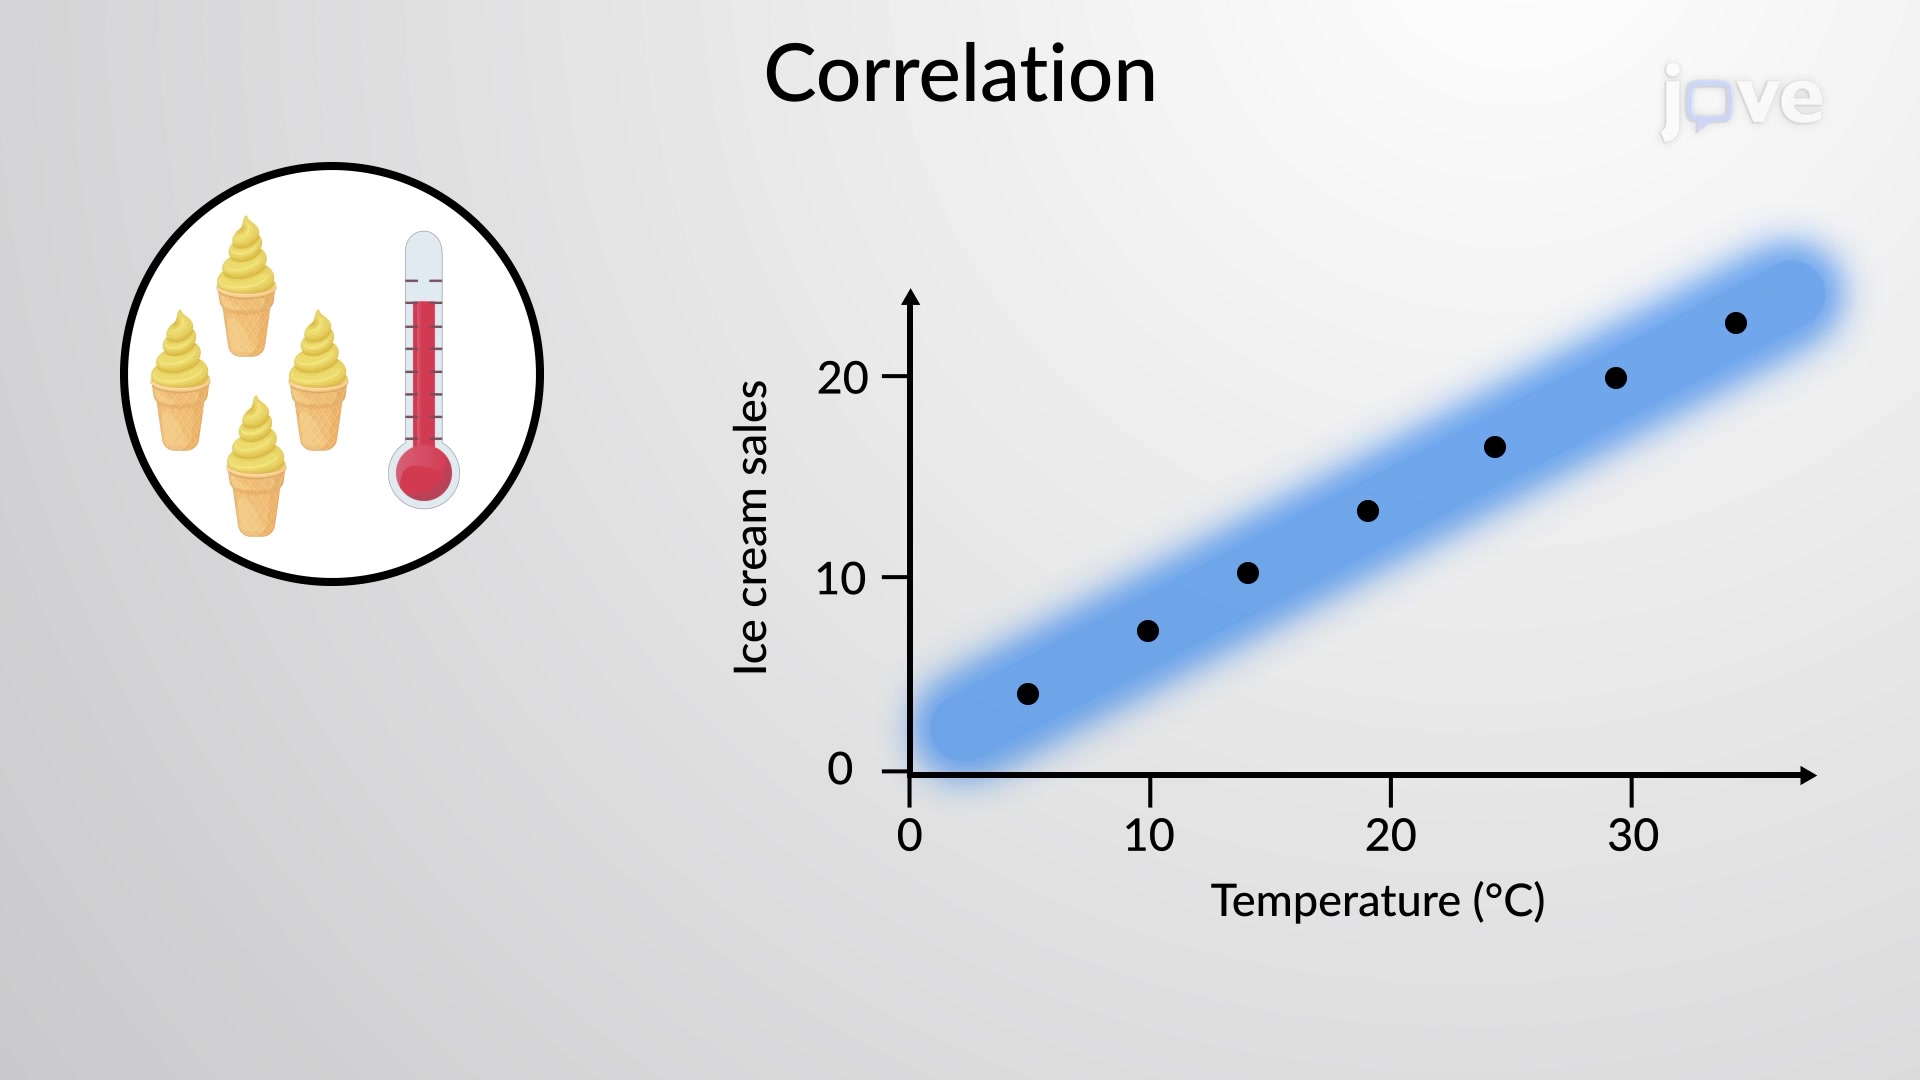
Did you know that ice cream sales in major US cities can predict air conditioning usage with stunning accuracy? Correlation measures how two variables move together, revealing hidden relationships in data all around us. From analyzing SAT scores versus study hours to tracking stock market trends, understanding what is correlation helps us make sense of patterns in everything from sports statistics to medical research. Watch the full video on JoVE Coach to master this concept with expert-led visuals and step-by-step explanations.
Correlation forms the backbone of statistical analysis, measuring how strongly two variables relate to each other. When statisticians examine data, they're often looking for these meaningful connections that help explain patterns in everything from student performance to economic indicators. The correlation definition centers on observing whether changes in one variable correspond with predictable changes in another variable.
Understanding correlation in detail requires recognizing three fundamental types. Positive correlation occurs when both variables increase together-like the relationship between hours studied and GPA scores among college students. As study time increases, grades typically improve as well. Negative correlation shows an inverse relationship, such as the connection between outdoor temperature and heating bills in Chicago homes. As temperatures rise, energy costs for heating decrease. Zero correlation indicates no predictable relationship, like comparing student ID numbers to their chemistry test scores.
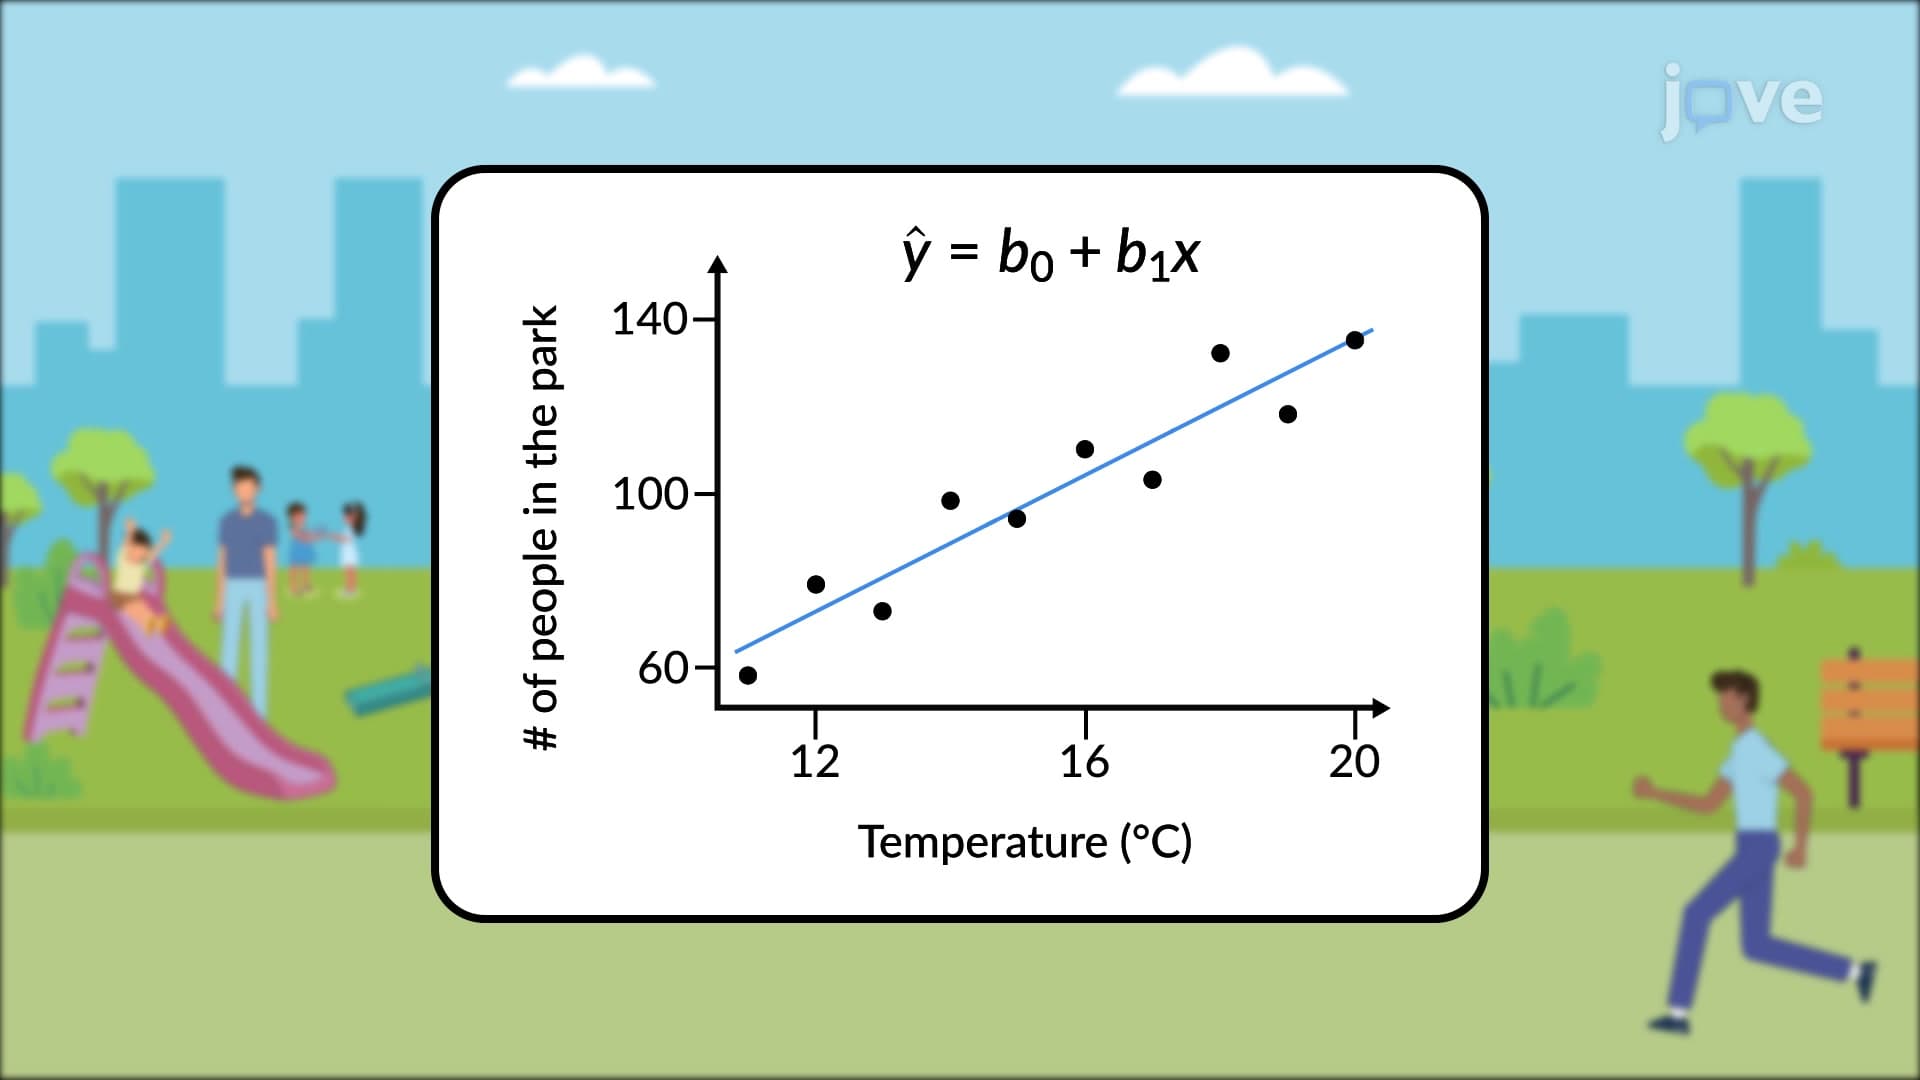
Correlation basics extend beyond simple straight-line relationships. Linear correlations create scatter plots with points roughly following a straight path, making them ideal for introductory statistics courses and AP Statistics exam questions. However, many real-world phenomena display non-linear correlations. Consider how vaccination rates initially show little effect on disease transmission, then dramatically reduce infection rates once herd immunity thresholds are reached. This correlation concept appears frequently in epidemiology studies and public health research.
This correlation overview reveals why the concept appears across multiple disciplines. In psychology research at universities like Stanford and UCLA, researchers examine correlations between social media usage and anxiety levels among teenagers. Economics students analyze correlations between unemployment rates and consumer spending patterns. Pre-med students encounter correlation analysis when studying relationships between lifestyle factors and health outcomes, preparing them for medical school coursework and eventually the MCAT exam.
Correlation study guides emphasize that understanding these relationships helps students excel in quantitative courses, from high school algebra through college-level statistics and research methods classes.
Related Micro-courses