Loading video…

 10 Concepts
 65.9K views

Video Summary: Residuals and Least Squares Property Tutorial
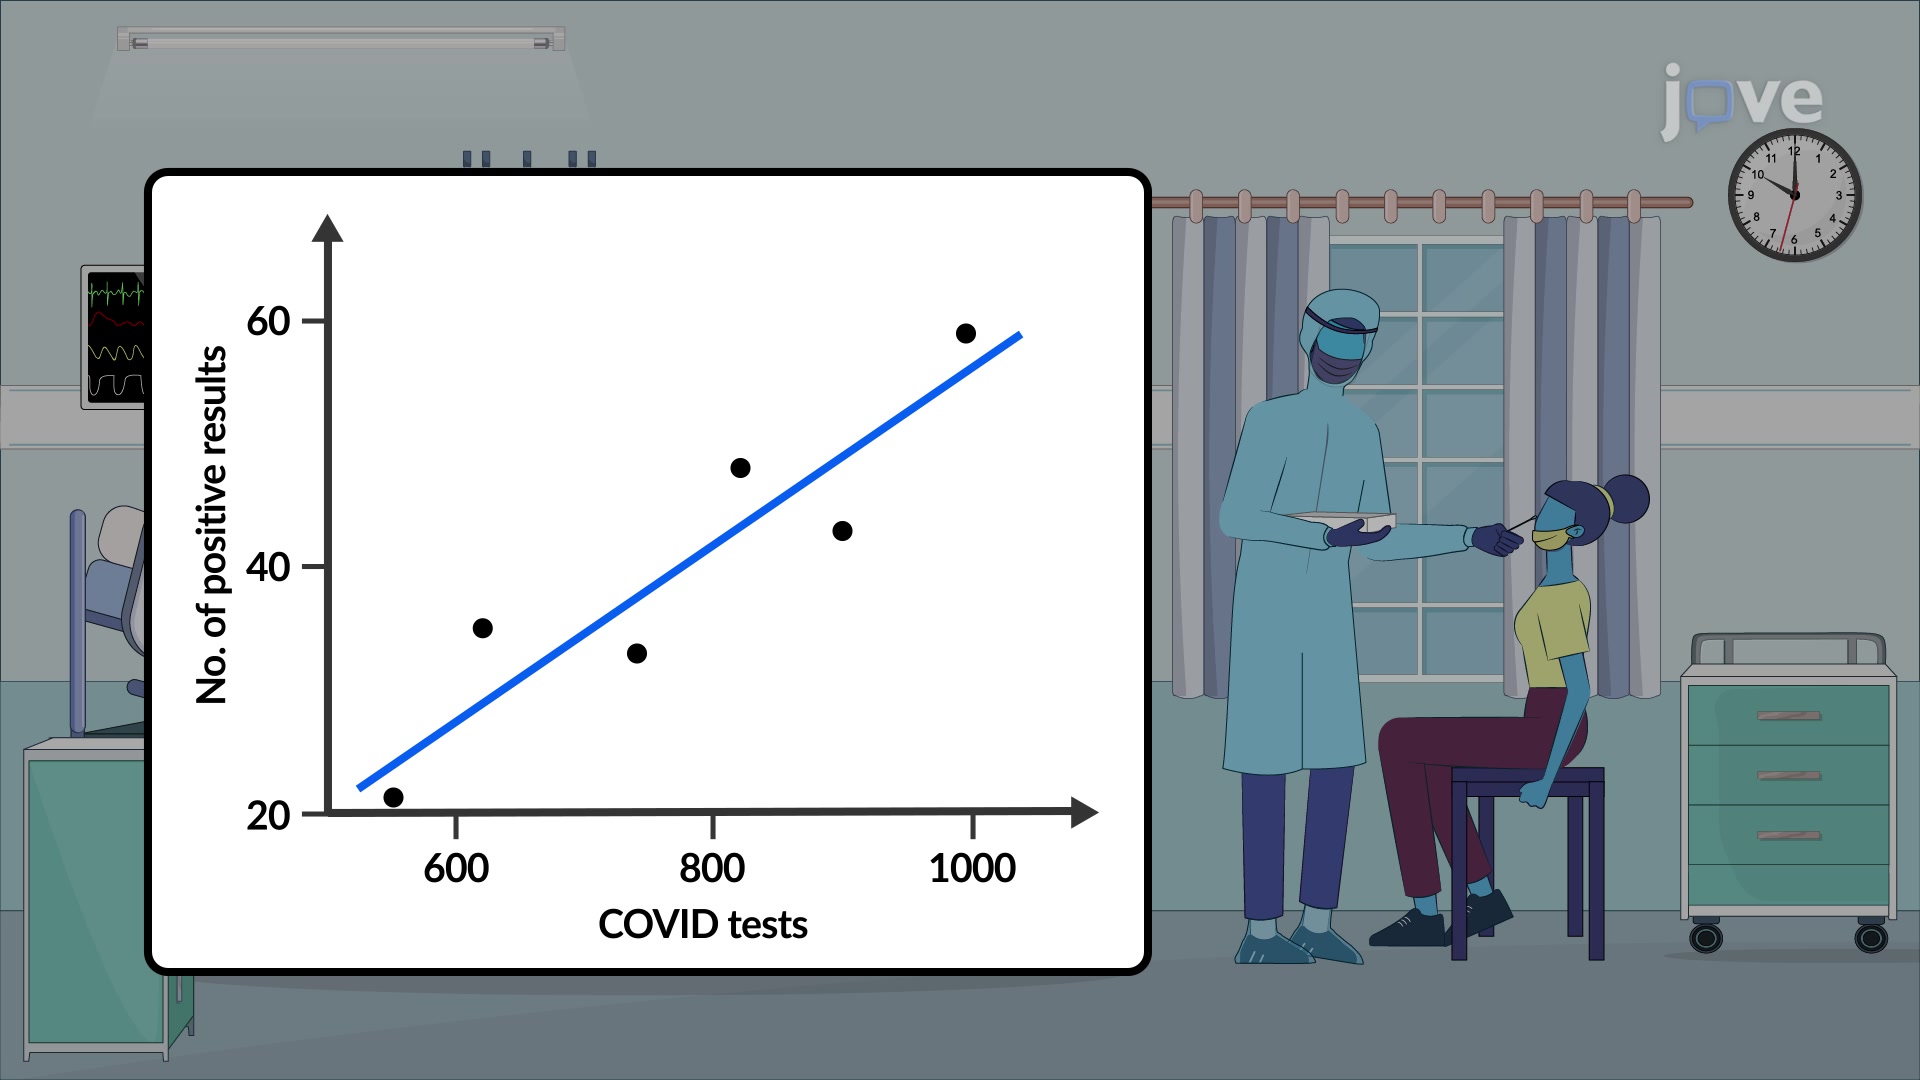
Did you know that during COVID-19, epidemiologists used residuals and least squares property to predict infection rates with remarkable accuracy? This fundamental statistical concept determines whether a regression line truly represents the "best fit" through data points by minimizing squared vertical distances. Using real COVID-19 testing data from U.S. health departments, the Residuals And Least Squares Property Tutorial demonstrates how residuals-the differences between observed and predicted values-must have the smallest possible sum of squares for optimal predictions. Watch the full video on JoVE Coach to master this concept with expert-led visuals and step-by-step explanations.
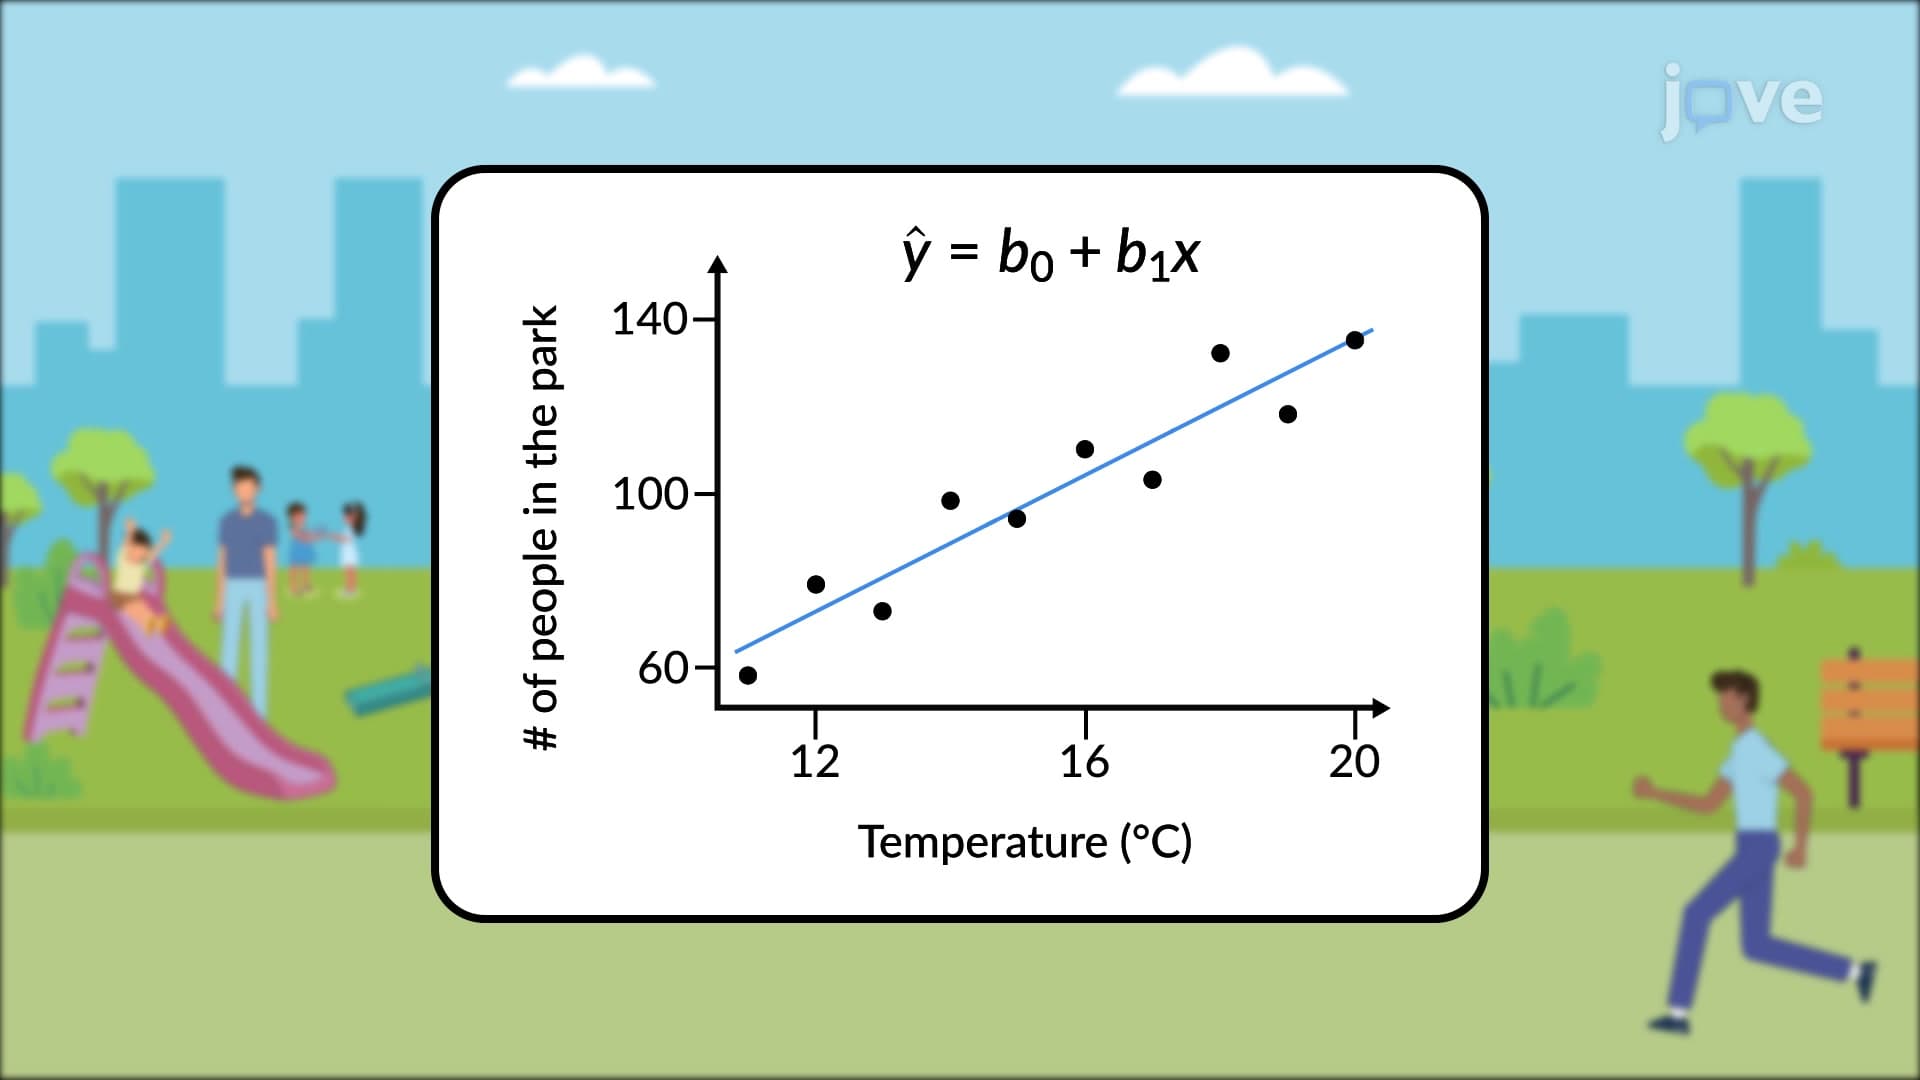
The residuals and least squares property forms the mathematical foundation for determining optimal regression lines in statistical analysis. When analyzing relationships between variables-whether examining SAT scores versus study hours or tracking unemployment rates across different states-statisticians need objective criteria for identifying the "best" line through scattered data points.
A residual represents the vertical distance between an actual data point and its corresponding predicted value on a regression line. For instance, if a regression equation predicts 45 positive COVID tests when 820 total tests are administered, but the actual observed value is 48 positive tests, the residual equals 3 (48 - 45 = 3). This difference quantifies how well the regression line captures real-world variation.
The least squares property states that the optimal regression line minimizes the sum of all squared residuals. Why square the residuals? This mathematical technique prevents positive and negative residuals from canceling each other out while heavily penalizing larger prediction errors. The resulting regression line represents the unique solution that minimizes total prediction error across the entire dataset.
Consider analyzing median home prices versus square footage across major U.S. cities. Multiple potential regression lines could connect these data points, but only one satisfies the least squares criterion. Alternative lines-whether steeper, flatter, or shifted vertically-will always produce larger sums of squared residuals, making them mathematically inferior choices for prediction purposes.
Students encounter residuals and least squares property examples throughout AP Statistics, college-level statistics courses, and standardized tests like the SAT Math section. These concepts appear frequently in data analysis problems requiring interpretation of scatter plots and regression equations. Understanding residuals proves essential for evaluating model quality and identifying outliers that might skew predictions.
Professional applications span numerous fields. Economists use least squares regression to model relationships between GDP growth and unemployment rates. Medical researchers apply these techniques to analyze clinical trial data, examining how drug dosages correlate with patient outcomes. Environmental scientists employ regression analysis to study pollution levels across different metropolitan areas, using residual analysis to identify cities with unexpectedly high or low contamination given their industrial activity.
Implementing residuals and least squares property step by step involves several systematic calculations. First, establish the regression equation using standard formulas for slope and intercept. Next, substitute each x-value into this equation to generate predicted y-values. Calculate individual residuals by subtracting predicted values from observed values. Square each residual to eliminate negative signs, then sum these squared values. The regression line with the smallest sum satisfies the least squares property and provides optimal predictions for the given dataset.
Related Micro-courses