Loading subject page…


5,485 views

Video Summary: Mr Mc and Demand Curve Explained
Ever wonder why Starbucks can charge $5 for coffee while McDonald's charges $1? The mr mc demand curve reveals how businesses in monopolistic competition balance pricing and profits. When a local coffee shop like Blue Bottle Coffee reduces prices to attract customers, it demonstrates the complex relationship between marginal revenue (MR), marginal cost (MC), and demand curves that determines optimal pricing strategies. Understanding Mr Mc And Demand Curve Explained helps predict how firms maximize profits in competitive markets. Watch the full video on JoVE Coach to master this concept with expert-led visuals and step-by-step explanations.
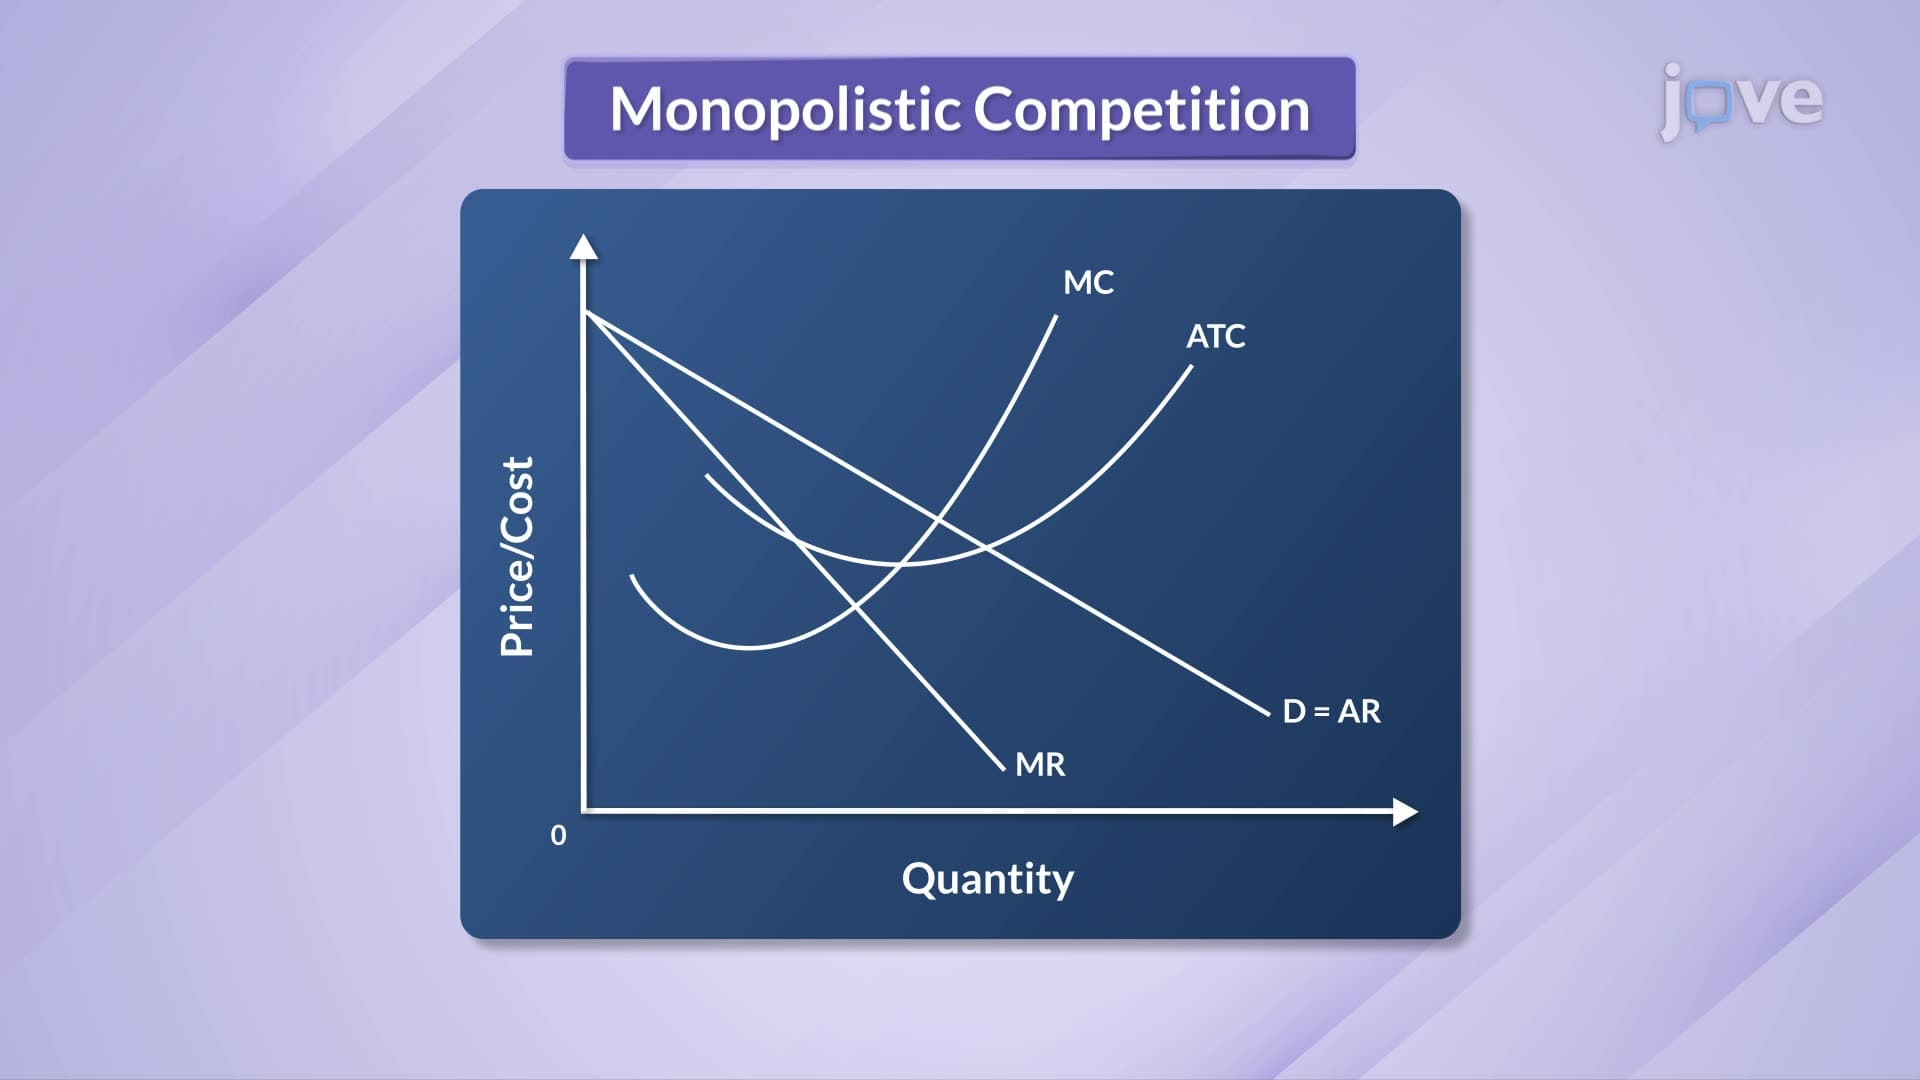
In monopolistic competition, businesses face a unique challenge: they have some pricing power but must compete with similar products. The mr mc and demand curve economics explained through three interconnected curves that guide business decisions. Unlike perfect competition where firms are price-takers, monopolistically competitive firms like Chipotle, local gyms, or independent bookstores can influence their prices while competing with close substitutes.
The demand curve in monopolistic competition slopes downward because firms must lower prices to attract more customers. This creates the fundamental trade-off illustrated in what is mr mc and demand curve analysis. Consider Target competing with Walmart, to increase sales, Target must offer competitive prices, sacrificing some revenue per unit to gain market share. The demand curve's elasticity depends on substitute availability; when CVS faces competition from Walgreens nearby, small price changes significantly impact customer traffic.
The marginal revenue curve lies below the demand (average revenue) curve because of a crucial economic principle: to sell additional units, firms must reduce prices on all units sold. When a local coffee roaster like Intelligentsia reduces coffee prices from $12 to $10 per bag to boost sales, they gain revenue from new customers but lose $2 on each previously sold bag. This revenue loss on existing sales explains why marginal revenue decreases faster than average revenue, creating the gap between MR and AR curves.
Marginal cost initially decreases due to economies of scale, then increases as production constraints emerge. A restaurant like Shake Shack experiences decreasing costs when utilizing kitchen staff and equipment efficiently, but costs rise when overcrowding reduces productivity or overtime wages kick in. The intersection of MR and MC curves determines the profit-maximizing output level, a concept frequently tested on AP Economics exams and college microeconomics courses.
This framework appears across standardized tests, from AP Economics FRQs requiring graphical analysis to college midterms testing optimization principles. Understanding these relationships helps students analyze real business scenarios and predict market outcomes in competitive industries.
Related Micro-courses