Loading subject page…

- Analytical Chemistry
- Chemical Applications of Statistical Analyses
- Calibration Curves: Linear Least Squares
Micro-course: Chemical Applications of Statistical Analyses
104,967 views
Learn key concepts and earn your certificate.





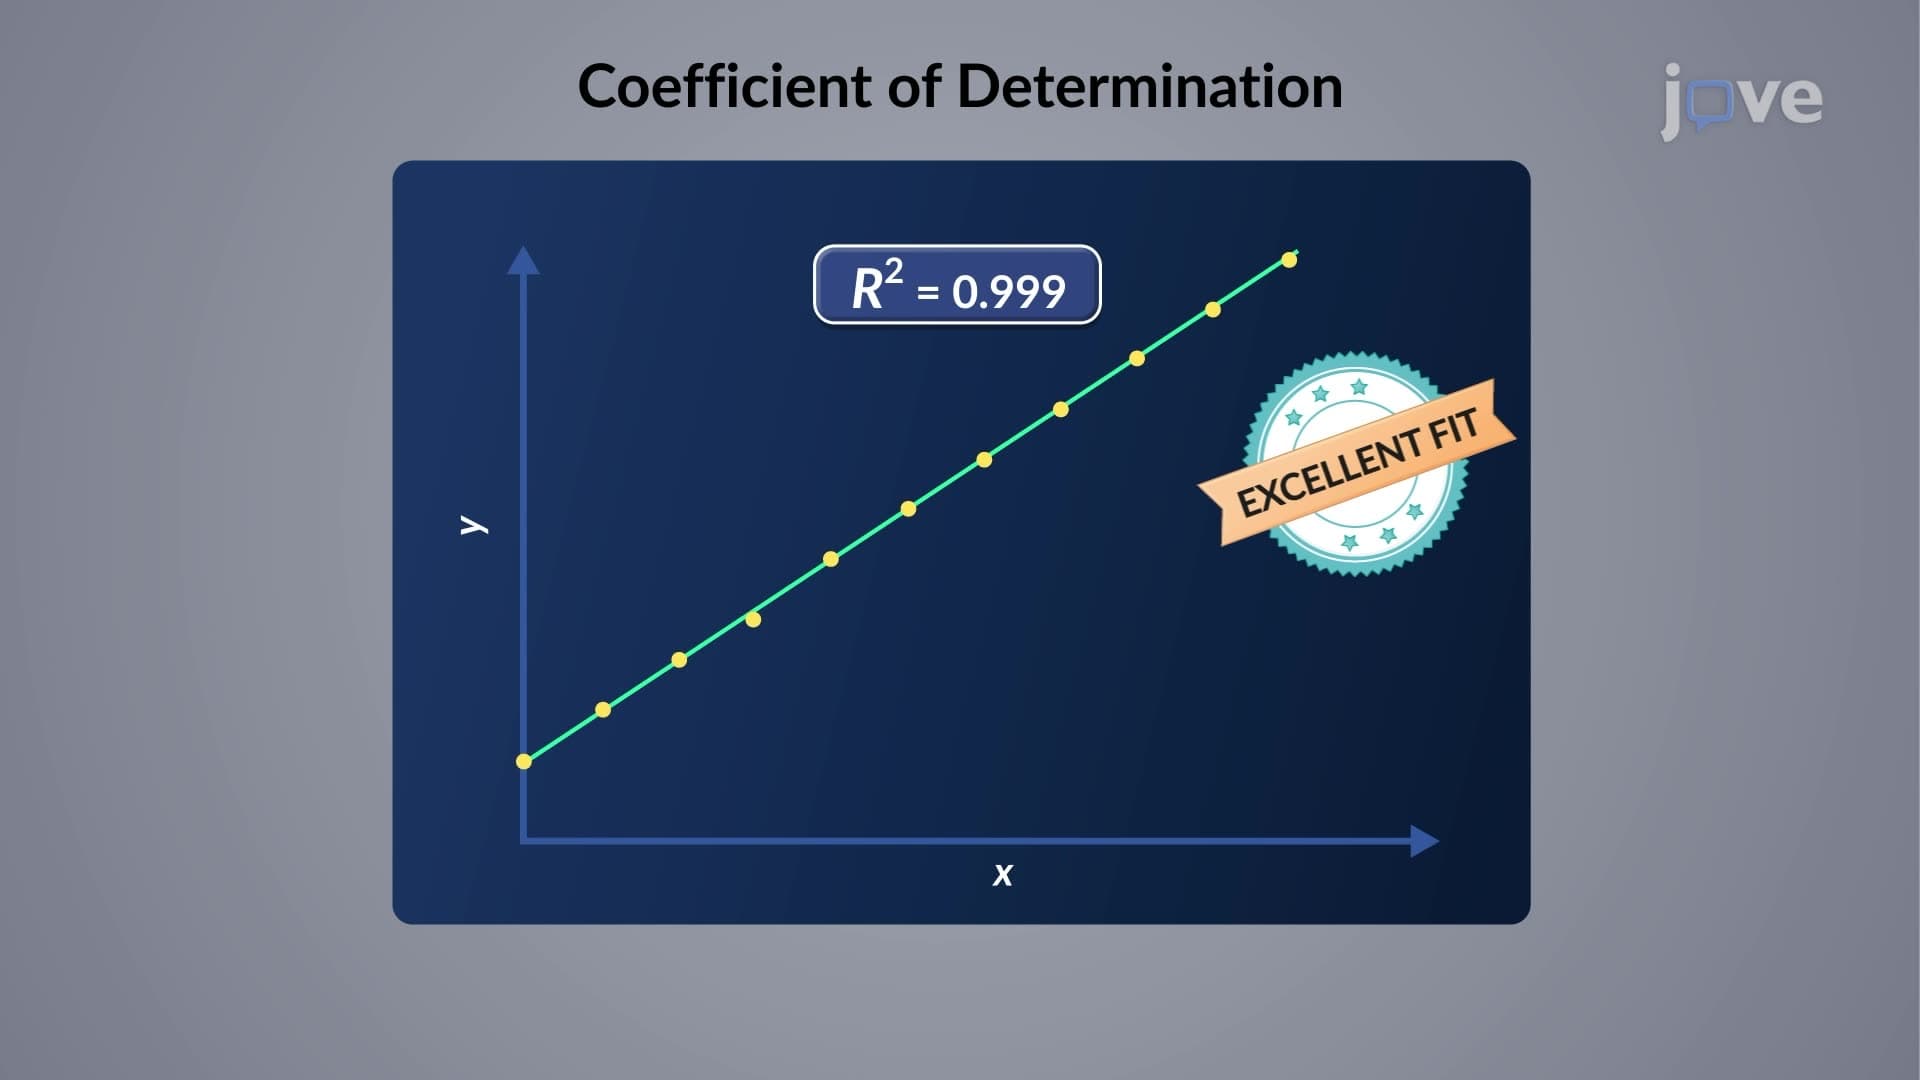




Calibration Curves: Linear Least Squares


00:00
01:20
Video Summary: Calibration Curves Linear Least Squares Explained
Ever wonder how FDA labs determine if your medication contains the exact dosage listed on the bottle? Scientists use calibration curve least squares methods to transform raw instrument readings into precise concentration measurements. The Calibration Curves Linear Least Squares Explained approach helps analytical chemists at companies like Pfizer and Johnson & Johnson ensure drug safety and efficacy by creating mathematical relationships between instrument signals and known analyte concentrations. Watch the full video on JoVE Coach to master this concept with expert-led visuals and step-by-step explanations.
- Understand how Calibration Curves Linear Least Squares Explained methodology transforms instrument signals into quantitative concentration data
- Identify the two fundamental assumptions underlying linear least squares regression in analytical chemistry
- Analyze why random errors cause experimental data points to deviate from perfect linearity
- Apply the least squares method to minimize sum of squared differences between estimated and actual values
- Recognize the mathematical relationship y = mx + c in calibration equations where y represents instrument signal
- Evaluate how slope and y-intercept parameters determine calibration curve accuracy
- Compare linear least squares calibration with other regression methods used in quantitative analysis
- Explore real-world applications of calibration curves in pharmaceutical quality control and environmental testing
Understanding Calibration Curves Linear Least Squares Explained
Linear least squares calibration forms the backbone of quantitative analytical chemistry, enabling scientists to convert raw instrument readings into meaningful concentration data. This mathematical approach addresses a fundamental challenge: while we expect a perfect linear relationship between instrument response and analyte concentration, real experimental data contains inherent variability due to random measurement errors.
The Mathematical Foundation of Best Fit Line Calibration
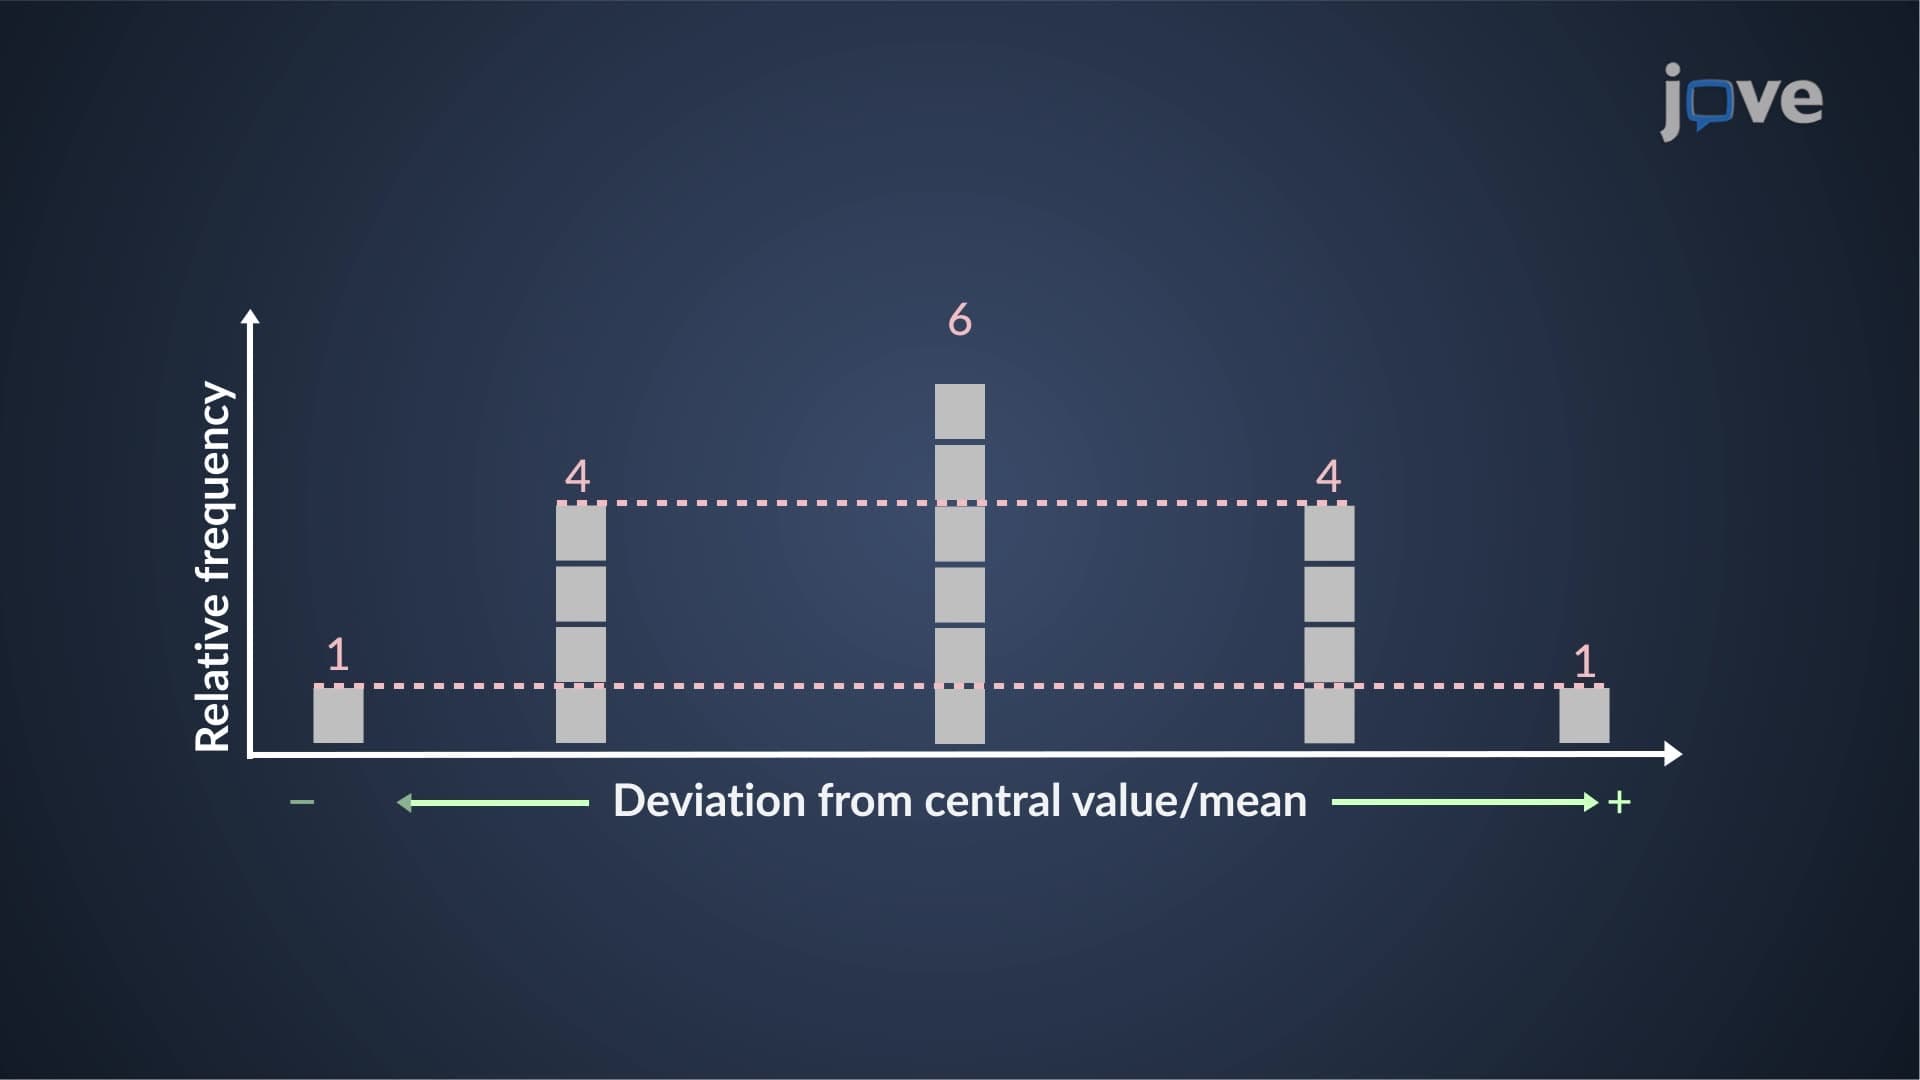
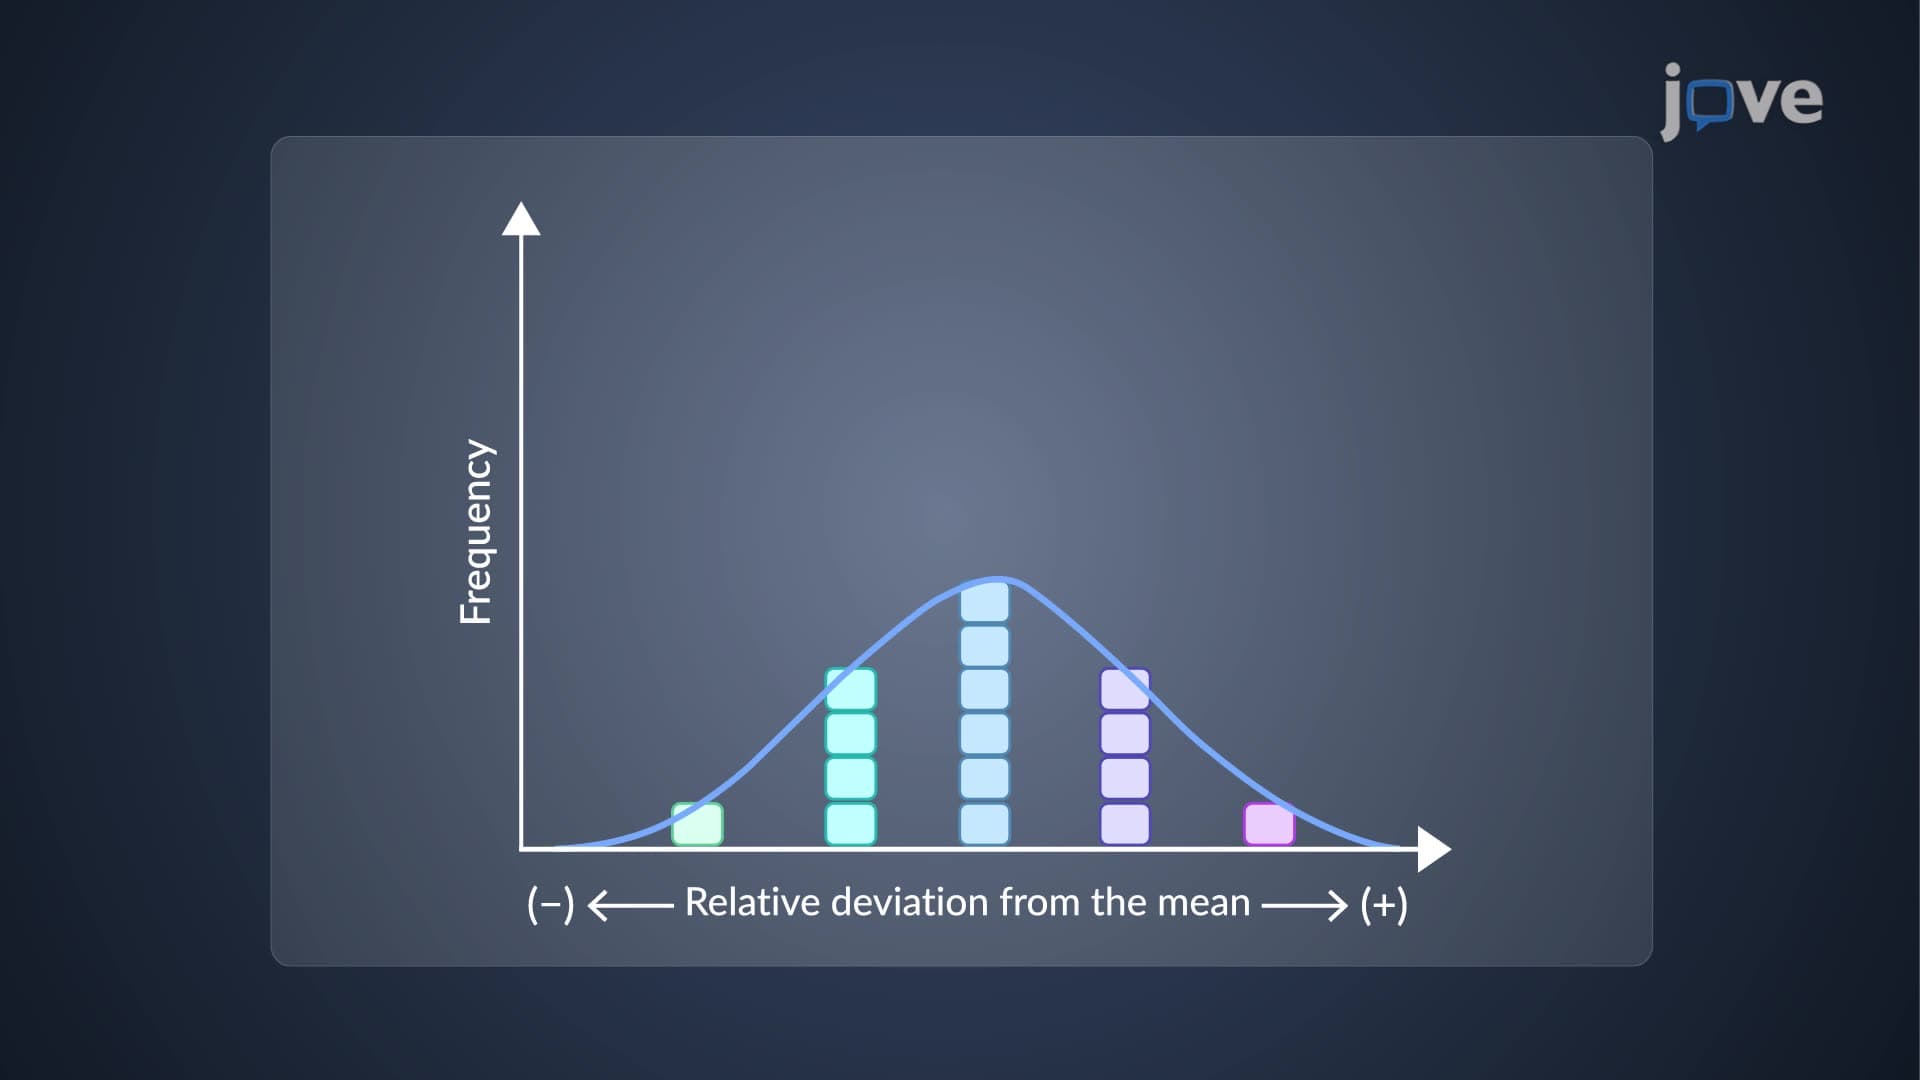
The least squares regression calibration method operates on two critical assumptions. First, a true linear relationship exists between the analytical signal and concentration-meaning doubling the concentration should theoretically double the signal. Second, observed deviations result from random measurement errors rather than systematic biases or operator mistakes.
When constructing calibration curves, scientists measure known standard solutions and plot instrument response (y-axis) against concentration (x-axis). The resulting calibration equation slope intercept relationship follows the familiar form y = mx + c, where m represents sensitivity (how much signal changes per unit concentration) and c accounts for background signal or instrument bias.
Practical Applications in US Laboratory Settings
Major pharmaceutical companies like Merck and Abbott Laboratories rely heavily on how to construct a calibration curve protocols for drug manufacturing. FDA-regulated facilities must demonstrate that their analytical methods can accurately quantify active ingredients within strict tolerance limits-typically ±5% for most pharmaceutical products.
Environmental testing laboratories across the US use similar approaches when analyzing water samples for EPA compliance. For instance, determining lead concentrations in drinking water requires calibration curves spanning the EPA action level of 15 parts per billion, with linear least squares ensuring accurate measurements at these critical regulatory thresholds.
Minimizing Measurement Uncertainty Through Linear Regression Chemistry
The power of linear regression chemistry lies in its ability to find the single best line through multiple data points. Rather than connecting individual points, the least squares algorithm calculates the line that minimizes total squared deviations-effectively balancing positive and negative errors to yield the most statistically reliable relationship.
This approach proves especially valuable for college students preparing for advanced coursework like Physical Chemistry (CHEM 3412 at many universities) or Instrumental Analysis (CHEM 4510). Understanding these principles prepares students for laboratory work where precision and accuracy directly impact research validity and regulatory compliance.
Frequently Asked Questions
A calibration curve least squares method creates a mathematical relationship between instrument signals and known concentrations using regression analysis. It's essential because real experimental data contains random errors that prevent perfect linearity, so the least squares approach finds the statistically best line through multiple calibration points. This enables accurate quantification of unknown samples in pharmaceutical, environmental, and clinical laboratories.
Linear least squares calibration frequently appears in AP Chemistry Unit 4 (Chemical Reactions) and college Analytical Chemistry courses as graphing and calculation problems. Students typically receive instrument response data, must plot calibration curves, determine line equations, and calculate unknown concentrations. The MCAT also tests these concepts in General Chemistry sections, particularly in laboratory technique and data analysis questions.
Linear least squares uses mathematical algorithms to minimize the sum of squared differences between the best-fit line and actual data points, while manually drawing lines introduces subjective bias. The least squares method ensures statistical objectivity and reproducibility-two researchers will get identical results. Manual line-drawing can vary significantly between individuals, making it unsuitable for regulated laboratory environments.
Pharmaceutical companies use calibration curves to ensure accurate dosing in medications by quantifying active ingredients during production. For example, when manufacturing 500mg acetaminophen tablets, quality control laboratories create calibration curves using known acetaminophen standards, then analyze production samples to verify each tablet contains the correct amount. FDA regulations require this documentation for drug approval and ongoing manufacturing compliance.
No advanced math is required-calibration curves primarily use algebra-level concepts like y = mx + c equations and basic graphing skills. High school students in Chemistry or AP Chemistry can successfully learn these methods. The mathematical complexity involves understanding concepts rather than complex calculations, since modern instruments and software handle the computational work automatically.
Practice creating calibration curves from data tables, calculating slopes and intercepts, and determining unknown concentrations from given equations. Focus on understanding when to use calibration curves versus other quantitative methods. Work through problems involving instrument response data and concentration calculations, as these commonly appear on AP Chemistry, college chemistry exams, and professional certification tests like clinical laboratory science board exams.
Yes, linear least squares assumes a truly linear relationship between signal and concentration, which may not hold across wide concentration ranges due to detector saturation or chemical interference. Some analytical methods require curved calibration relationships that need polynomial or other non-linear regression approaches. Additionally, the method assumes random rather than systematic errors-if consistent biases exist, linear least squares won't correct for them.
Build on calibration curve knowledge by exploring method validation parameters like precision, accuracy, detection limits, and linearity ranges. Study more advanced topics including internal standards, standard addition methods, and multi-component analysis. These concepts appear in upper-level analytical chemistry courses and are essential for careers in pharmaceutical analysis, environmental testing, or clinical laboratory science.
Related Micro-courses

19 Concepts

14 Concepts
17 Concepts