Loading subject page…

- Analytical Chemistry
- Chemical Applications of Statistical Analyses
- Difference from Background: Limit of Detection
Micro-course: Chemical Applications of Statistical Analyses
104,965 views
Learn key concepts and earn your certificate.
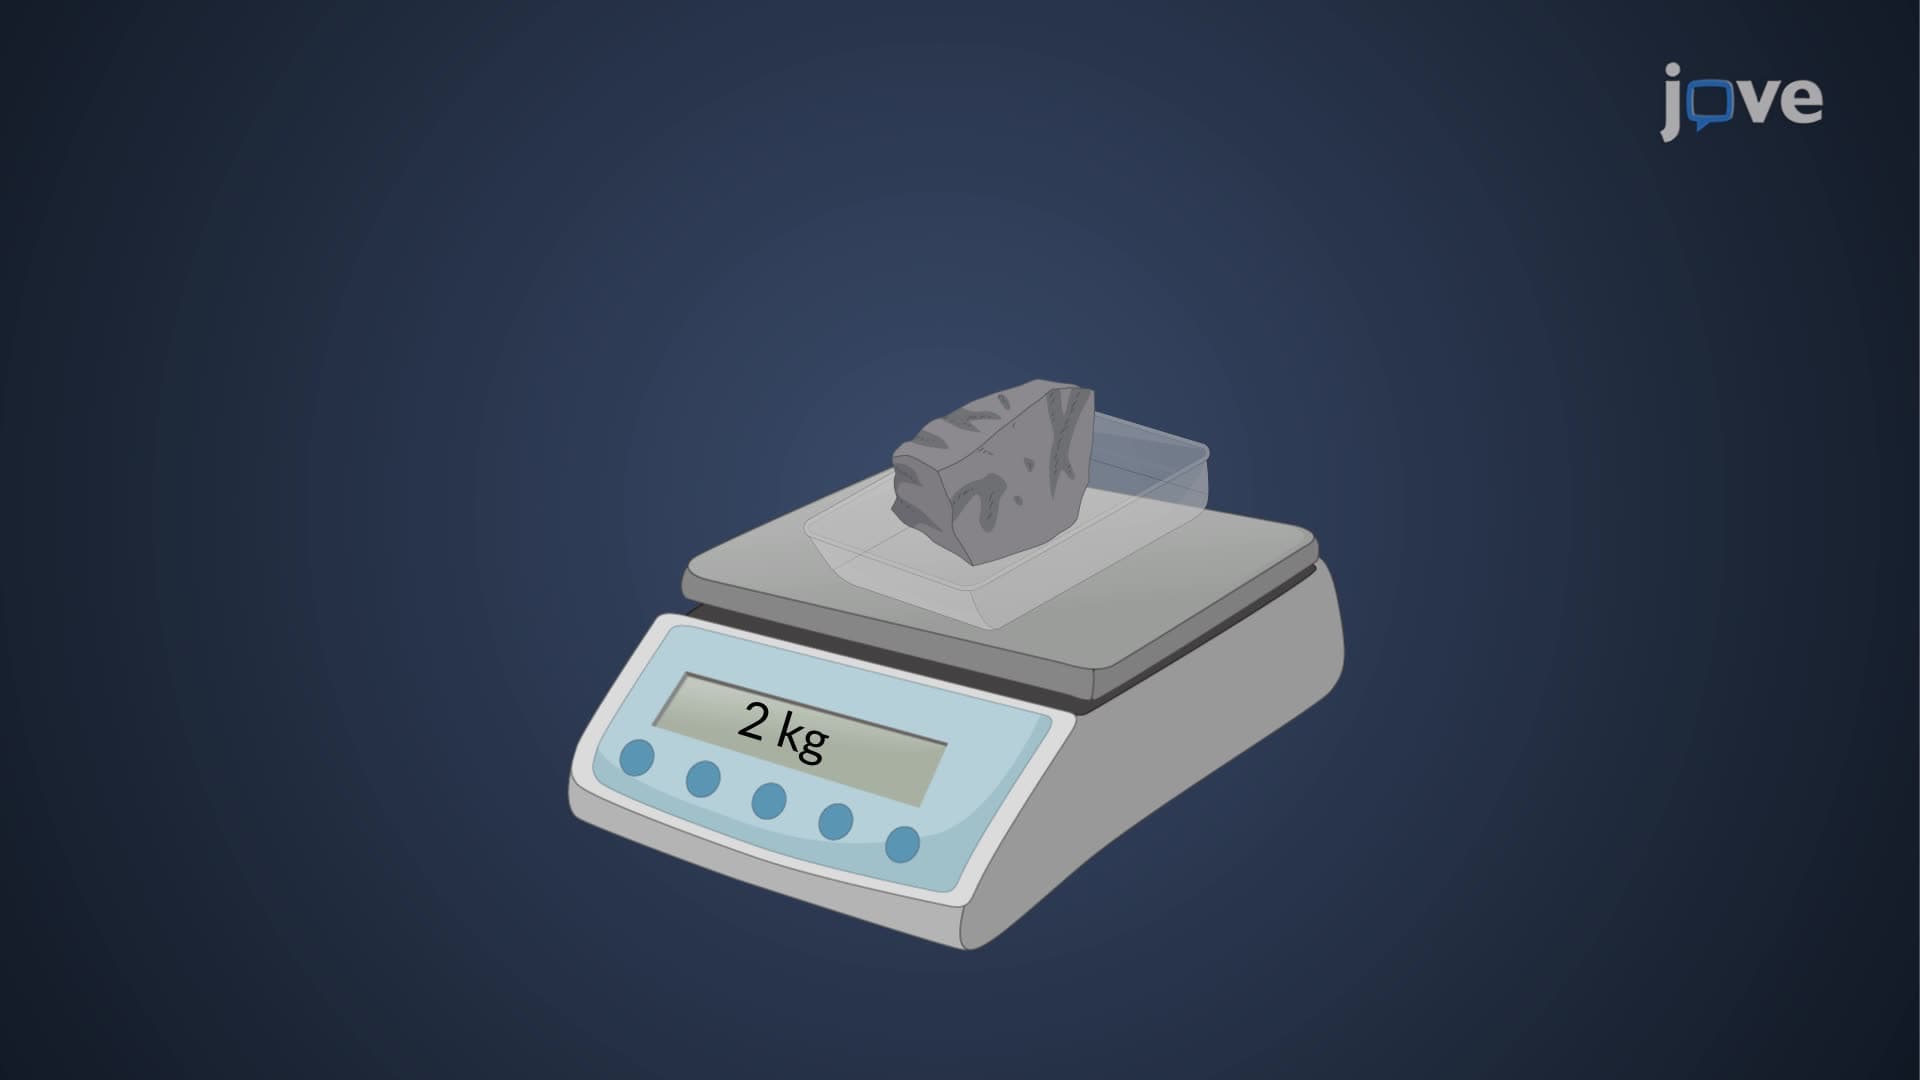

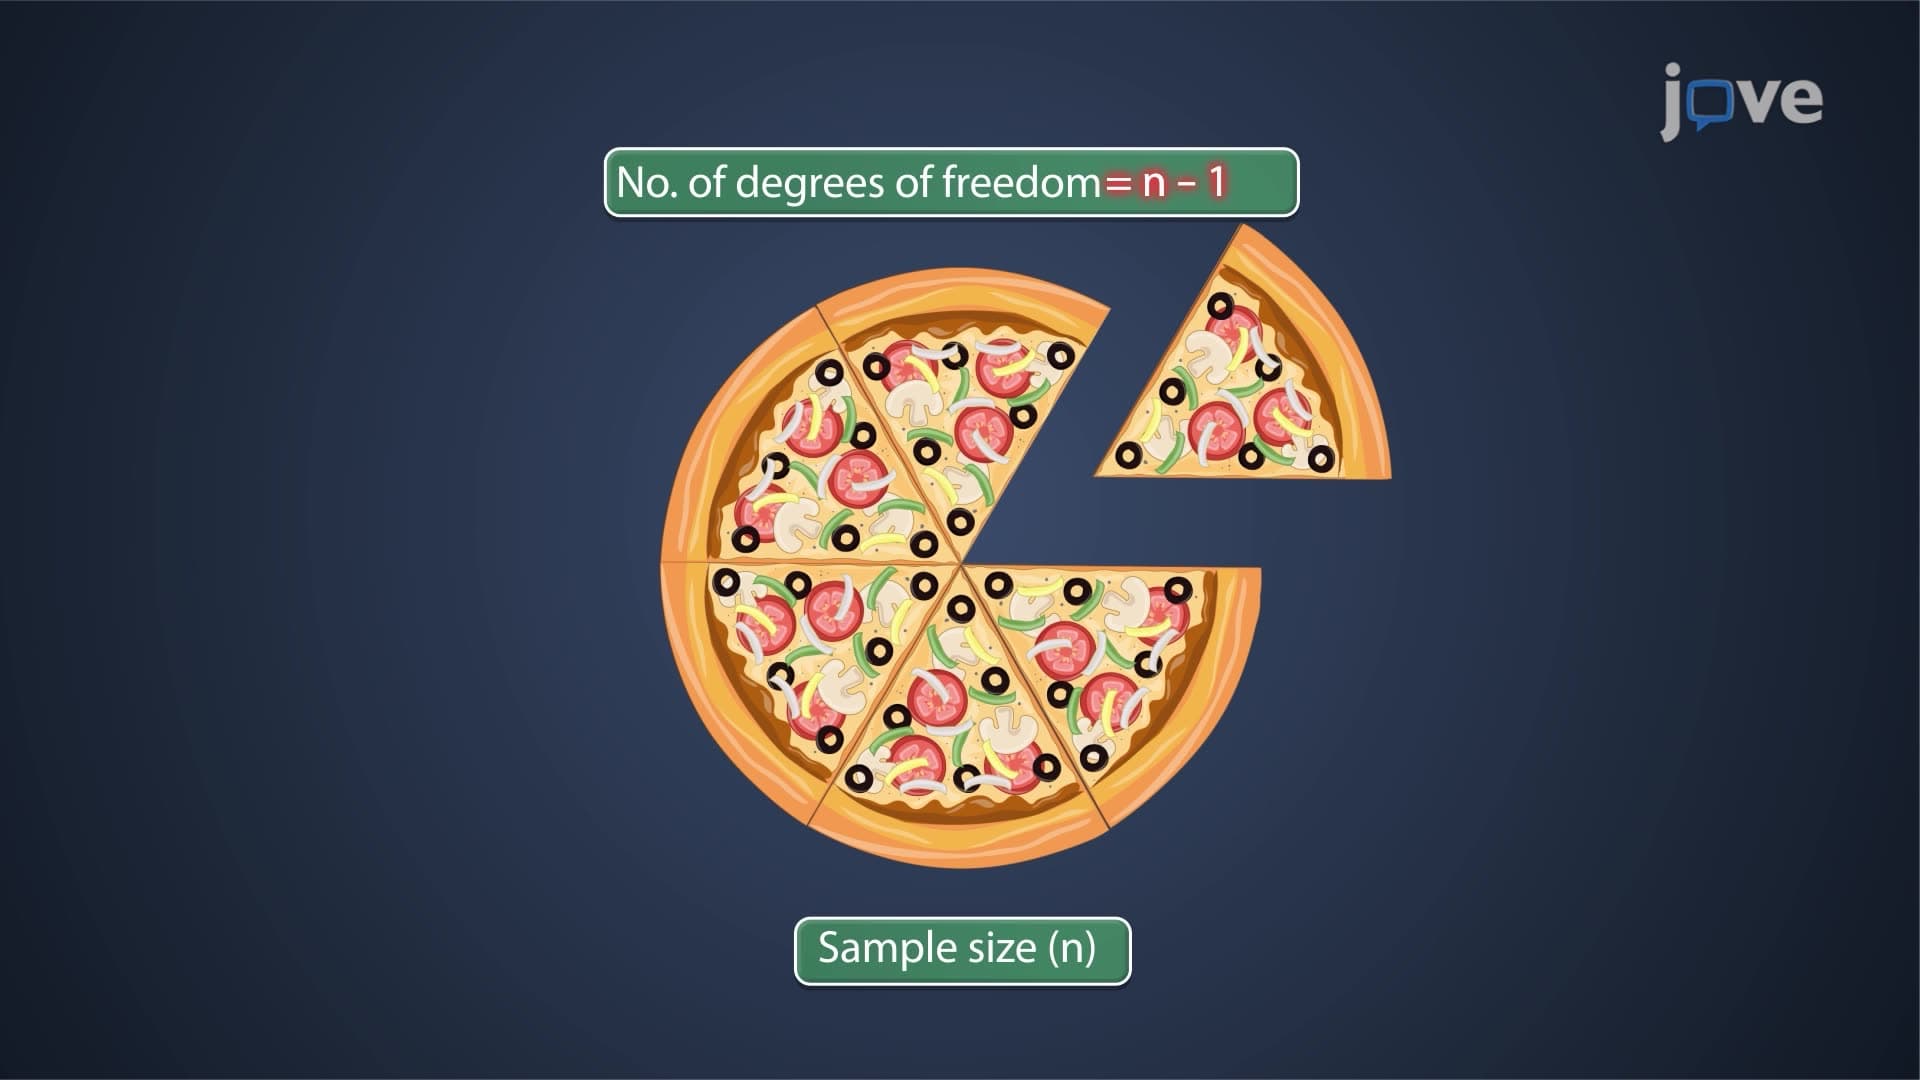
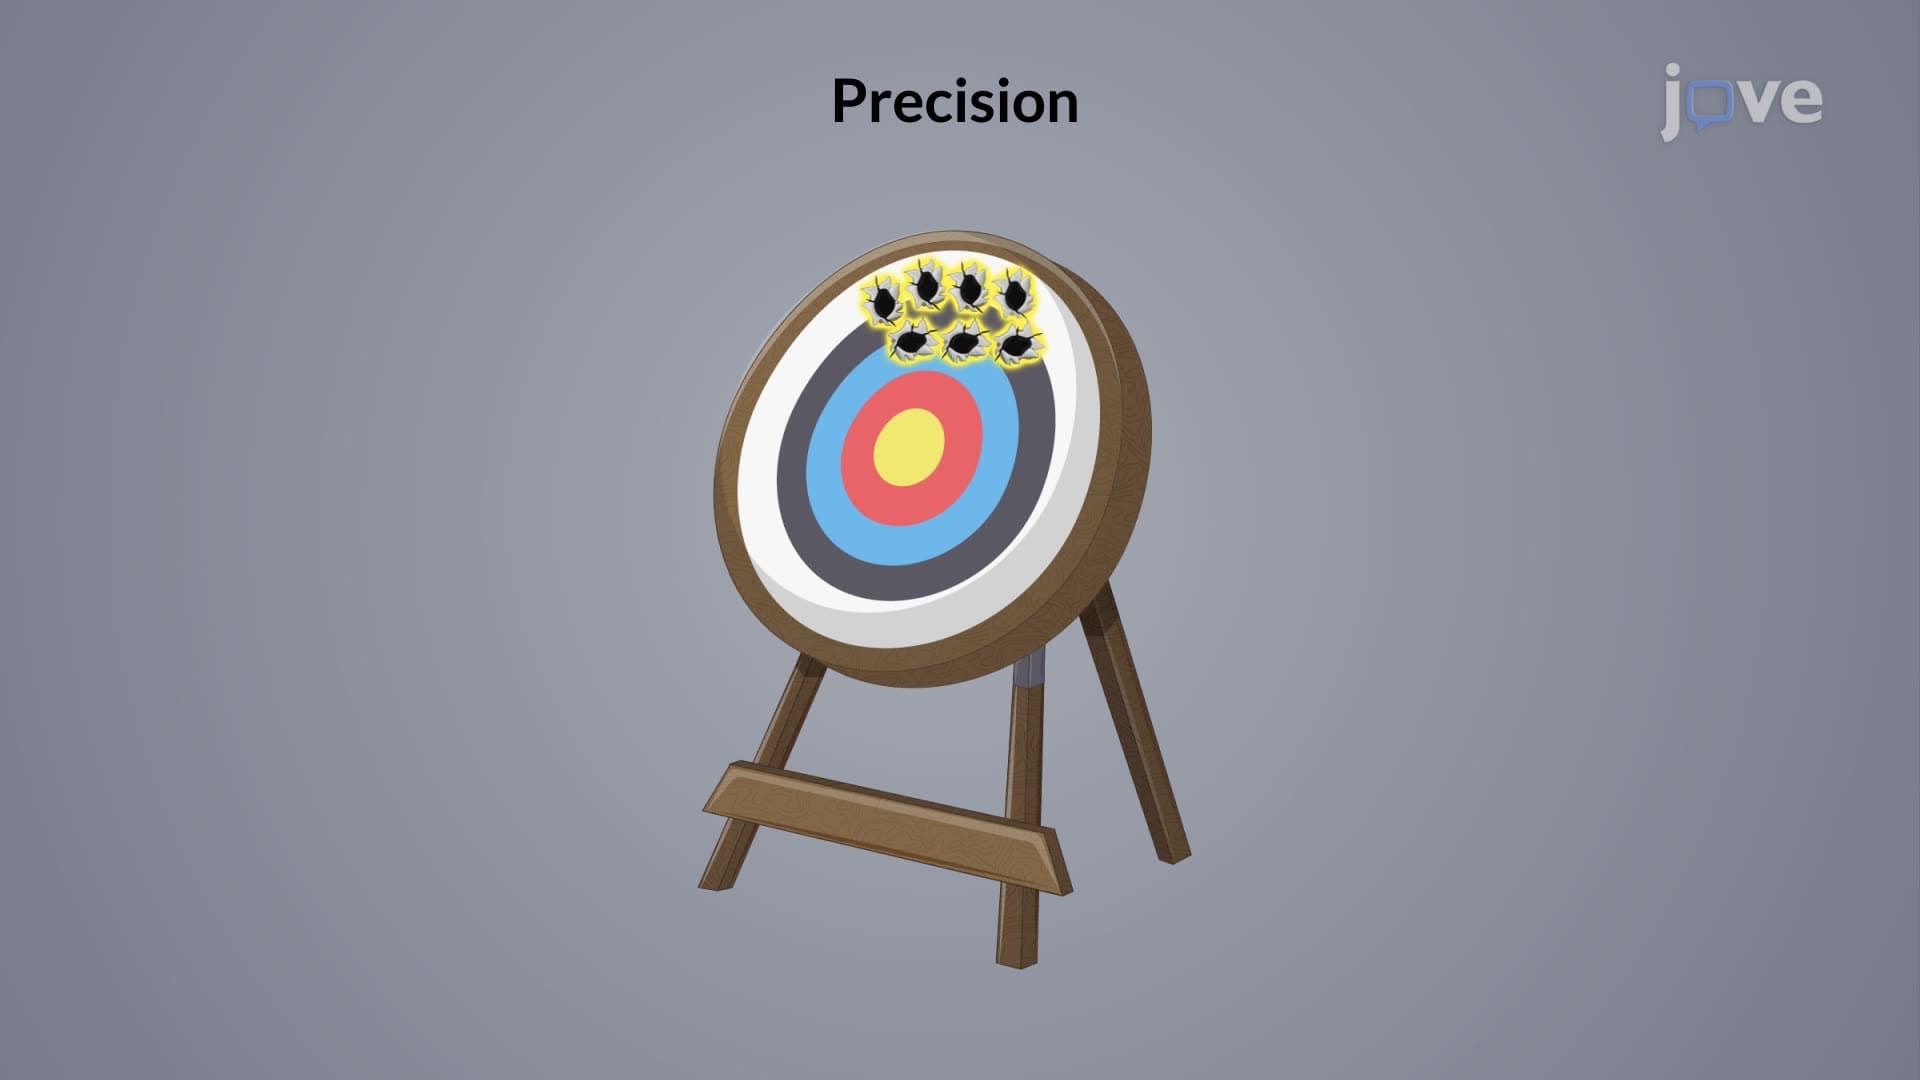
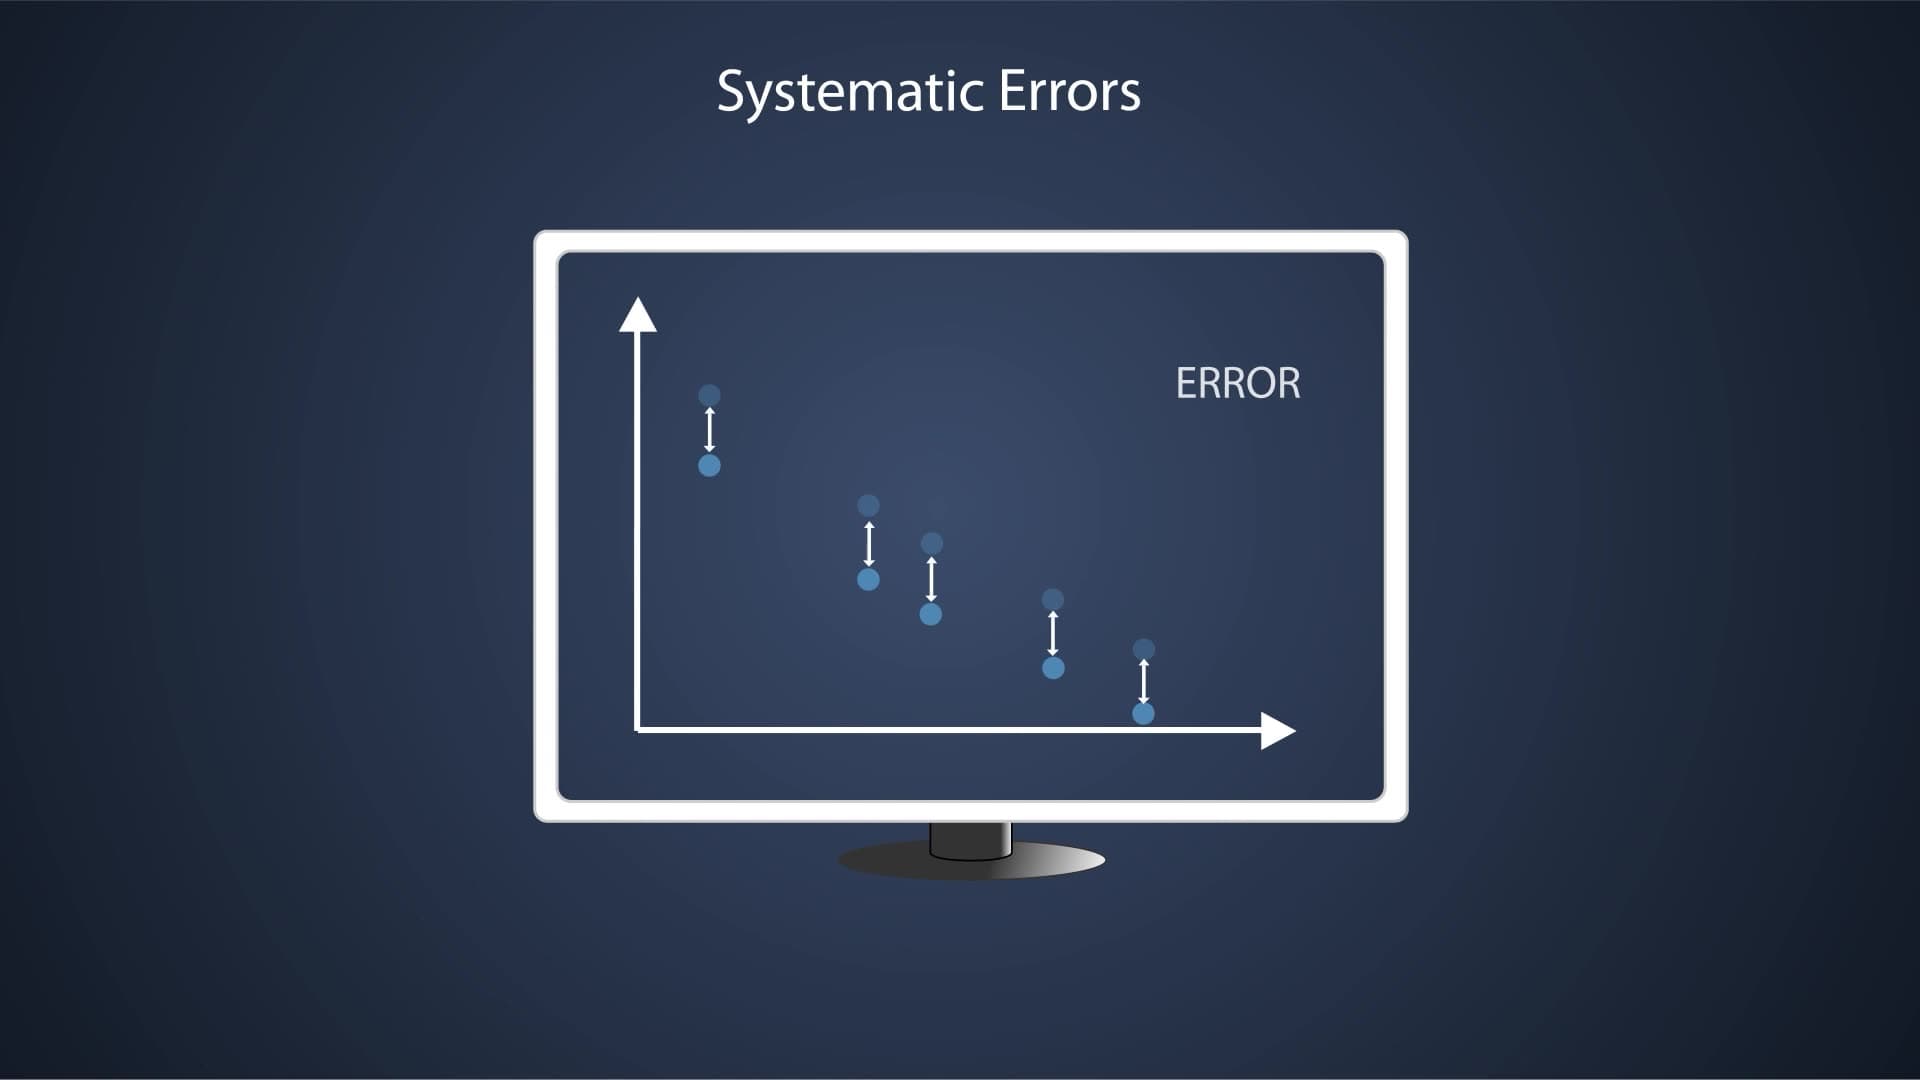


Difference from Background: Limit of Detection

00:00
01:05
Video Summary: Difference From Background Limit of Detection Explained
How can EPA scientists tell if trace amounts of lead in drinking water samples from Flint, Michigan, are real contamination or just instrument noise? The limit of detection explained concept provides the answer through precise mathematical calculations that distinguish true analytical signals from background interference. This fundamental analytical chemistry principle determines the smallest measurable concentration of any substance, from environmental pollutants to pharmaceutical compounds in FDA drug testing. Watch the full video on JoVE Coach to master this concept with expert-led visuals and step-by-step explanations.
- Understand the difference from background limit of detection explained and why it's essential for reliable analytical measurements
- Identify the mathematical relationship between standard deviation of blank signals and detection limits
- Analyze how the 3-sigma rule determines the minimum detectable concentration above background noise
- Compare limit of detection (LOD) and limit of quantification (LOQ) values and their practical applications
- Evaluate the role of calibration curve slope in LOD calculations and measurement sensitivity
- Apply LOD concepts to real-world scenarios like environmental monitoring and pharmaceutical analysis
- Recognize how signal-to-noise ratio impacts analytical method validation
- Explore the connection between detection limits and instrument precision in quantitative analysis
Understanding the Difference From Background Limit of Detection
Every analytical instrument produces some level of background noise-random fluctuations that occur even when no sample is present. The limit of detection explained represents the critical threshold where we can confidently distinguish between a true analytical signal and this inherent noise. Think of it like trying to hear a whisper in a crowded room; there's a minimum volume level needed to distinguish the whisper from background chatter.
Mathematical Foundation: The 3-Sigma Rule
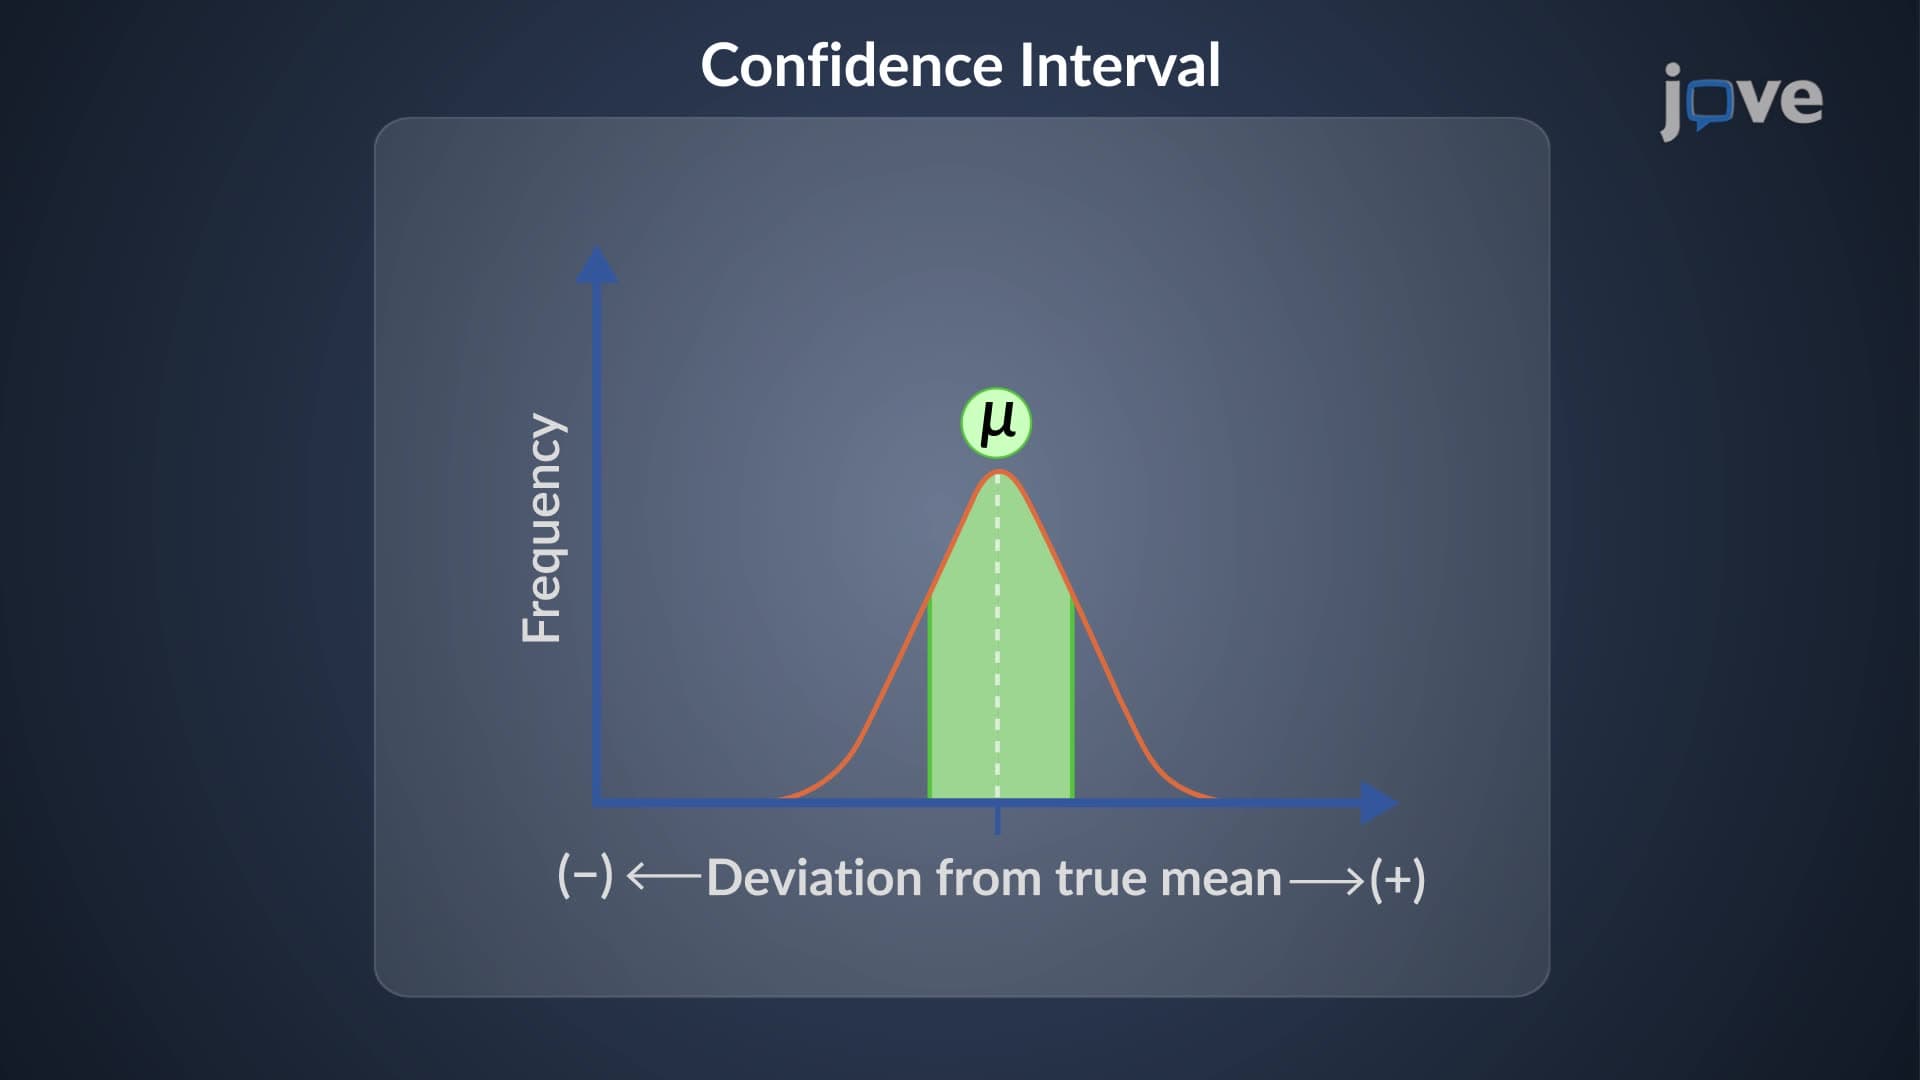
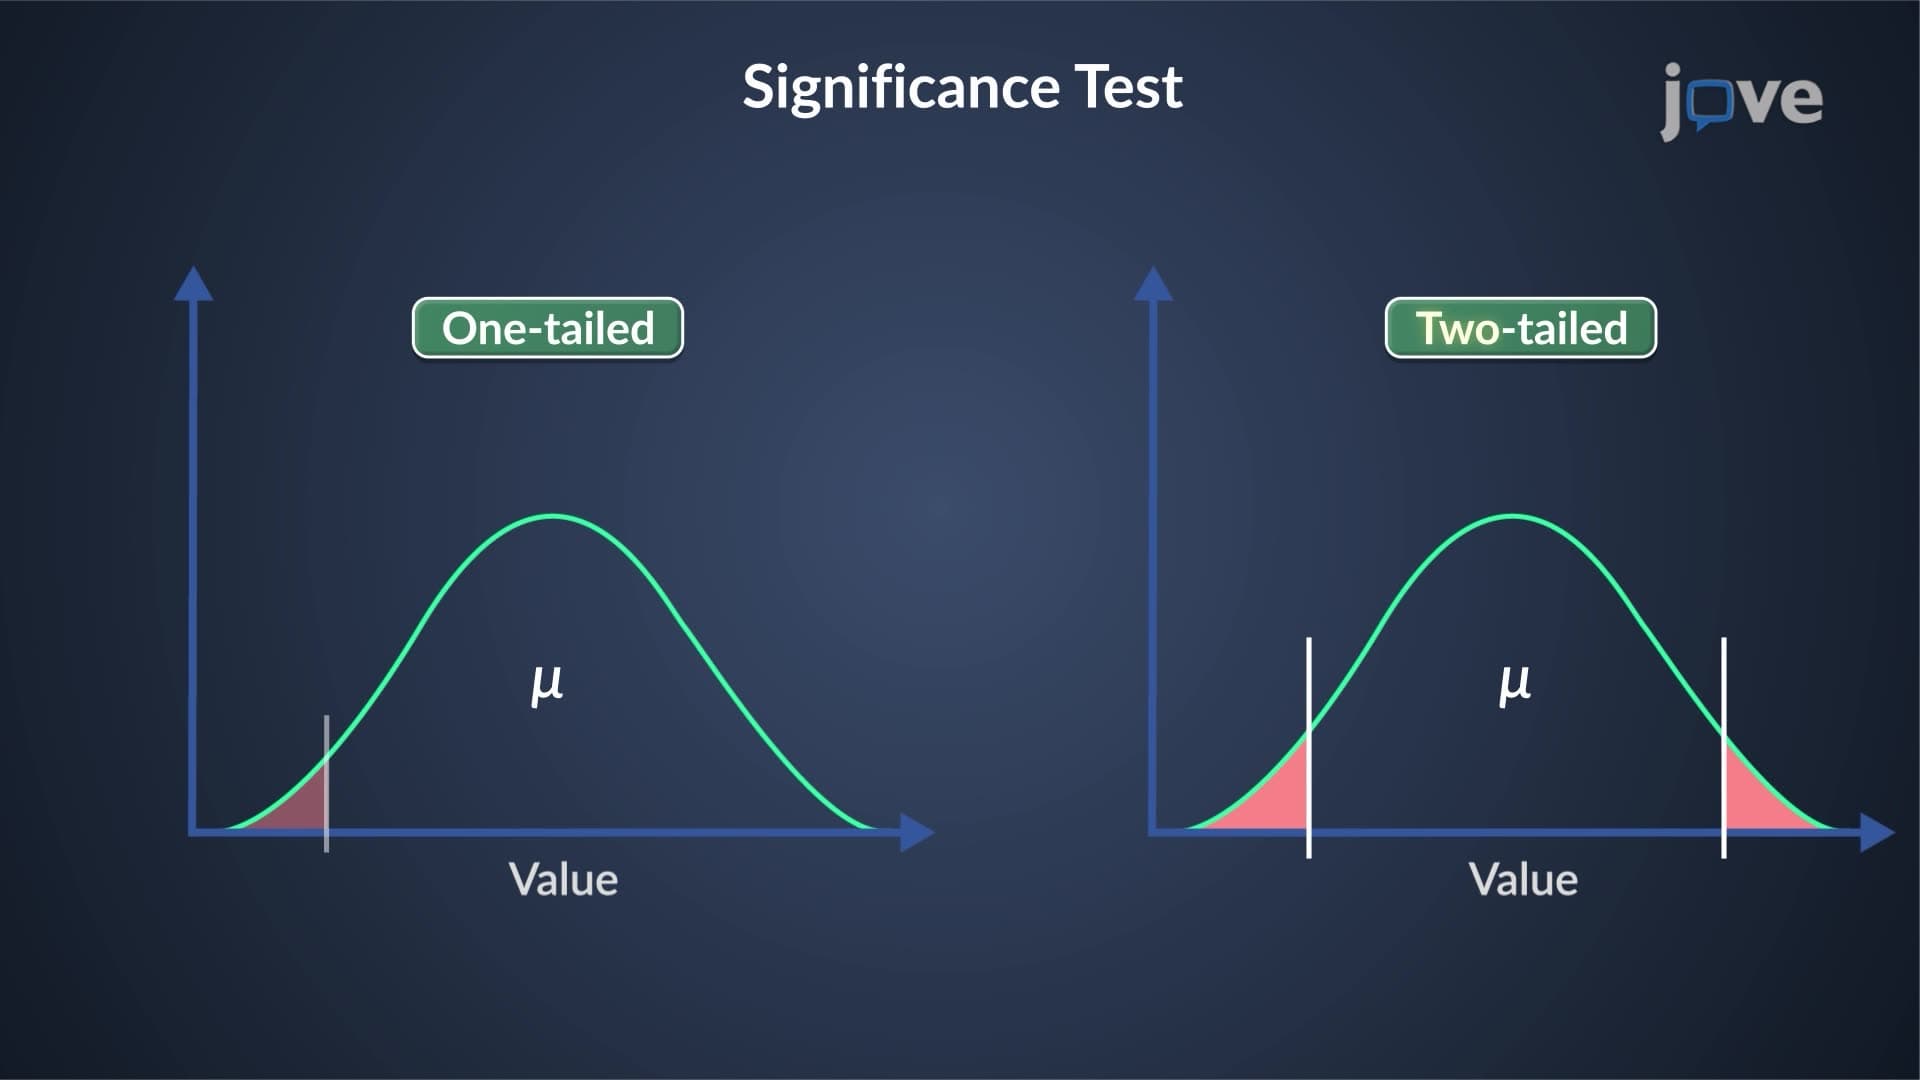
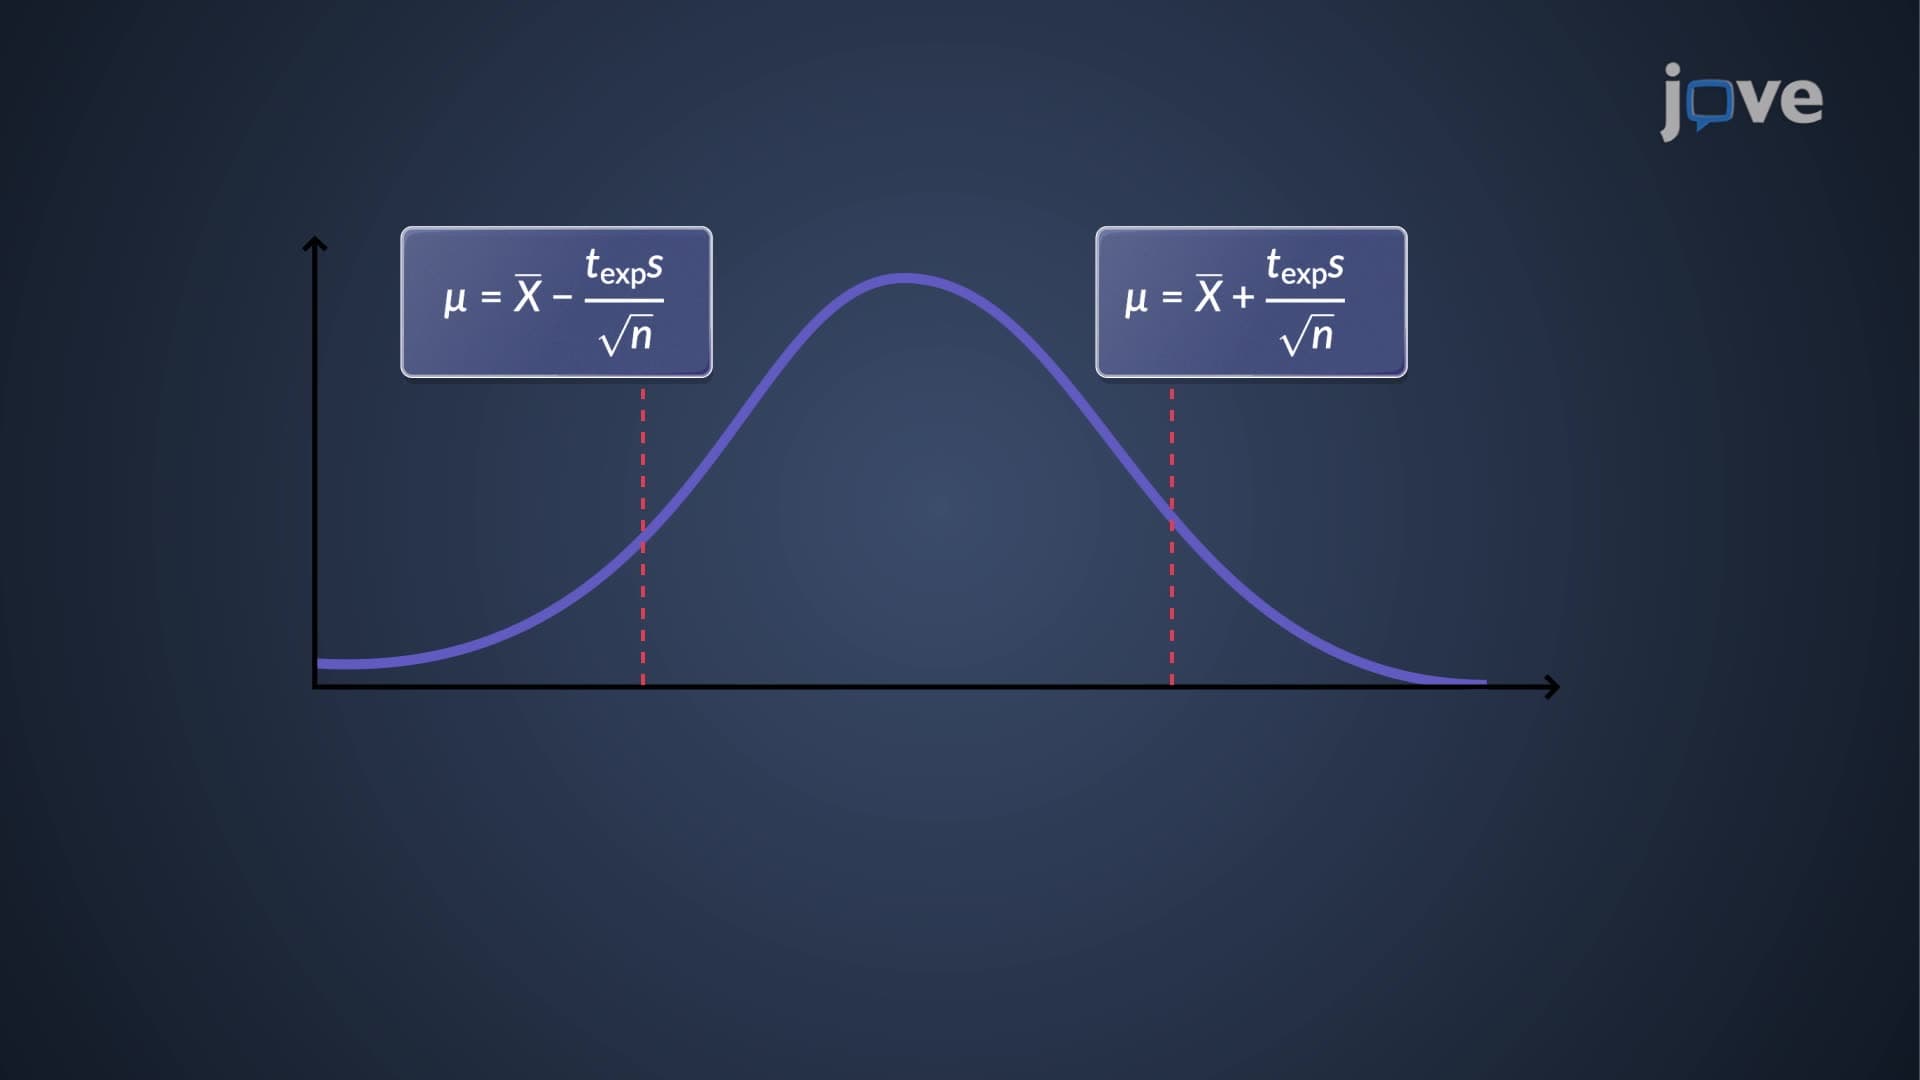
The limit of detection analytical chemistry calculation relies on statistical principles. The formula is: LOD = 3 × (standard deviation of blank) ÷ (slope of calibration curve). The factor of 3 comes from statistical confidence intervals-at three standard deviations above the mean blank signal, we can be 99.7% confident that the signal represents real analyte, not noise. This mathematical approach ensures reproducible, defensible results across laboratories.
How to Calculate Limit of Detection: Step-by-Step Process
To determine how to calculate limit of detection, analysts first run multiple blank samples (typically 7-10 replicates) to establish baseline noise levels. Next, they create a calibration curve using known standard concentrations, measuring the instrument's response. The standard deviation of the blank readings divided by the calibration curve's slope gives the detection limit. For example, if FDA chemists analyzing caffeine in energy drinks find a blank standard deviation of 0.05 units and a calibration slope of 2.5 units per mg/L, the LOD would be (3 × 0.05) ÷ 2.5 = 0.06 mg/L.
Practical Applications and Exam Relevance
This concept appears frequently on AP Chemistry exams, MCAT practice questions, and undergraduate analytical chemistry courses. Students should understand that LOD determines method suitability-environmental labs testing drinking water for arsenic need LODs well below EPA maximum contaminant levels (10 ppb). Similarly, pharmaceutical companies developing new medications must demonstrate their analytical methods can detect impurities at levels required by FDA regulations. Understanding these real-world applications helps students connect theoretical calculations to professional practice.
Frequently Asked Questions
The limit of detection is the lowest concentration of an analyte that can be reliably distinguished from background noise in analytical measurements. It's crucial because it defines the minimum measurable amount of any substance, ensuring that positive results represent real contamination or presence rather than random instrument fluctuations. This concept is fundamental to quality control in industries from environmental testing to pharmaceutical manufacturing.
AP Chemistry exams often test LOD concepts through data analysis questions involving calibration curves and statistical calculations. MCAT questions typically focus on interpreting detection limits in biological contexts, such as determining minimum detectable hormone levels in blood samples. Students should practice calculating LOD using the 3-sigma rule and interpreting what these values mean for experimental design.
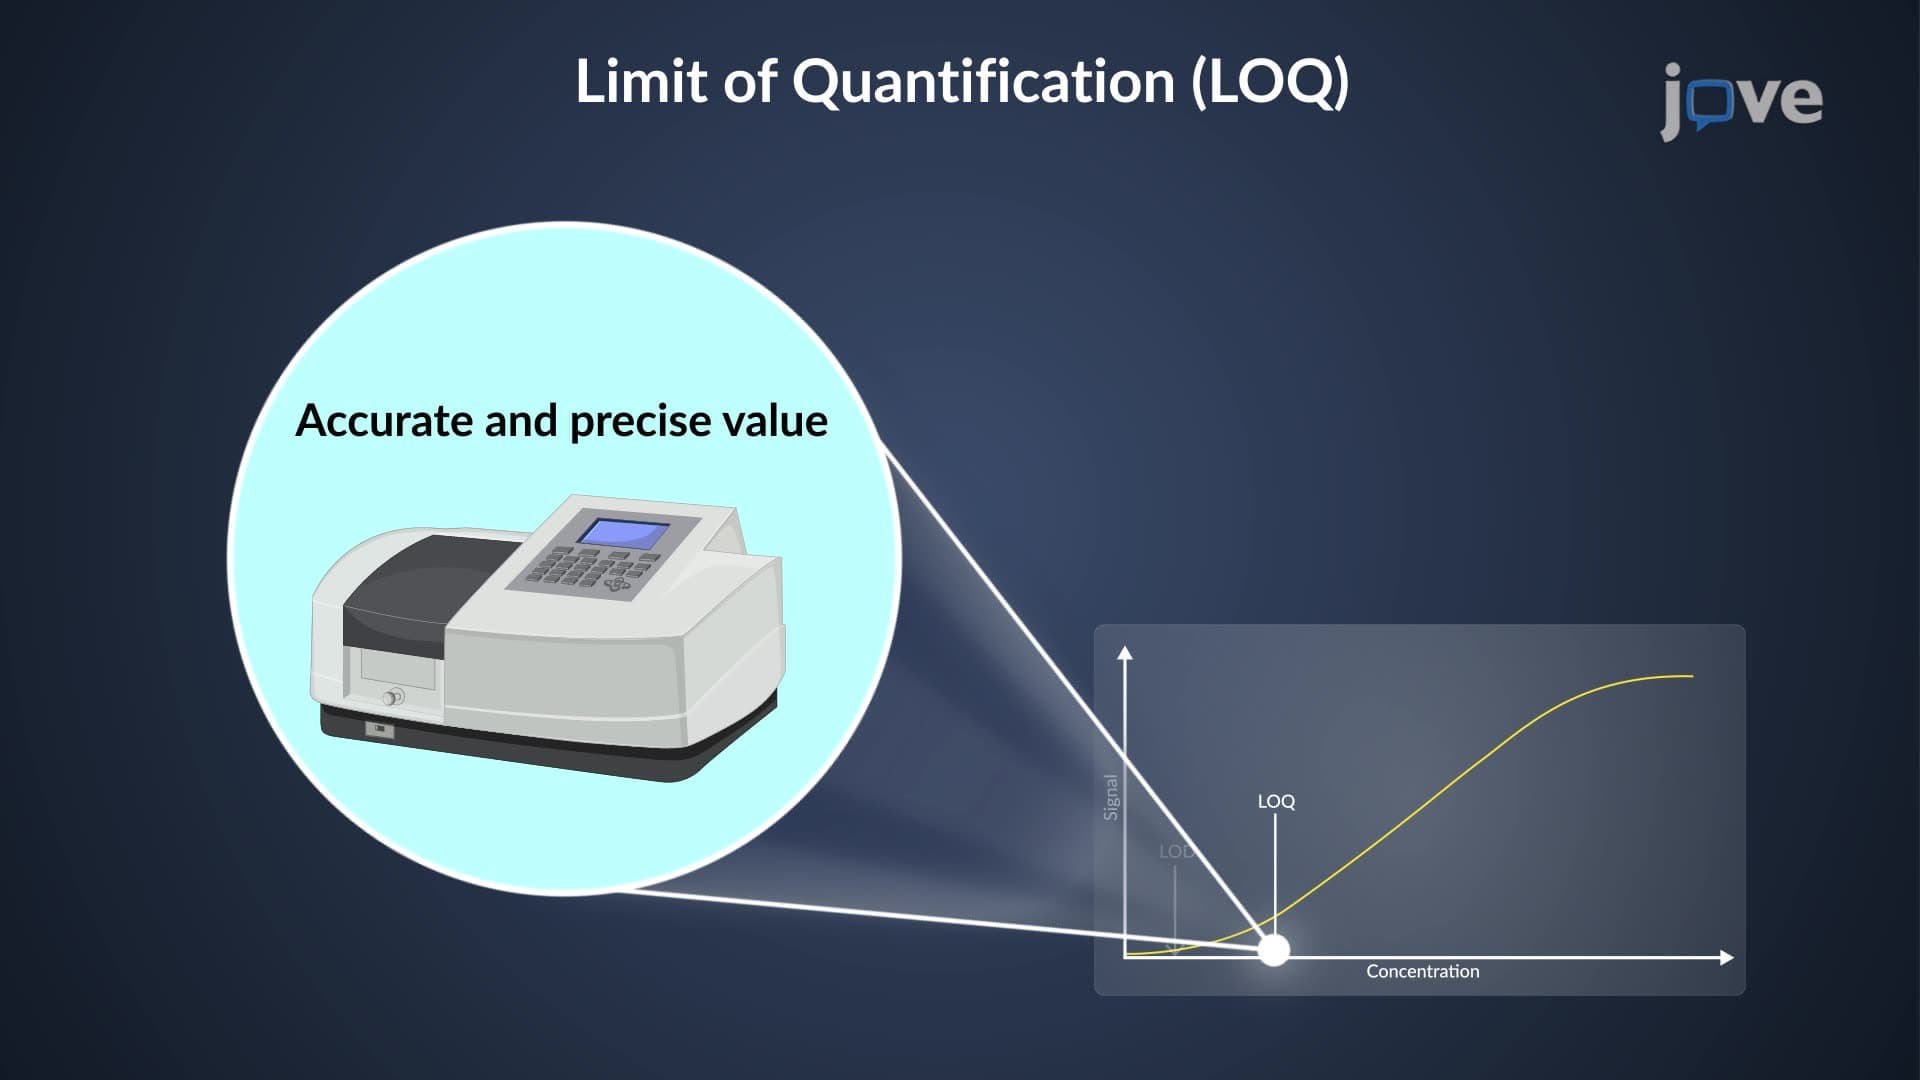
LOD uses 3 times the standard deviation of blanks and represents the minimum detectable amount, while LOQ uses 10 times the standard deviation and represents the minimum accurately quantifiable amount. LOD answers "Is it there?" while LOQ answers "How much is there with acceptable precision?" Both are essential for method validation in analytical chemistry courses and professional laboratories.
EPA-certified laboratories use LOD calculations to ensure their methods can detect pollutants below regulatory limits-for example, detecting lead in drinking water at levels well below the 15 ppb action level. Similarly, FDA labs analyzing food contaminants must demonstrate LODs below safety thresholds, while clinical labs need LODs sensitive enough to detect biomarkers for early disease diagnosis.
Not at all-the concept builds on basic statistics (mean, standard deviation) and algebra that students learn in earlier courses. While the applications are sophisticated, the mathematical principles are accessible to anyone comfortable with calculating averages and understanding calibration curves. Starting with simple examples like measuring salt concentration in water helps students grasp the fundamental ideas.
Focus on understanding the 3-sigma rule conceptually before memorizing formulas, then practice calculating LOD from data sets with blank measurements and calibration curves. Create concept maps connecting LOD to signal-to-noise ratio, method validation, and real-world applications. Work through problems involving different analytical scenarios to build confidence with the mathematical relationships.
Build on LOD by exploring method validation parameters like precision, accuracy, and linearity range, which work together to characterize analytical method performance. Study quality control concepts like control charts and proficiency testing, then advance to more complex topics like matrix effects and method comparison studies used in professional analytical laboratories.
Think of detection as "barely seeing" something (3-sigma for LOD) versus quantification as "measuring accurately" (10-sigma for LOQ)-you need a stronger signal to measure precisely than just to detect presence. The higher multiplier for LOQ reflects the increased confidence needed for accurate quantitative measurements versus simple qualitative detection.
Related Micro-courses

19 Concepts

14 Concepts
17 Concepts