Loading subject page…


104,967 views

Video Summary: Standard Deviation of Calculated Results Explained
Ever wonder why some lab measurements cluster tightly around a value while others scatter wildly? Understanding standard deviation results is crucial for interpreting data reliability in everything from pharmaceutical quality control at companies like Pfizer to environmental testing by the EPA. The Standard Deviation of Calculated Results Explained reveals how this statistical measure quantifies data spread and precision in scientific measurements. Watch the full video on JoVE Coach to master this concept with expert-led visuals and step-by-step explanations.
Standard deviation in chemistry and other sciences serves as a fundamental statistical tool for quantifying how much individual measurements deviate from the average value. When you collect data in laboratory experiments or field studies, understanding this variability is essential for determining the reliability and precision of your results.
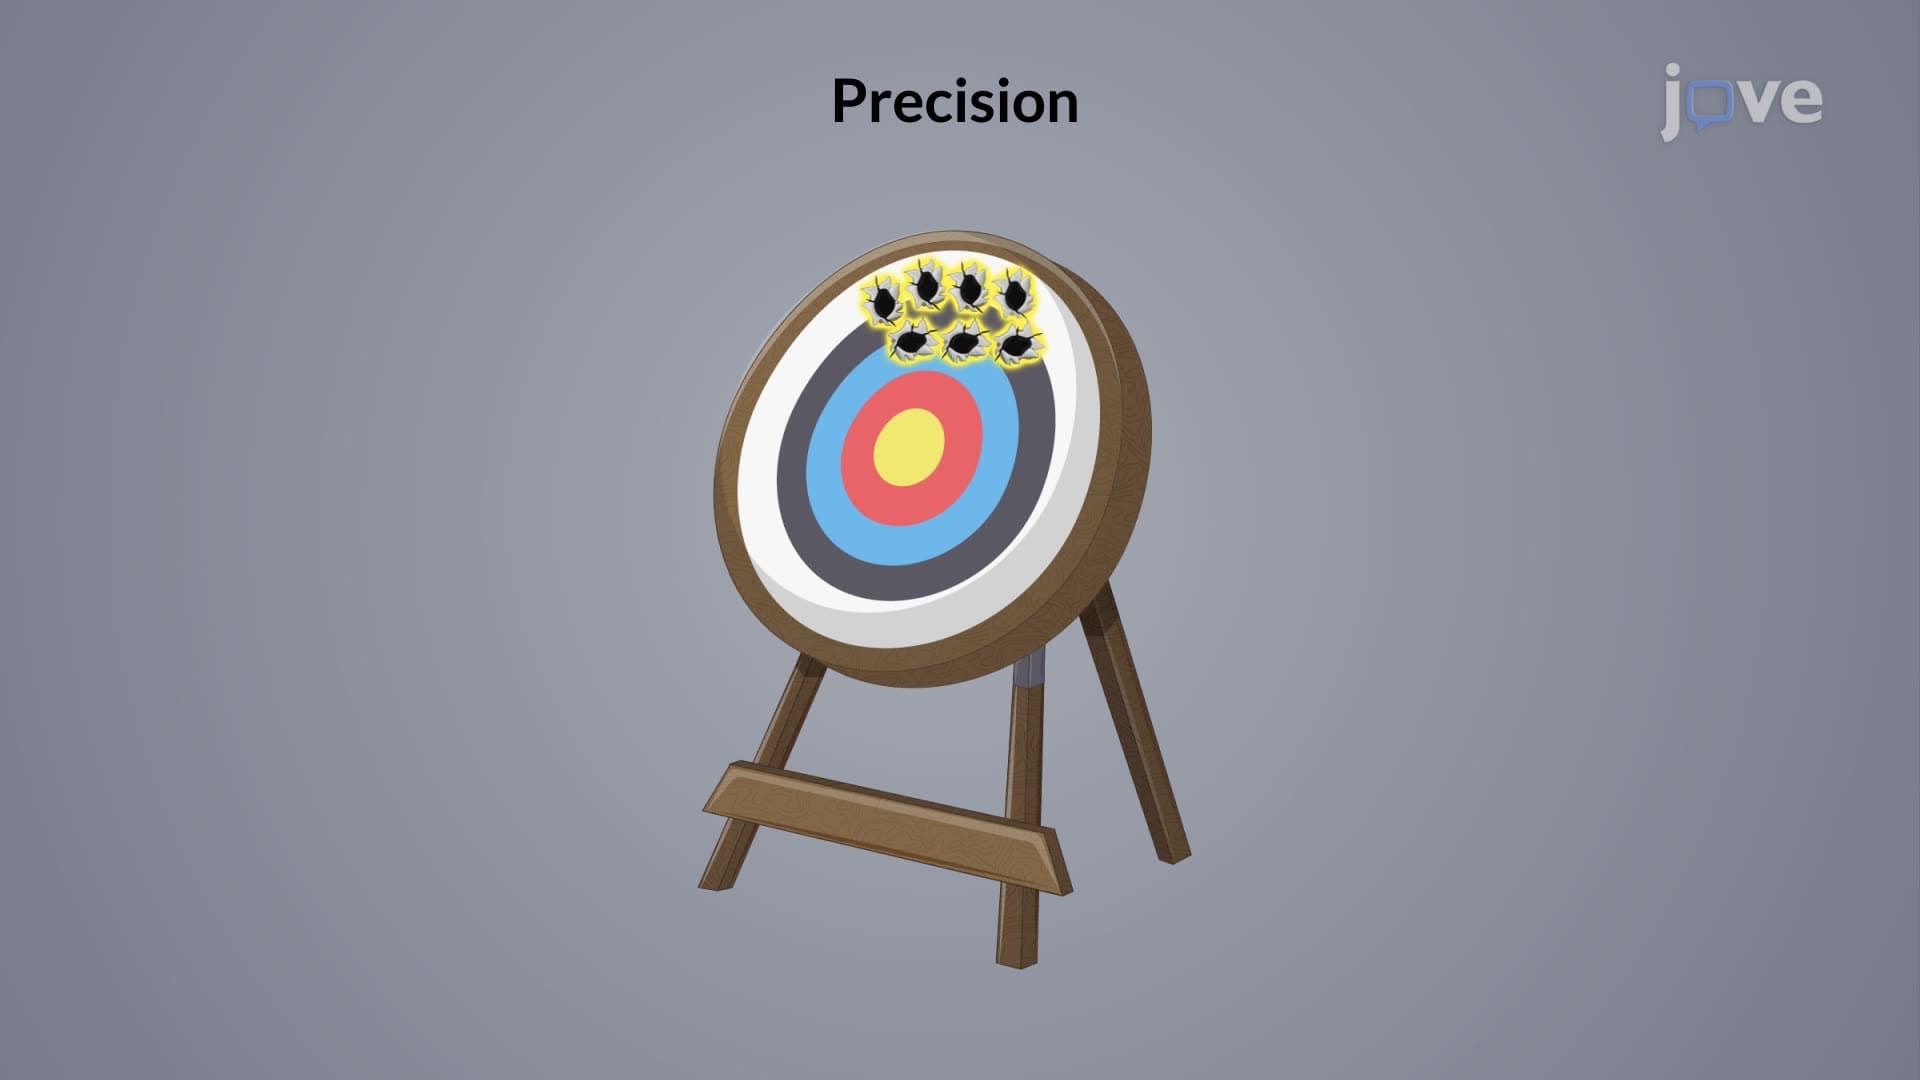
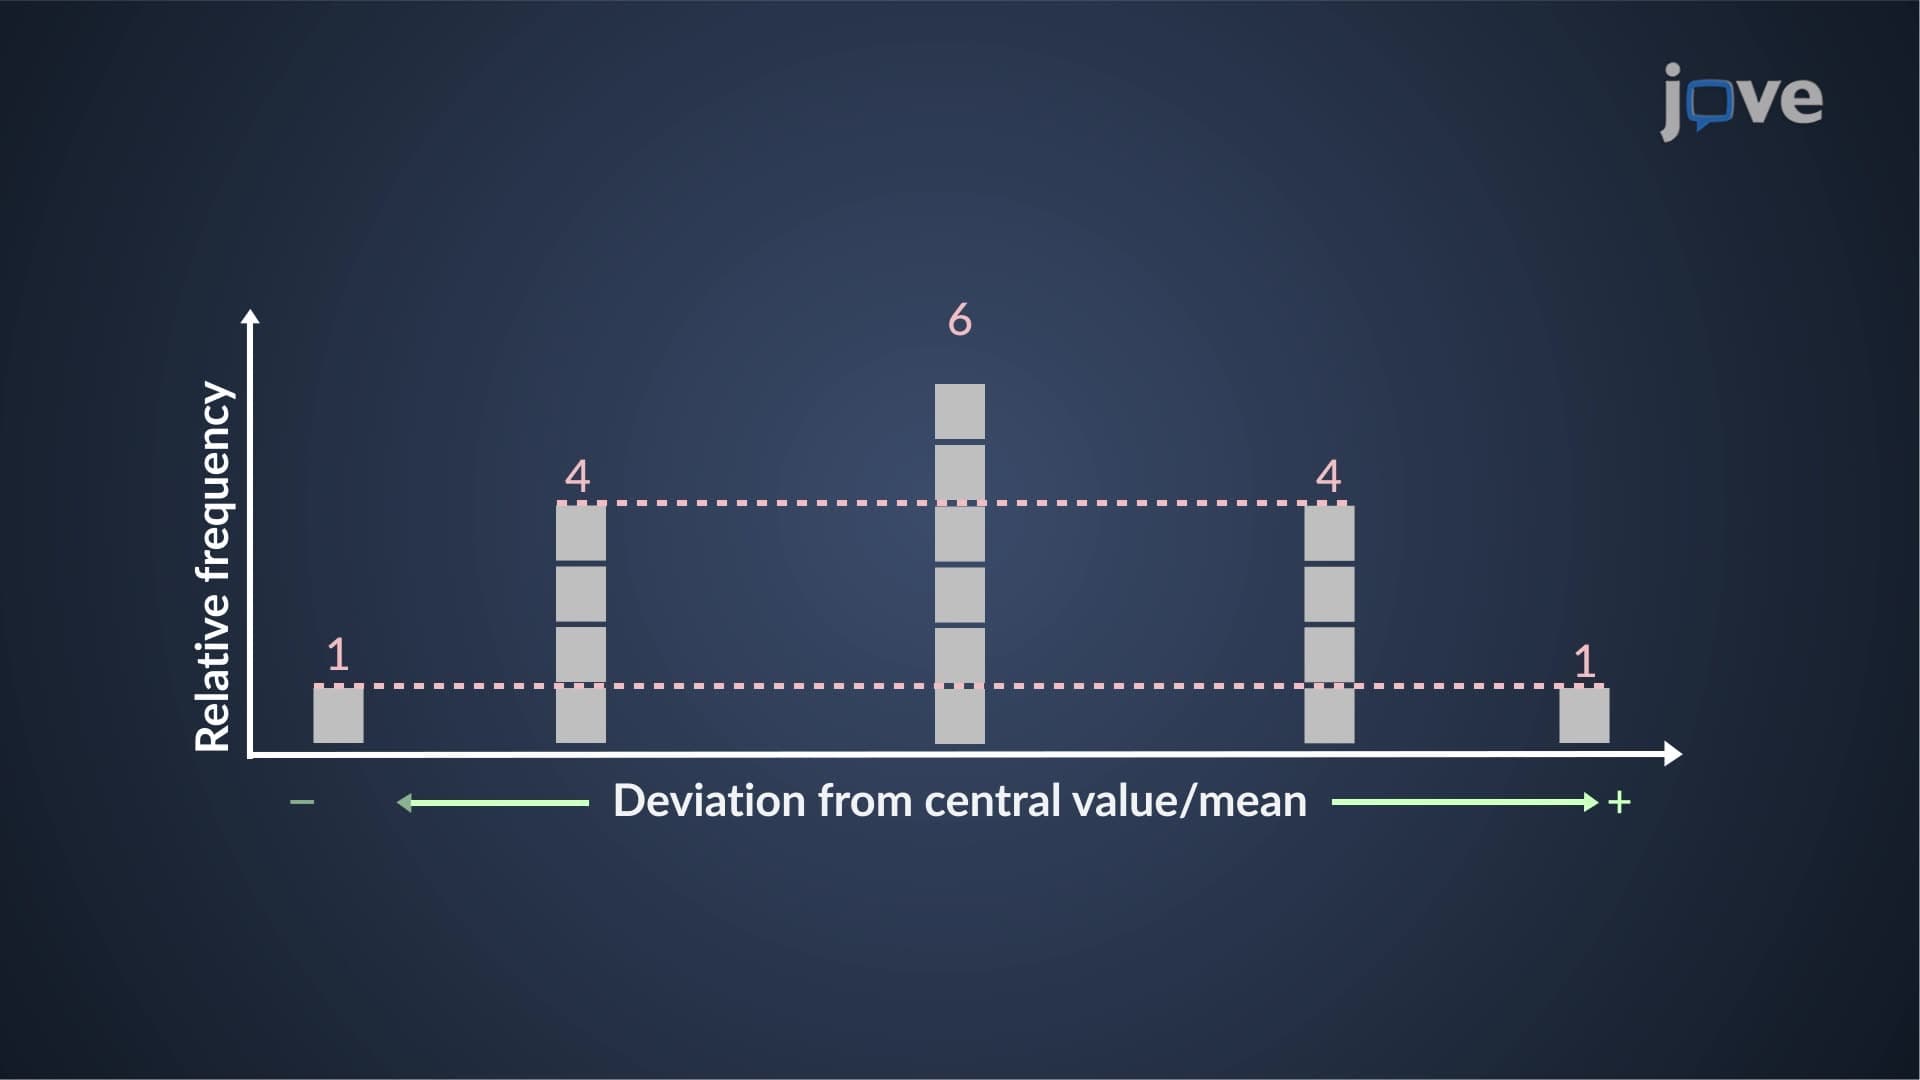
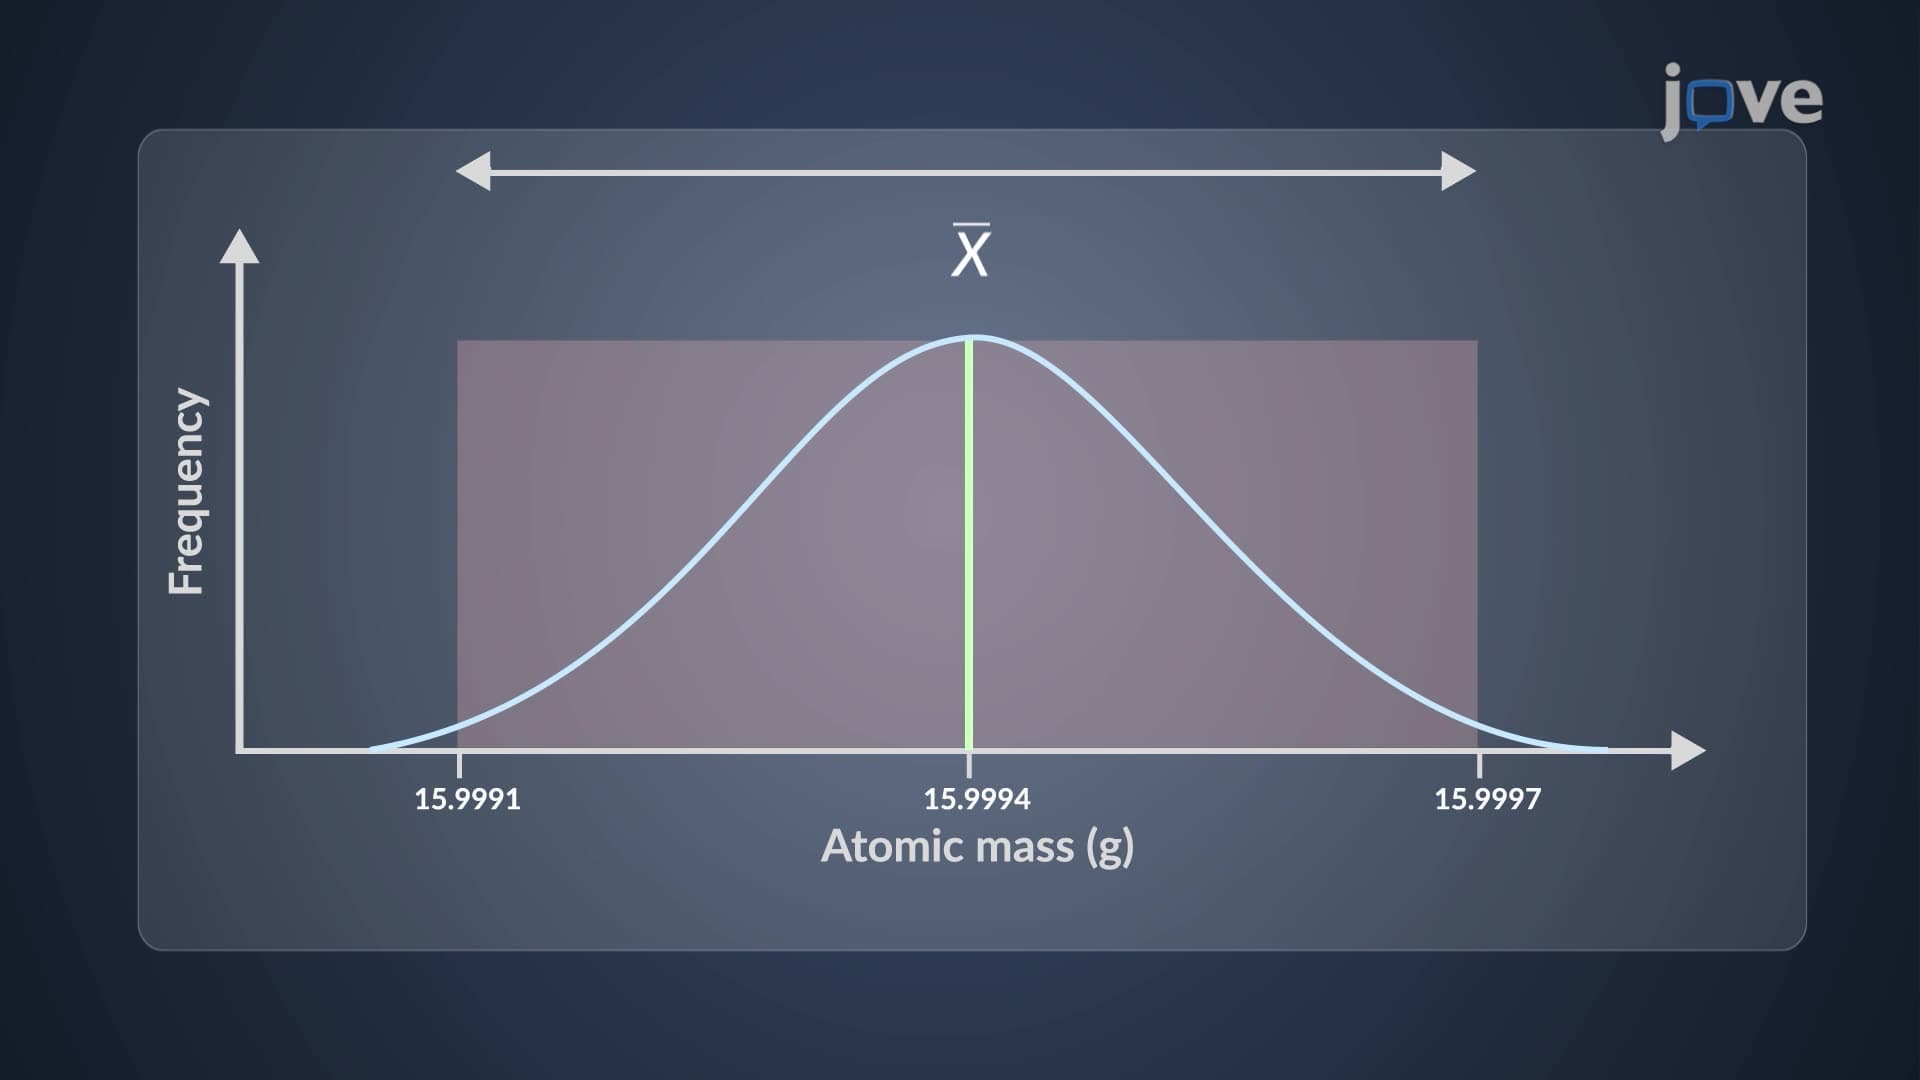
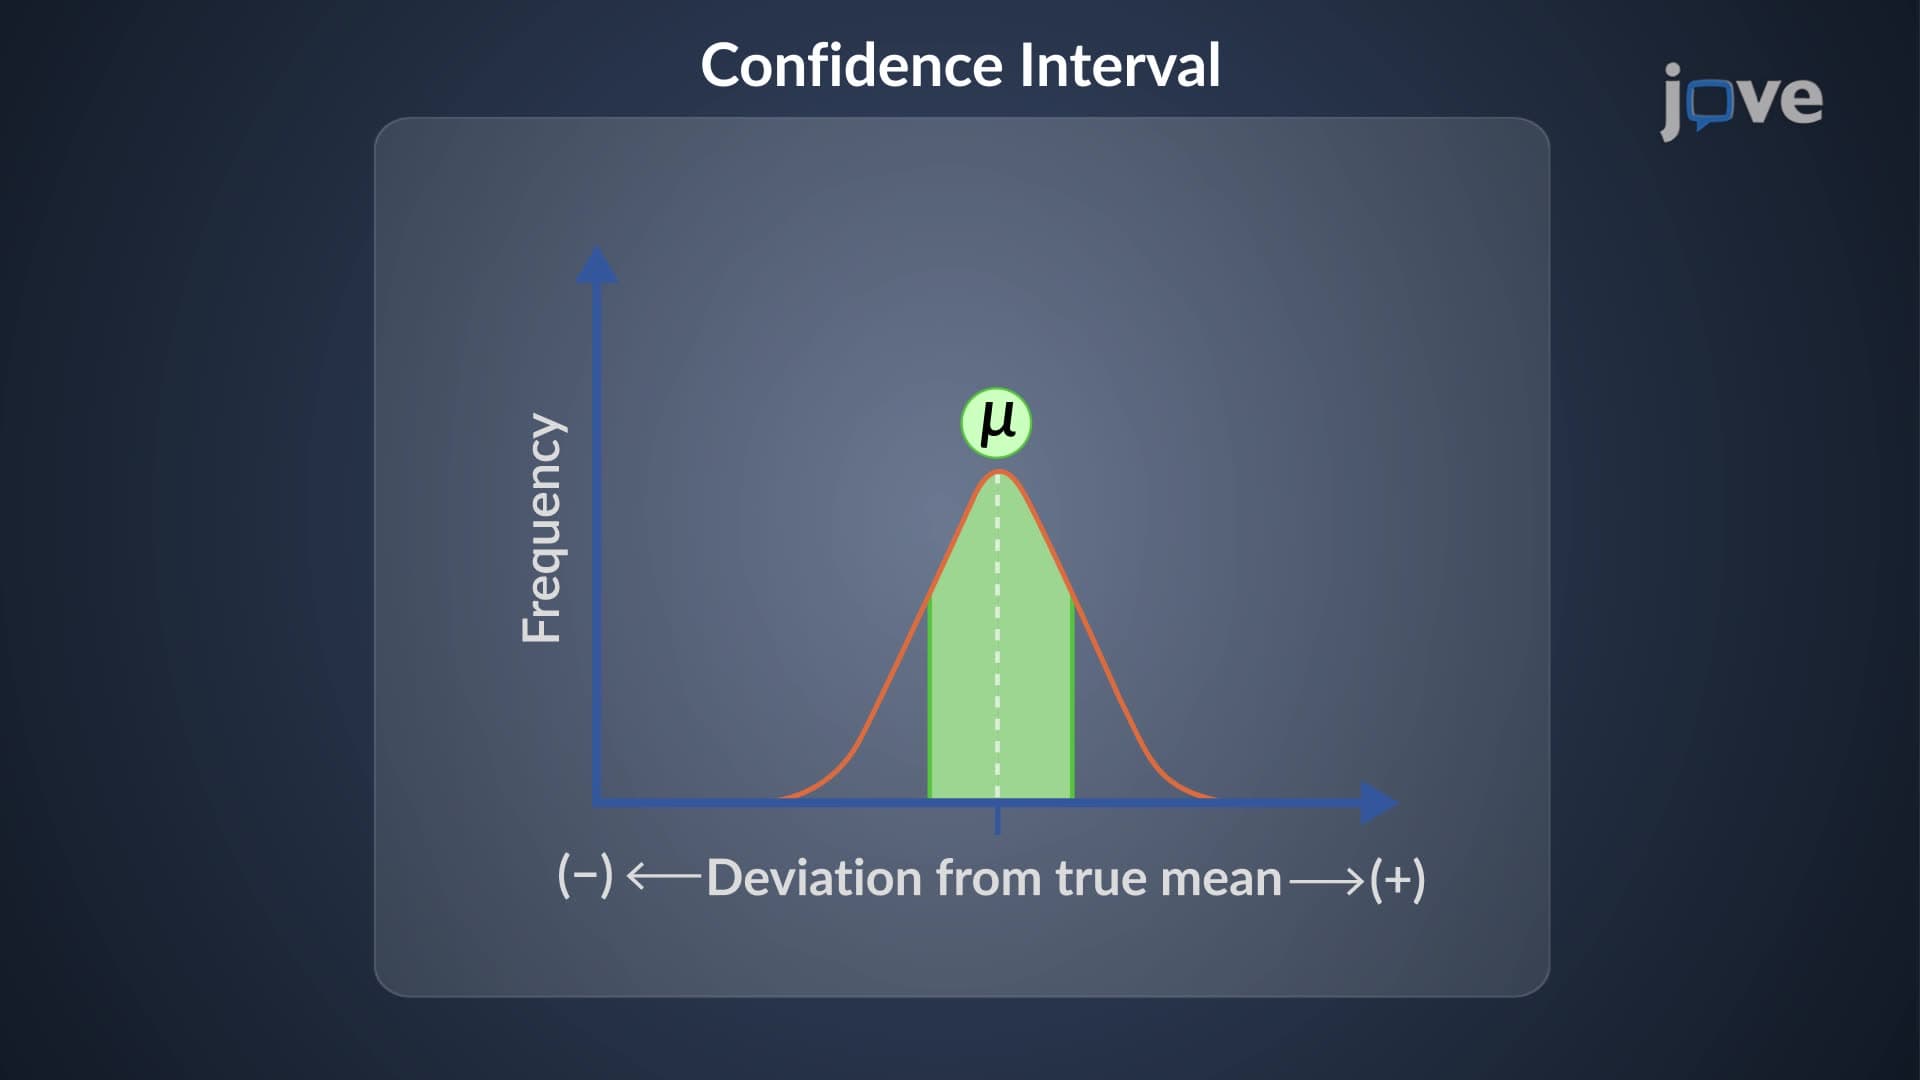
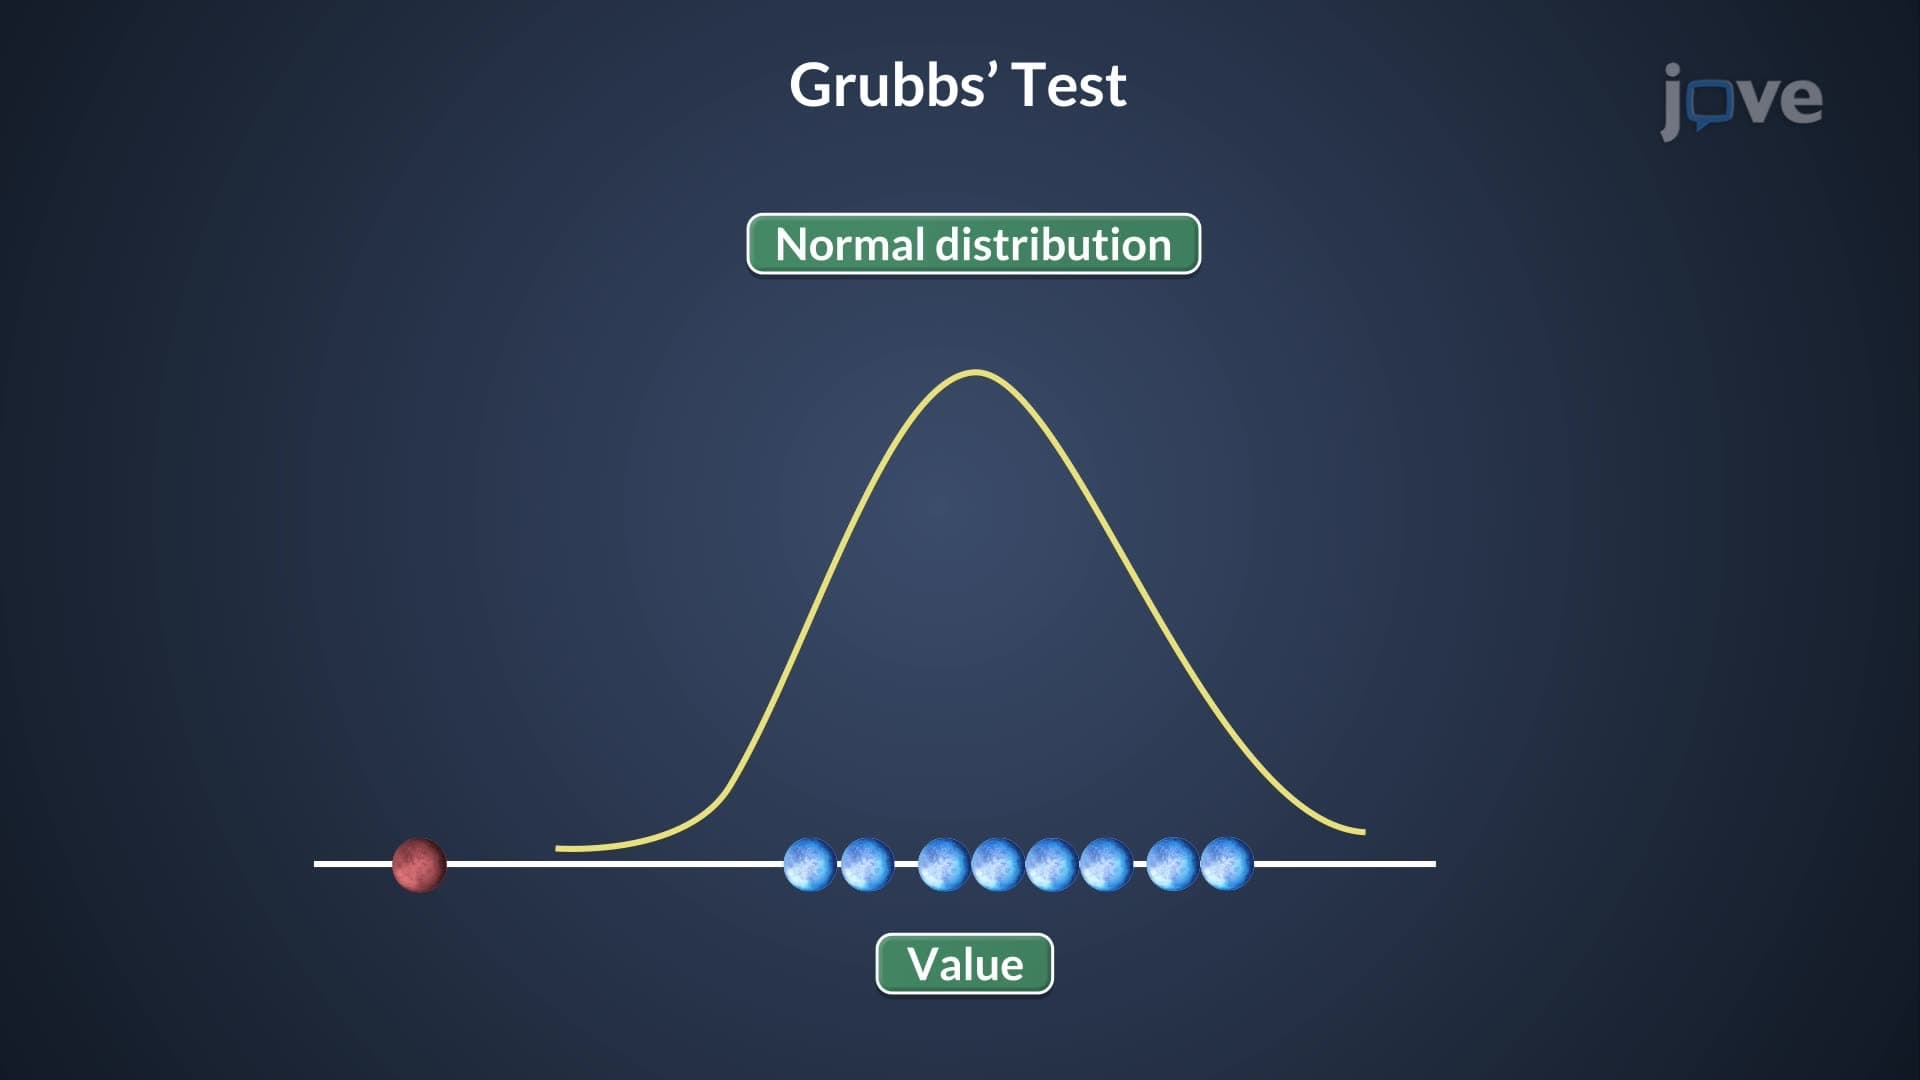
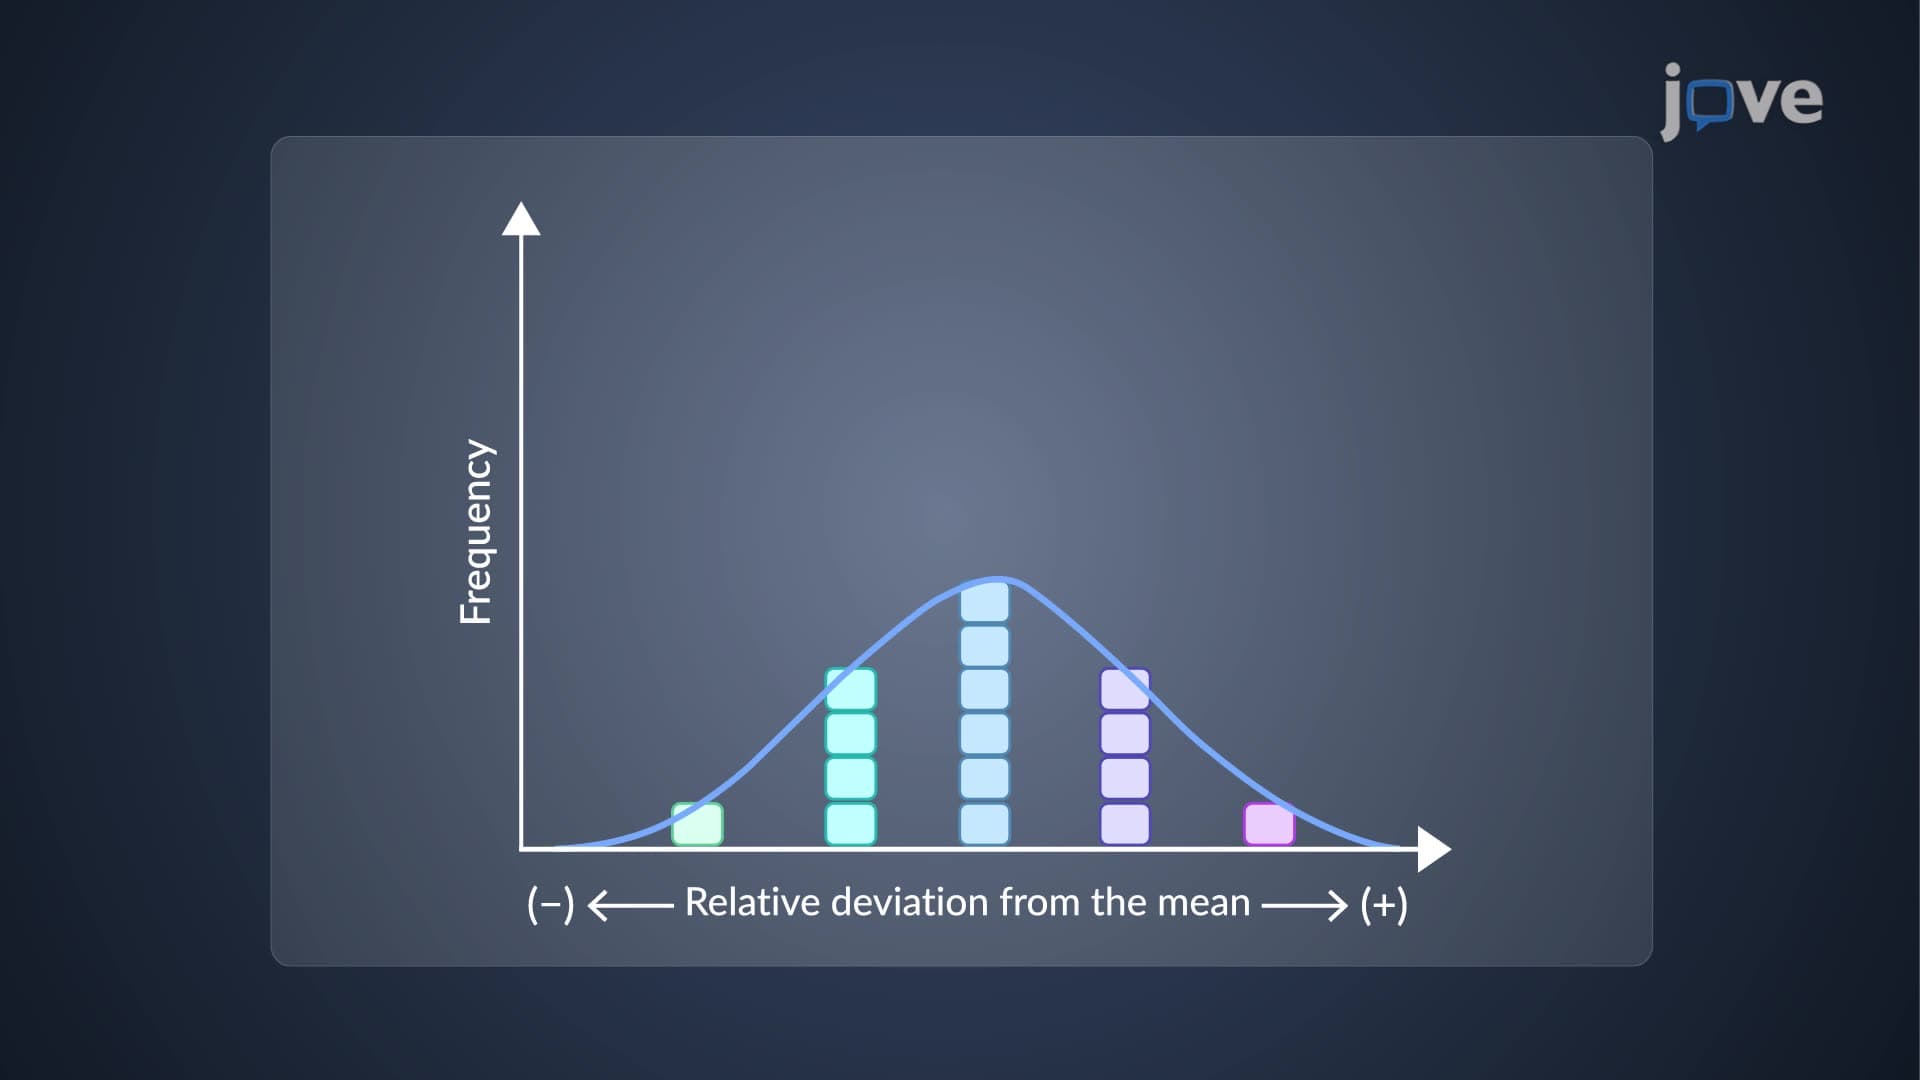
The foundation of standard deviation results lies in the Gaussian (normal) distribution curve. This bell-shaped curve represents how frequently different deviations from the mean occur in a dataset. The width of this curve directly correlates with the standard deviation value-narrower curves indicate smaller standard deviations and higher precision, while wider curves suggest greater variability.
In practical terms, approximately 68% of data points fall within one standard deviation of the mean, 95% within two standard deviations, and 99.7% within three standard deviations. This "68-95-99.7 rule" helps scientists and researchers quickly assess data quality and identify potential outliers.
A crucial distinction exists between population and sample standard deviation calculations. Population standard deviation applies when you have data from an entire population, while sample standard deviation is used for subsets of larger populations-which is more common in real-world scenarios.
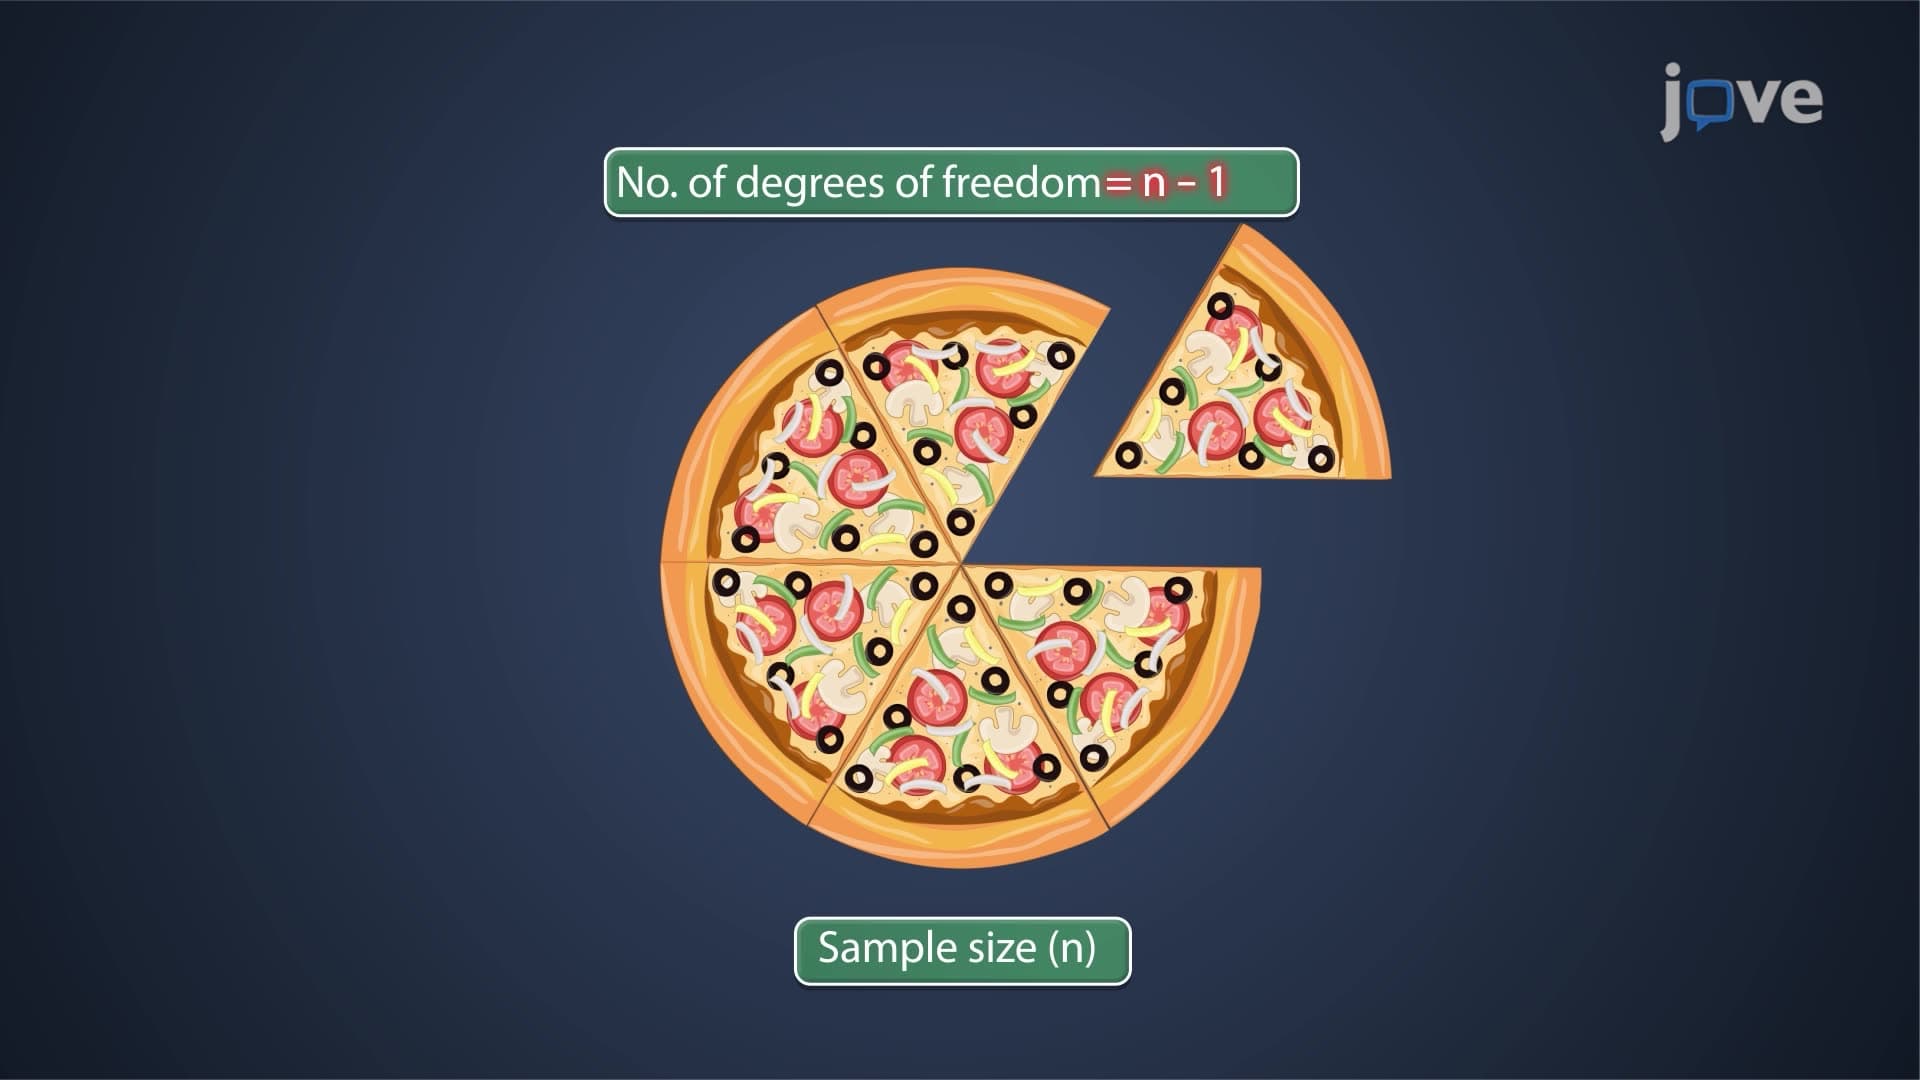
The key difference lies in degrees of freedom. For sample calculations, we use N-1 degrees of freedom instead of N because once you calculate the sample mean, the last data point's deviation becomes predetermined. This adjustment, known as Bessel's correction, provides a more accurate estimate of the true population standard deviation.
The calculation involves several steps: find the mean, calculate each deviation from the mean, square these deviations, find the average of squared deviations (variance), and take the square root. Modern calculators and software handle these computations, but understanding the process helps interpret results meaningfully.
Relative standard deviation (RSD) and coefficient of variation (CV) express standard deviation as a percentage of the mean, making it easier to compare variability across different scales of measurement. For instance, pharmaceutical companies use RSD to ensure drug potency consistency, while environmental agencies apply it to assess pollutant measurement reliability.
This statistical concept appears frequently on AP Chemistry exams, college statistics courses, and standardized tests like the MCAT, where students must interpret experimental data and assess measurement precision.
Related Micro-courses