Loading subject page…


104,967 views
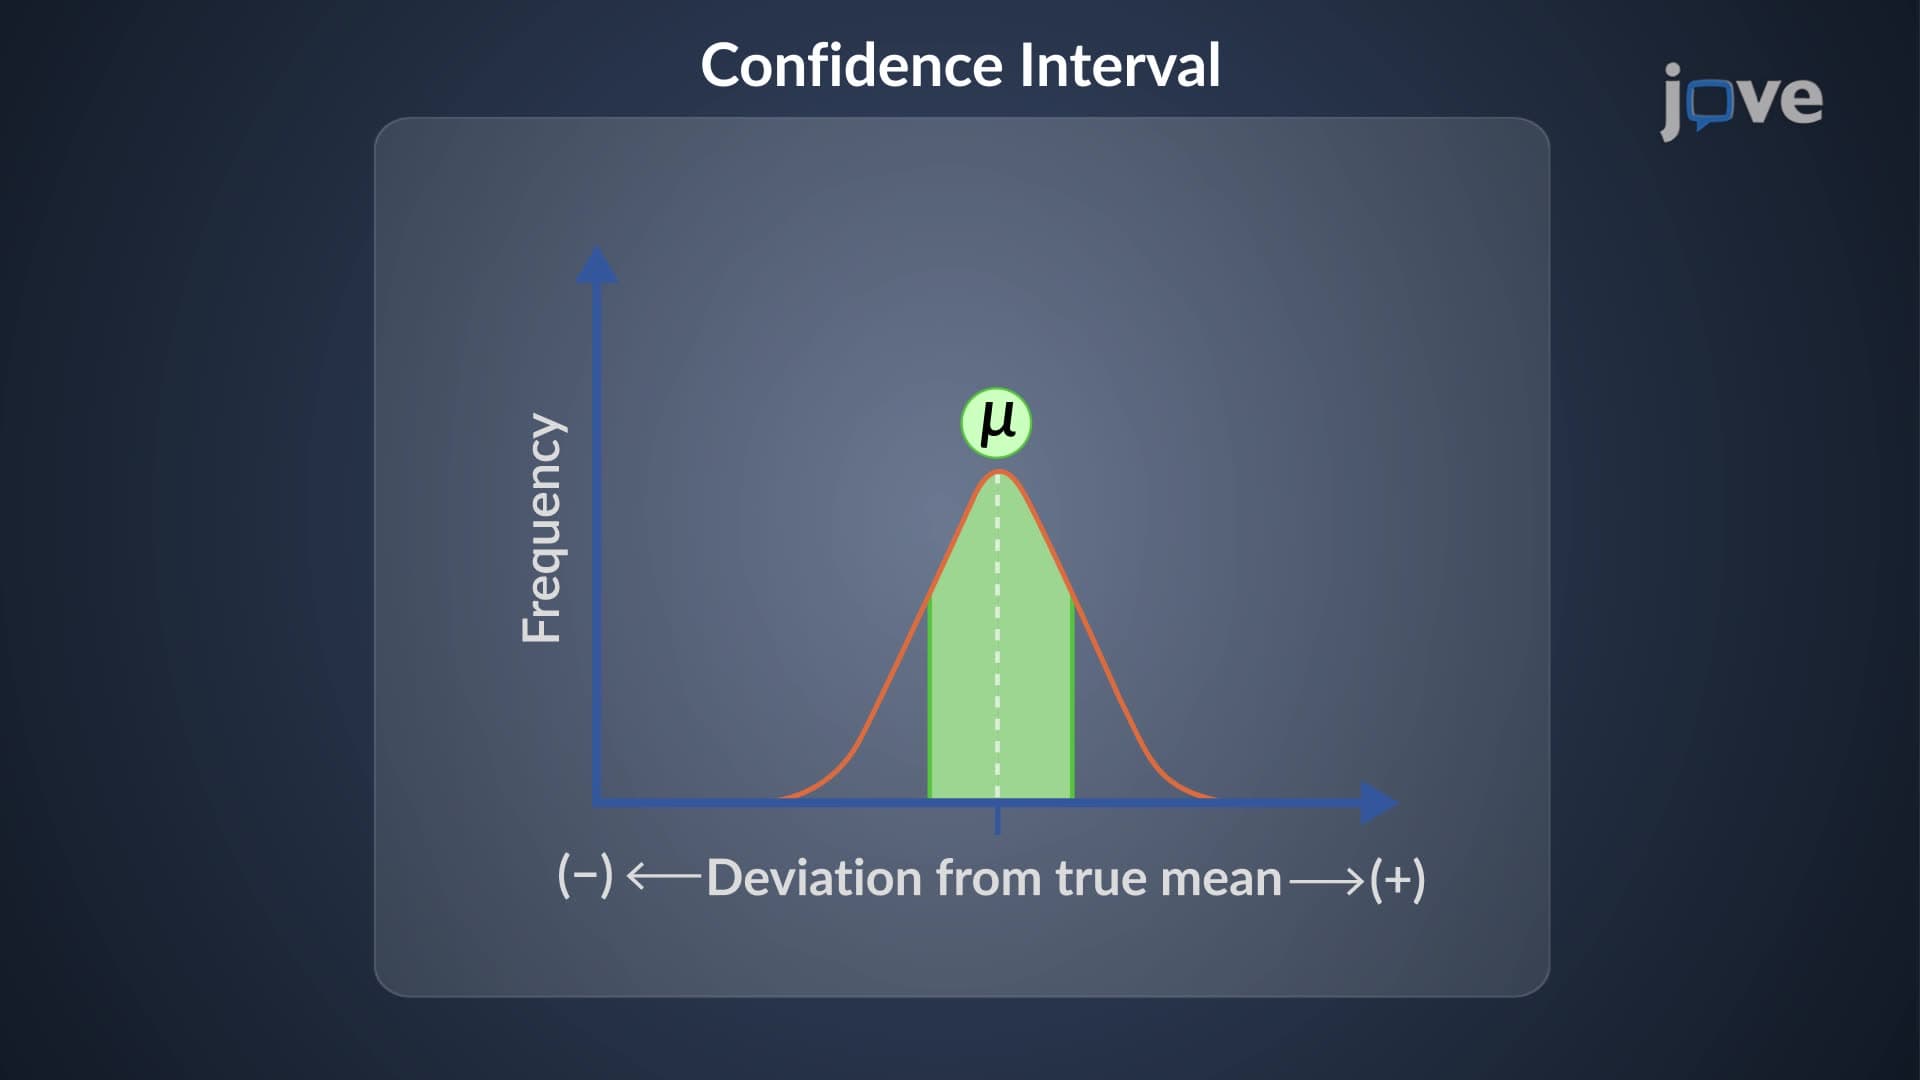

Video Summary: What are Uncertainty Confidence Intervals
Uncertainty confidence intervals reveal how close your sample data actually gets you to the true population value-a critical concept when NASA engineers calculate rocket trajectory margins or pharmaceutical companies determine drug dosage safety ranges. When working with limited measurements in chemistry labs or physics experiments, confidence intervals in measurement provide a statistically computed range where the true mean likely falls within a specified probability. This approach helps students understand measurement reliability beyond simple standard deviation calculations. Watch the full video on JoVE Coach to master this concept with expert-led visuals and step-by-step explanations.
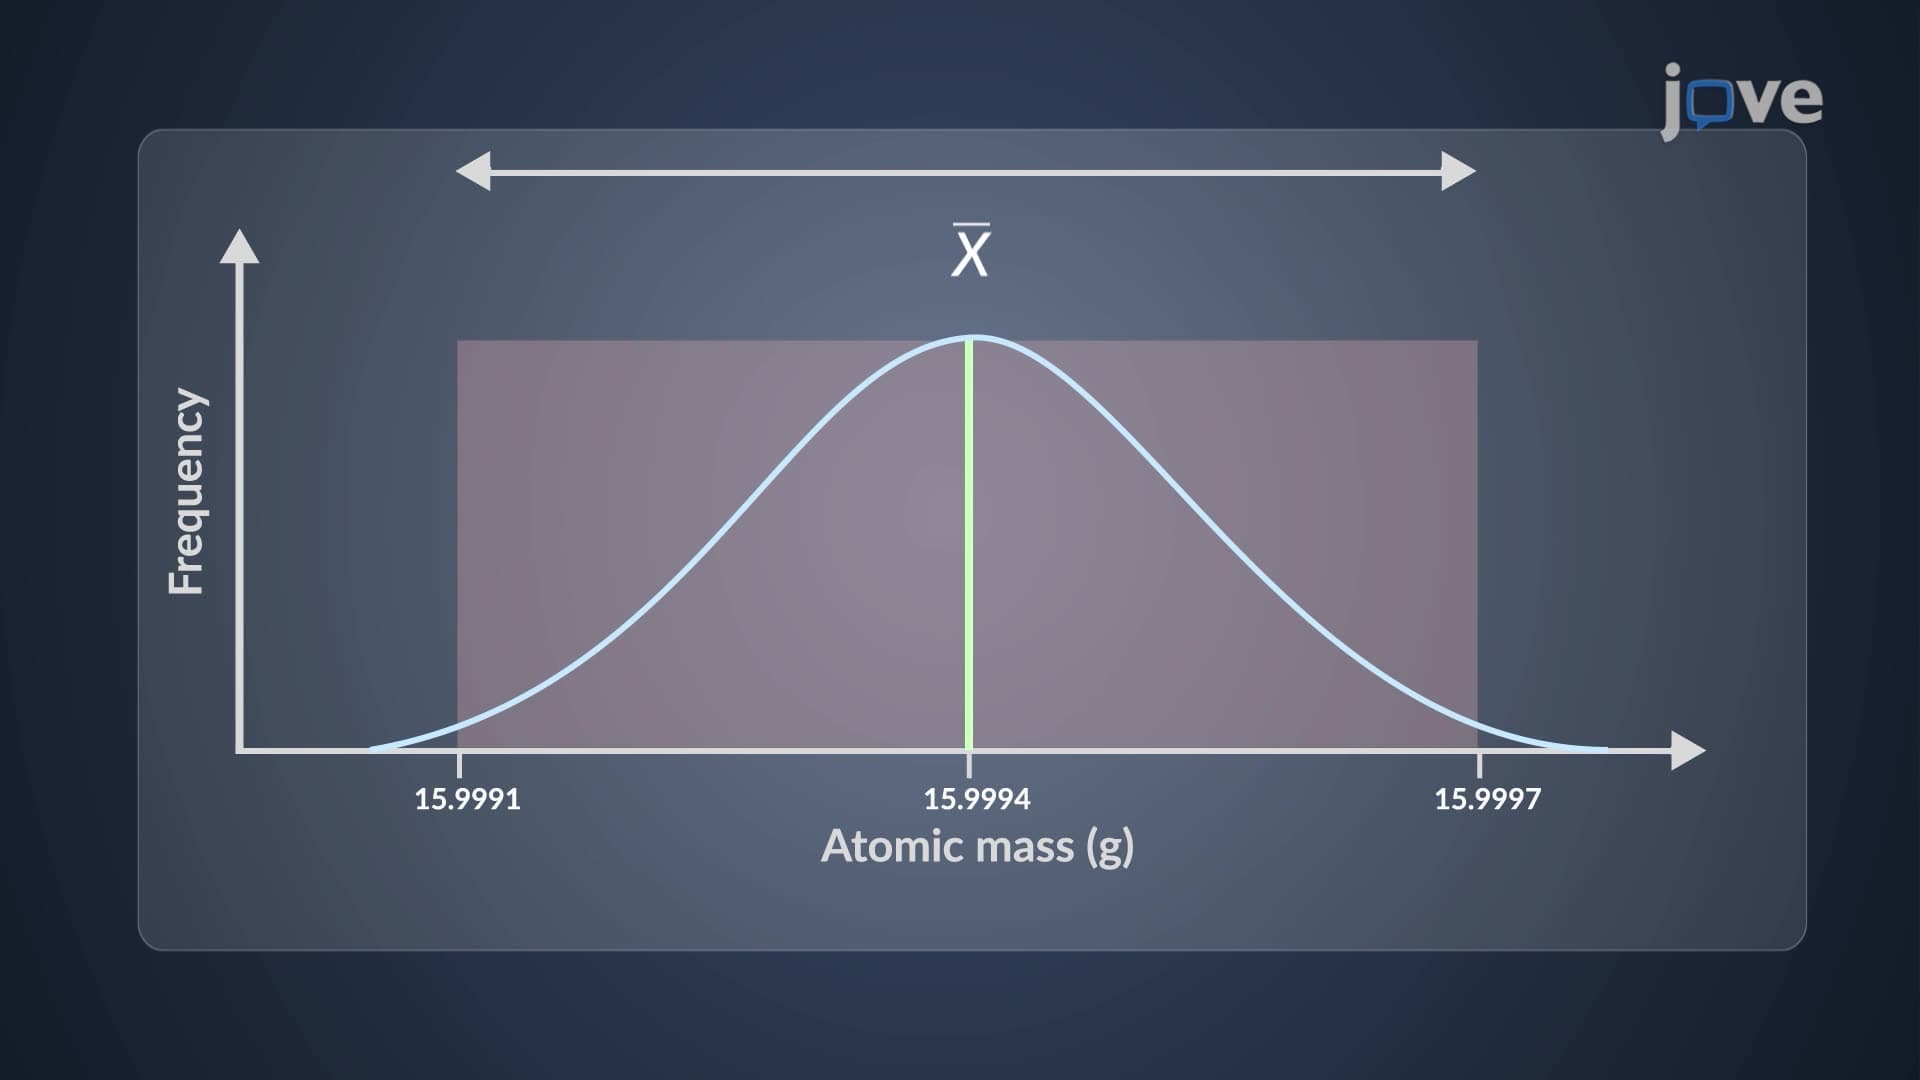
Uncertainty confidence intervals bridge the gap between what we can measure and what we need to know about true population values. Unlike standard deviation, which describes data spread, confidence intervals estimate where the true mean likely exists based on limited sample data-a distinction crucial for AP Chemistry students analyzing titration results or college physics majors measuring gravitational acceleration.
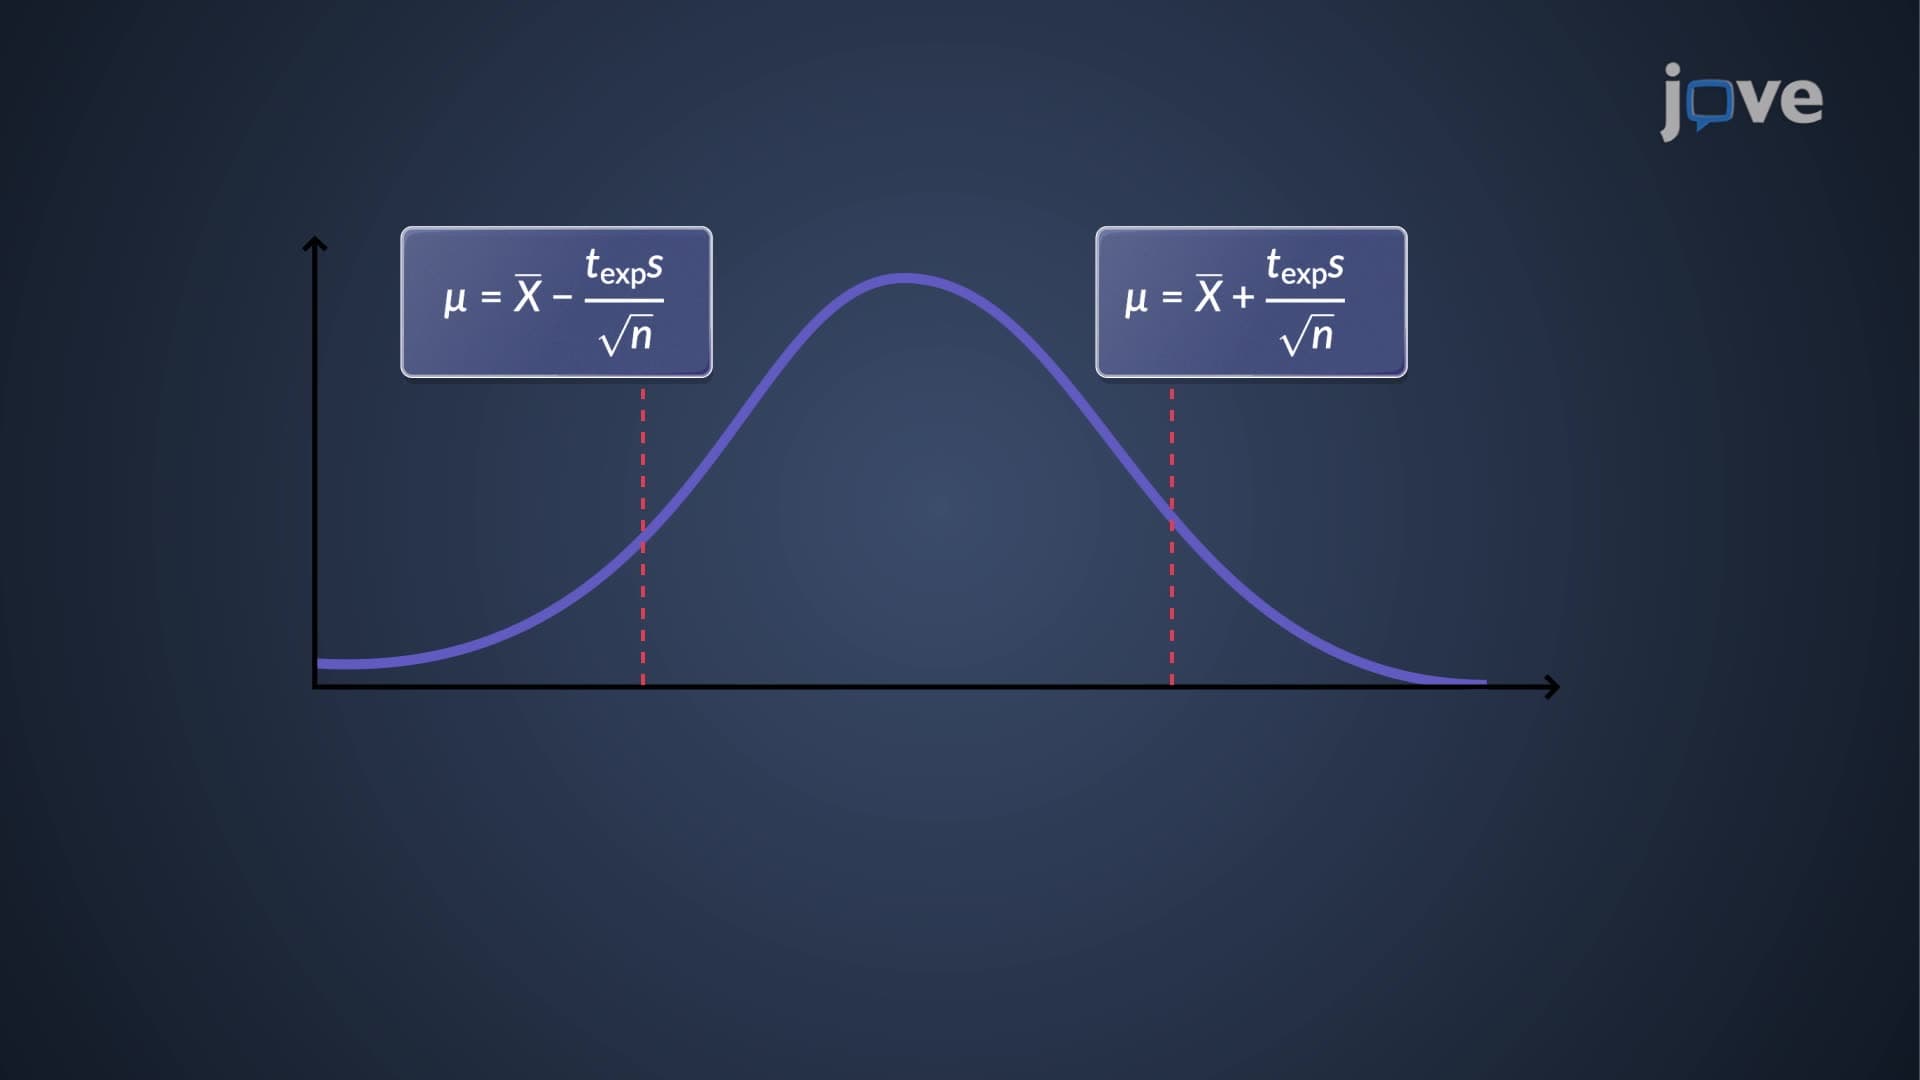
The mathematical framework involves four key components working together. Your sample mean provides the center point, while sample standard deviation indicates variability. The critical t-value (from Student's t-distribution) adjusts for small sample sizes, and your chosen confidence level (typically 95%) determines the probability range. The formula simplifies to: Confidence Interval = Sample Mean ± (t-value × Standard Error).
This approach proves invaluable when analyzing limited data sets common in undergraduate laboratory courses. For instance, if you're measuring the pH of buffer solutions with only 8 trials, confidence intervals provide more reliable estimates than assuming your sample mean equals the true population mean.
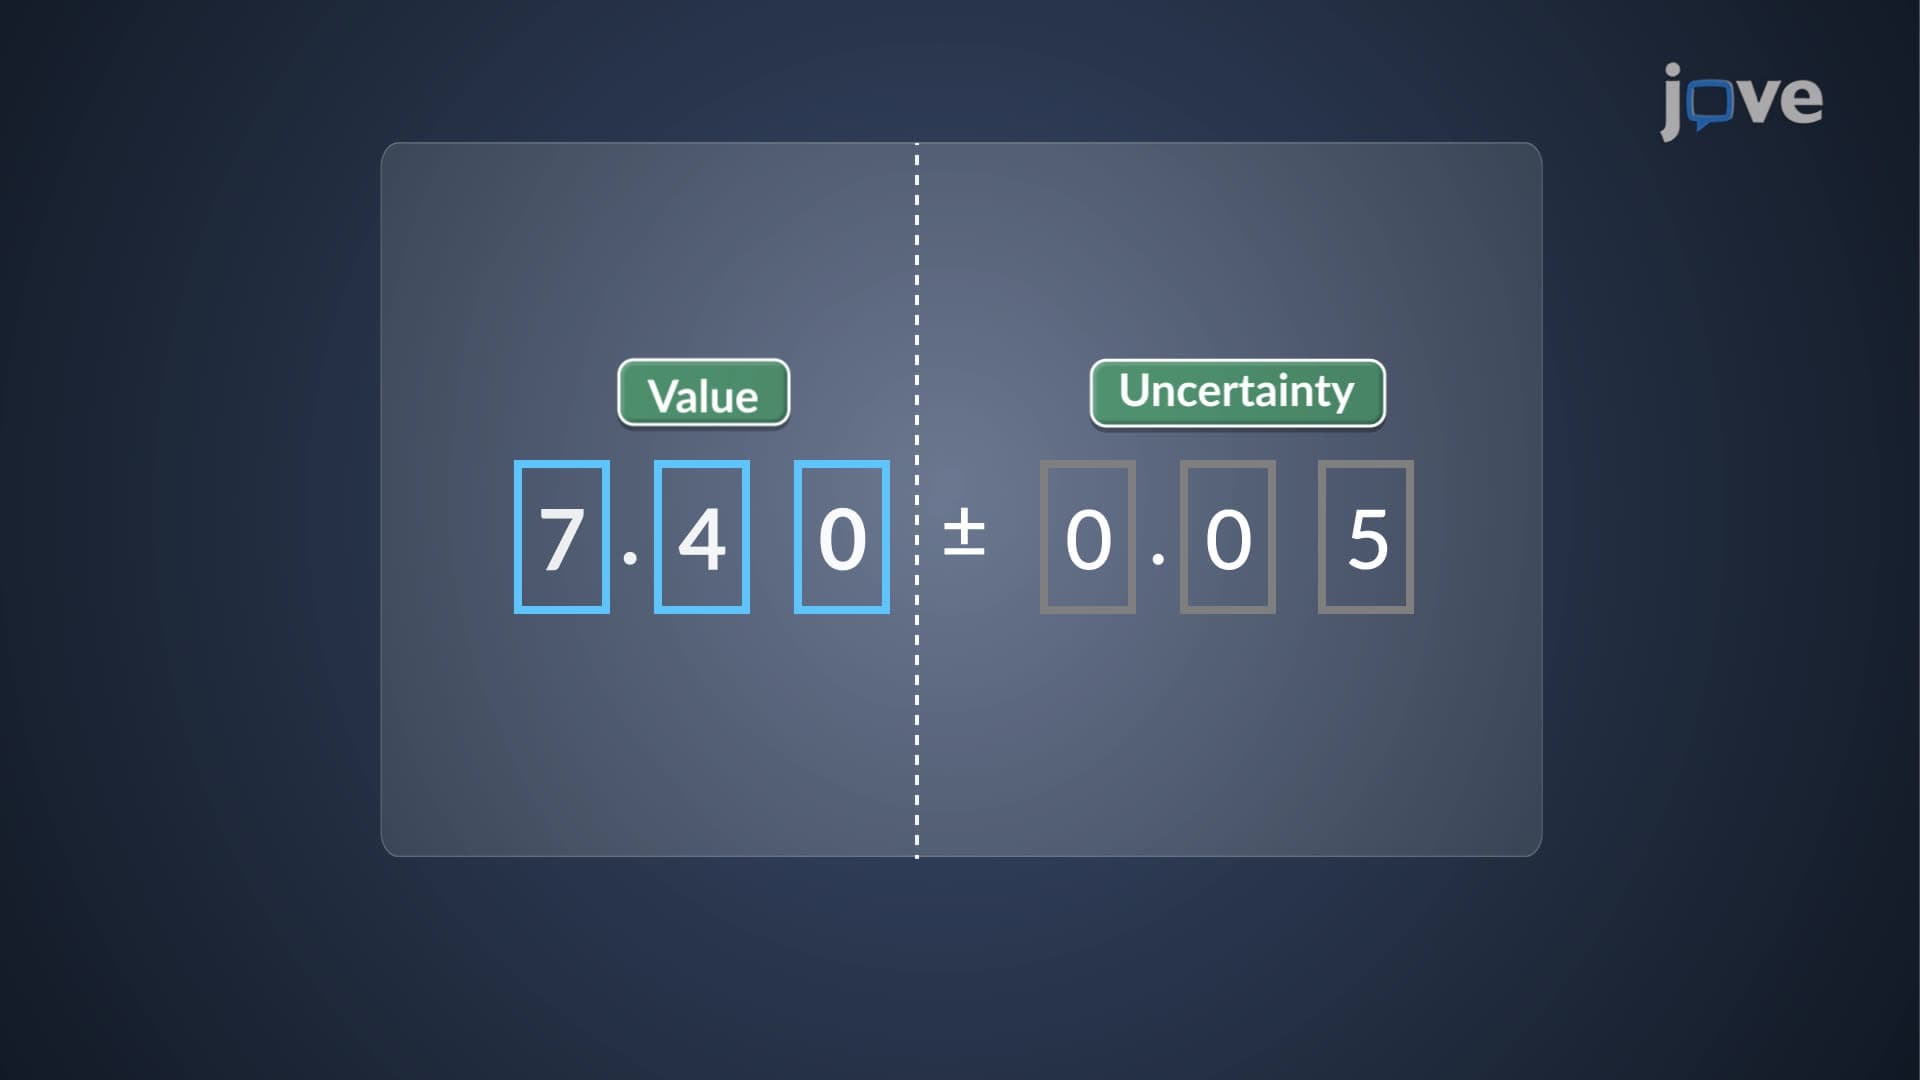
Confidence intervals in measurement appear frequently across STEM disciplines. Chemistry students use them when reporting analytical results-stating "the concentration is 0.245 ± 0.012 M with 95% confidence" demonstrates statistical literacy expected on AP exams. Physics majors apply confidence intervals when measuring constants like specific heat or Young's modulus, while pre-med students encounter them in biostatistics courses preparing for MCAT statistical reasoning sections.
Professional applications span quality control in manufacturing (ensuring pharmaceutical tablets contain proper drug concentrations), environmental monitoring (determining pollution levels in water supplies), and clinical research (establishing safe dosage ranges for new medications).
Begin by collecting your measurement data and calculating the sample mean and standard deviation. Next, determine your degrees of freedom (n-1) and select your confidence level. Look up the corresponding t-value from statistical tables-most college statistics textbooks include these, and they're provided on AP Statistics exams.
Calculate the standard error by dividing your sample standard deviation by the square root of sample size. Multiply this by your t-value to get the margin of error. Finally, add and subtract this margin from your sample mean to establish your confidence interval bounds.
As sample sizes increase beyond 30 measurements, confidence intervals narrow significantly, reflecting increased precision-a principle that explains why large-scale studies provide more reliable conclusions than small pilot studies.
Related Micro-courses