Loading subject page…


104,969 views


Video Summary: What are Z Scores
Ever wonder how a 6'2" basketball player compares to teammates versus how their SAT math score of 650 stacks up nationally? Z scores explained through standardization makes these completely different measurements comparable by converting them into standard deviations from their respective means. This statistical Z value transforms raw data into a universal scale, allowing students to understand exactly where any measurement falls within its distribution. Watch the full video on JoVE Coach to master this concept with expert-led visuals and step-by-step explanations.
Z scores explained simply: they're your statistical GPS coordinates. Just as GPS tells you exactly where you are relative to any location on Earth, a Z score tells you exactly where your data point sits relative to the average in any dataset. This standardization transforms raw measurements into a universal language that statisticians and researchers use worldwide.
The Z score formula operates on a beautifully simple principle: Z = (X - μ) / σ for populations, where X is your value, μ (mu) is the mean, and σ (sigma) is the standard deviation. For samples, we use Z = (X - x̄) / s, where x̄ represents the sample mean and s the sample standard deviation. This data standardization method creates a common scale where every dataset speaks the same mathematical language.
Consider a high school student applying to colleges. Sarah scored 1420 on the SAT (national mean: 1051, standard deviation: 211) and has a GPA of 3.8 (school mean: 3.2, standard deviation: 0.4). Her SAT Z score is (1420-1051)/211 = 1.75, while her GPA Z score is (3.8-3.2)/0.4 = 1.5. Both scores are impressive, but the SAT performance is relatively stronger-impossible to determine without standardization.
In chemistry labs across American universities, students frequently use how to calculate Z score chemistry when analyzing experimental results. If a student measures the boiling point of ethanol as 79.2°C while the class average is 78.1°C with a standard deviation of 0.8°C, their Z score of 1.375 indicates their measurement is above average, potentially due to atmospheric pressure variations or measurement precision.
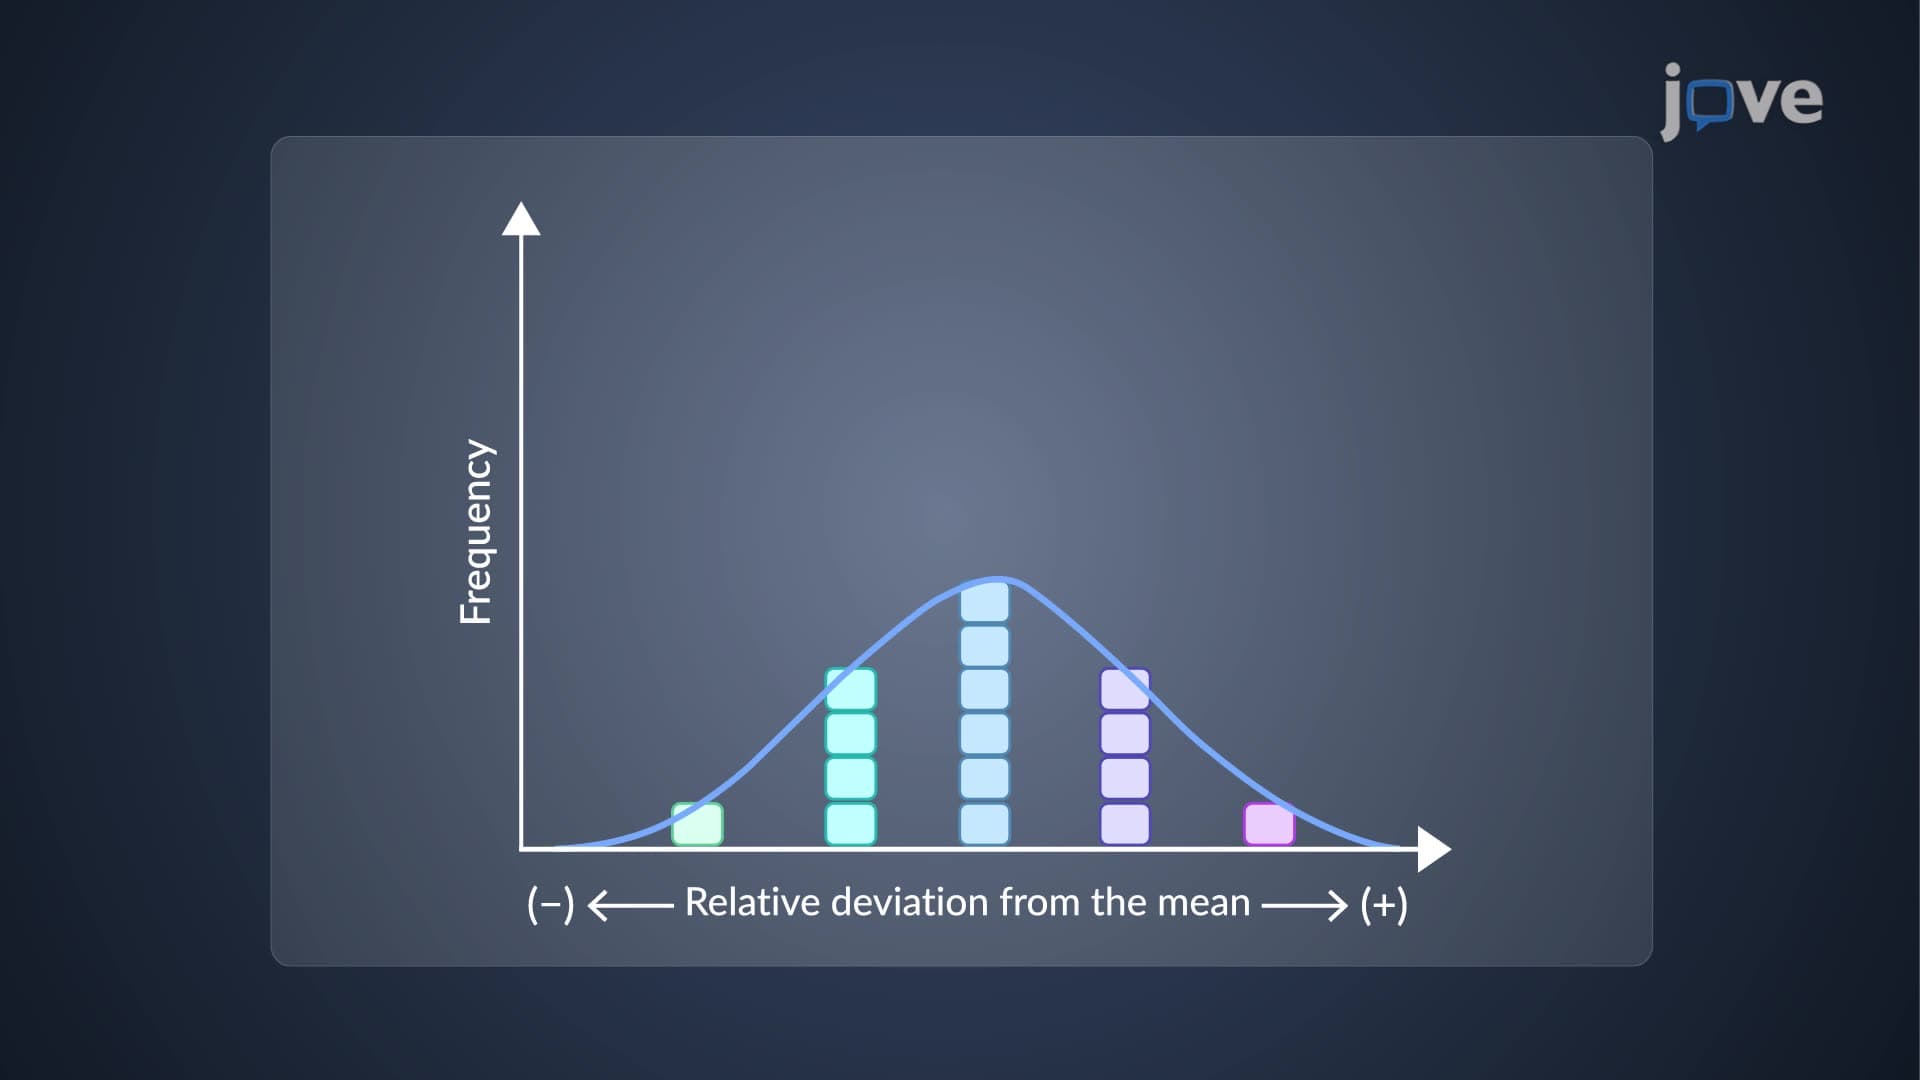
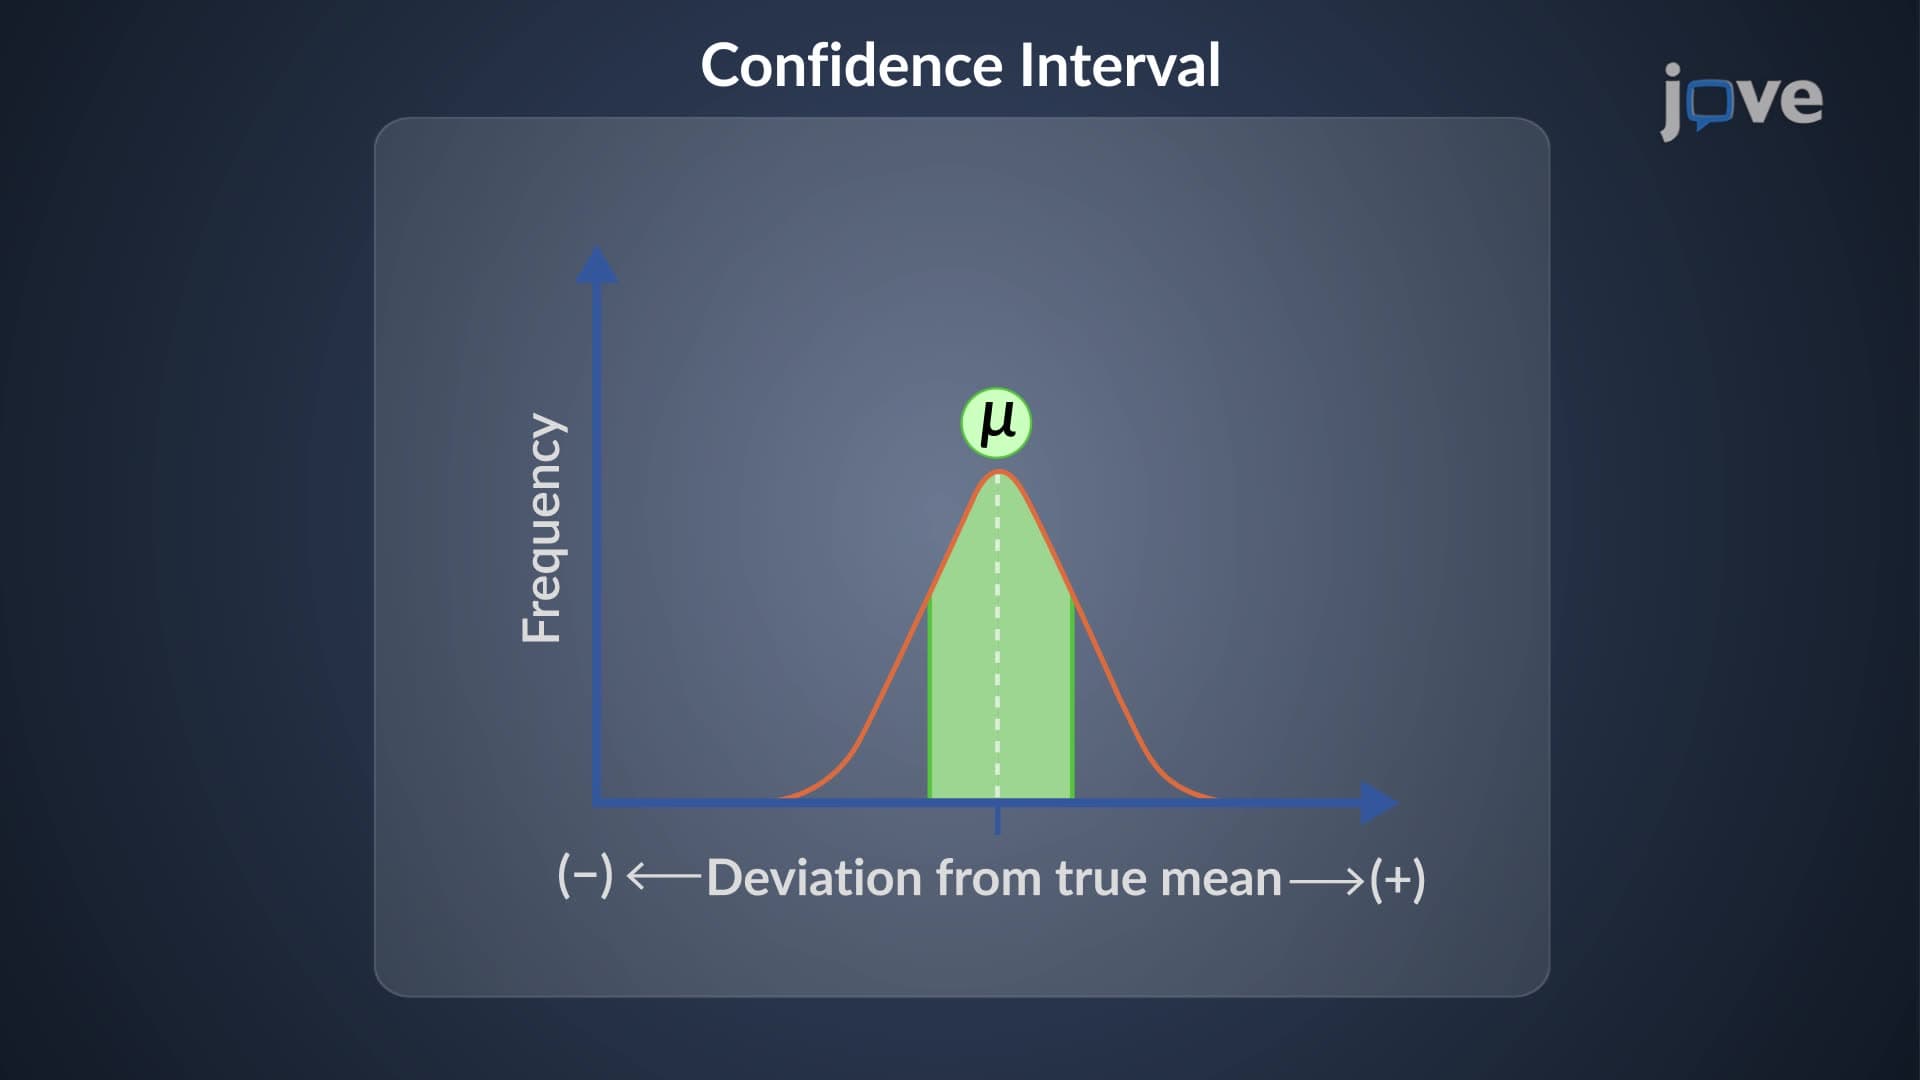
The standard normal distribution forms the backbone of Z score interpretation. This bell-shaped curve, with mean 0 and standard deviation 1, becomes your reference map. Approximately 68% of all Z scores fall between -1 and +1, 95% between -2 and +2, and 99.7% between -3 and +3. These percentages appear constantly on AP Statistics exams and college statistics courses.
Z score in statistics proves invaluable for standardized testing analysis. The MCAT, LSAT, and GRE all rely on scaled scoring systems that essentially function as Z scores. Understanding this concept helps pre-med students interpret their MCAT scores relative to medical school admission requirements, or helps psychology majors understand their GRE performance for graduate school applications.
Related Micro-courses