Loading subject page…

- Analytical Chemistry
- Chemical Applications of Statistical Analyses
- Calibration Curves: Correlation Coefficient
Micro-course: Chemical Applications of Statistical Analyses
104,967 views
Learn key concepts and earn your certificate.











Calibration Curves: Correlation Coefficient

00:00
01:10
Video Summary: What Is Calibration Curves Correlation Coefficient
Ever wonder how pharmaceutical companies ensure their drug concentration measurements are accurate enough to save lives? Calibration curve correlation statistics provide the mathematical foundation for reliable analytical measurements across industries. When FDA-approved laboratories analyze blood samples for therapeutic drug monitoring, they rely on correlation coefficients to validate their calibration curves and ensure patient safety. Understanding what is calibration curves correlation coefficient empowers students to grasp how scientists quantify measurement reliability in real-world applications. Watch the full video on JoVE Coach to master this concept with expert-led visuals and step-by-step explanations.
- Understand what is calibration curves correlation coefficient and its role in validating analytical measurement methods
- Identify the difference between Pearson correlation coefficient (r) and coefficient of determination (R²) in calibration analysis
- Analyze correlation coefficient values ranging from -1 to +1 and interpret their significance for linear relationships
- Evaluate R² values from 0 to 1 to assess the goodness of fit in calibration curve models
- Apply correlation statistics to determine whether a calibration curve meets analytical method requirements
- Compare strong positive correlations (r approaching +1) with weak or negative correlations in experimental data
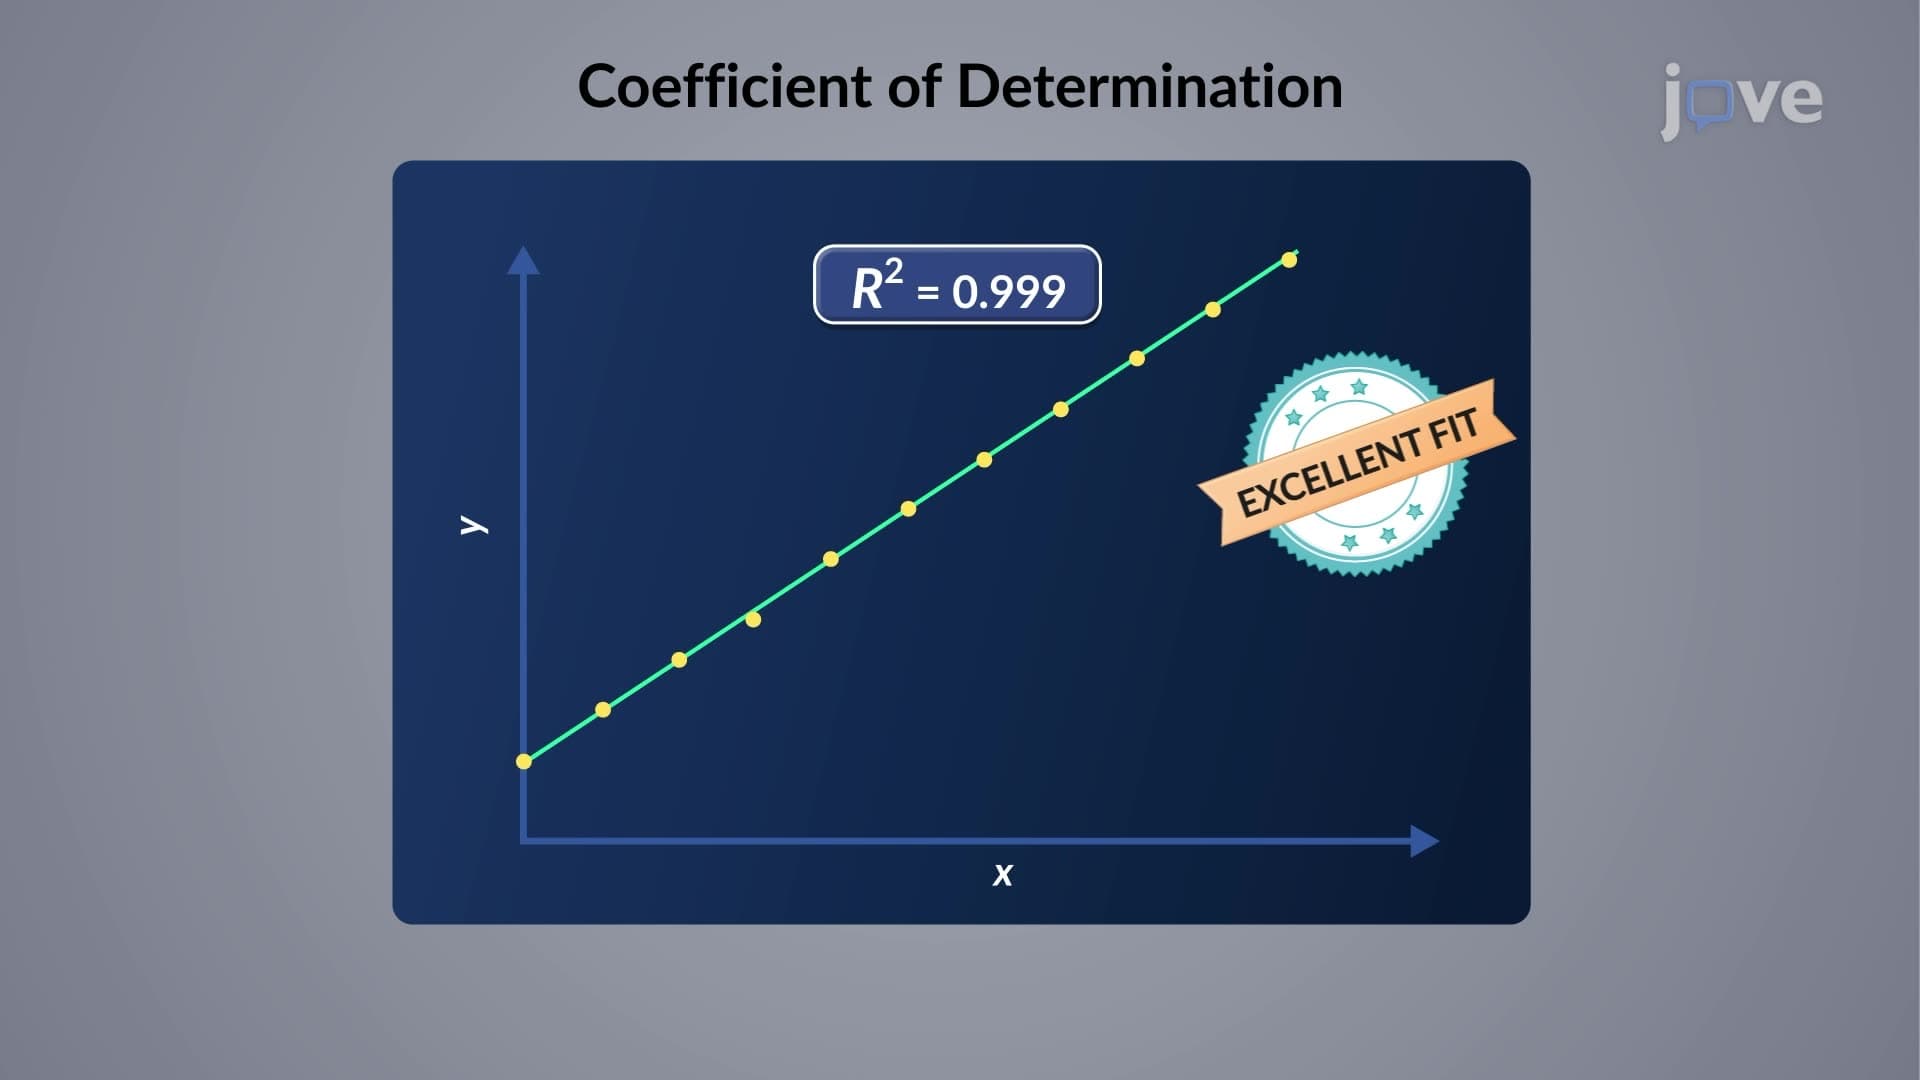
- Recognize when R² values indicate excellent fit (≥0.999) versus acceptable fit (≥0.995) in analytical chemistry
- Explore real-world applications of calibration curve statistics in pharmaceutical, environmental, and clinical laboratories
Understanding Calibration Curves Correlation Coefficient Fundamentals
Calibration curve correlation serves as the statistical backbone for validating analytical methods across scientific disciplines. When analytical chemists at the CDC develop methods for detecting contaminants in drinking water, or when pharmaceutical companies create assays for measuring drug concentrations, they rely on correlation statistics to ensure their measurements are both accurate and precise.
The correlation coefficient calibration curve relationship involves two primary statistical measures. The Pearson correlation coefficient (r) quantifies the strength and direction of linear relationships between known concentrations and instrument responses. Meanwhile, the coefficient of determination (R²) provides deeper insight into how well the mathematical model explains variability in the data.
Interpreting Correlation Coefficient Values in Practice
R squared value chemistry applications demonstrate why understanding these statistics matters for real-world analytical work. In pharmaceutical quality control laboratories, FDA regulations often require R² values of 0.995 or higher for method validation. This stringent requirement ensures that when analyzing critical medications like insulin or cardiac drugs, the calibration curve accurately predicts unknown concentrations.
The Pearson correlation calibration coefficient ranges from -1 to +1, where values approaching +1 indicate strong positive linear relationships. For instance, in environmental monitoring of lead contamination in Flint, Michigan's water supply, analytical laboratories would expect r values exceeding 0.998 when plotting instrument response against known lead concentrations.
Practical Applications and Method Validation
Linearity calibration curve assessment becomes crucial when laboratories develop new analytical methods. Clinical laboratories analyzing glucose levels in diabetic patients must demonstrate that their calibration curves maintain linearity across the clinically relevant range (typically 50-400 mg/dL). Poor linearity, indicated by low correlation coefficients, could lead to misdiagnosis and inappropriate treatment decisions.
How to interpret R squared calibration values requires understanding that R² represents the proportion of variance explained by the linear model. An R² value of 0.999 means 99.9% of the data variability is explained by the linear relationship, leaving only 0.1% unexplained. This level of precision is essential for analytical methods used in forensic laboratories, where accurate quantification of evidence compounds can determine legal outcomes.
Advanced Considerations for Analytical Method Development
Goodness of fit calibration evaluation extends beyond simple correlation coefficients. Analytical chemists must also consider residual patterns, homoscedasticity, and potential outliers that might inflate correlation values. AP Chemistry students encountering these concepts should understand that correlation doesn't always imply causation, but in calibration curves, strong correlation with proper experimental design does indicate reliable analytical performance suitable for quantitative applications in research and industry settings.
Frequently Asked Questions
Calibration curves correlation coefficient is a statistical measure that quantifies how well a linear relationship exists between known concentrations and instrument responses in analytical methods. It's crucial because it validates whether your analytical method can reliably predict unknown sample concentrations. Strong correlation coefficients (r > 0.995) ensure accurate results in critical applications like pharmaceutical quality control, clinical diagnostics, and environmental monitoring.
The MCAT typically presents correlation coefficient problems in the context of experimental design and data interpretation passages, often requiring students to evaluate method reliability. AP Chemistry exams may include questions about R² interpretation in laboratory-based free response questions. Students should be prepared to distinguish between correlation coefficients (r) and coefficients of determination (R²) and explain their significance for analytical method validation.
Most college analytical chemistry courses require R² values of 0.995 or higher for acceptable calibration curves in lab reports. Values between 0.990-0.994 may be acceptable with proper discussion of limitations. R² values below 0.990 typically indicate problems with experimental technique, instrument calibration, or inappropriate concentration ranges that require method optimization or data collection repetition.
Pharmaceutical companies like Pfizer and Johnson & Johnson use calibration curve correlation statistics to validate analytical methods for drug concentration analysis during manufacturing. FDA regulations require R² values exceeding 0.995 for method validation, ensuring accurate dosing in medications like insulin, blood pressure medications, and cancer treatments. Poor correlation could lead to under-dosed or toxic drug products reaching patients.
No advanced statistics background is required to interpret basic R² calibration values. High school algebra and basic scientific method understanding provide sufficient foundation. The key concept is recognizing that R² values closer to 1.0 indicate better model fit, while values below 0.95 suggest problems with the analytical method. Focus on practical interpretation rather than complex statistical derivations.
Create a simple visual reference: r values range from -1 to +1 (strength and direction), while R² values range from 0 to 1 (goodness of fit only). Remember the benchmark: R² > 0.995 = excellent fit for analytical work, R² > 0.990 = acceptable, R² < 0.950 = problematic. Practice with real data from lab experiments to build intuitive understanding rather than relying solely on memorization.
Progress to method validation parameters including precision, accuracy, detection limits, and quantitation limits. Explore advanced regression techniques like weighted least squares for heteroscedastic data and non-linear calibration models. Study analytical method development following ICH guidelines, which builds upon correlation coefficient understanding for pharmaceutical applications.
Related Micro-courses

19 Concepts

14 Concepts
17 Concepts