Loading subject page…


104,969 views
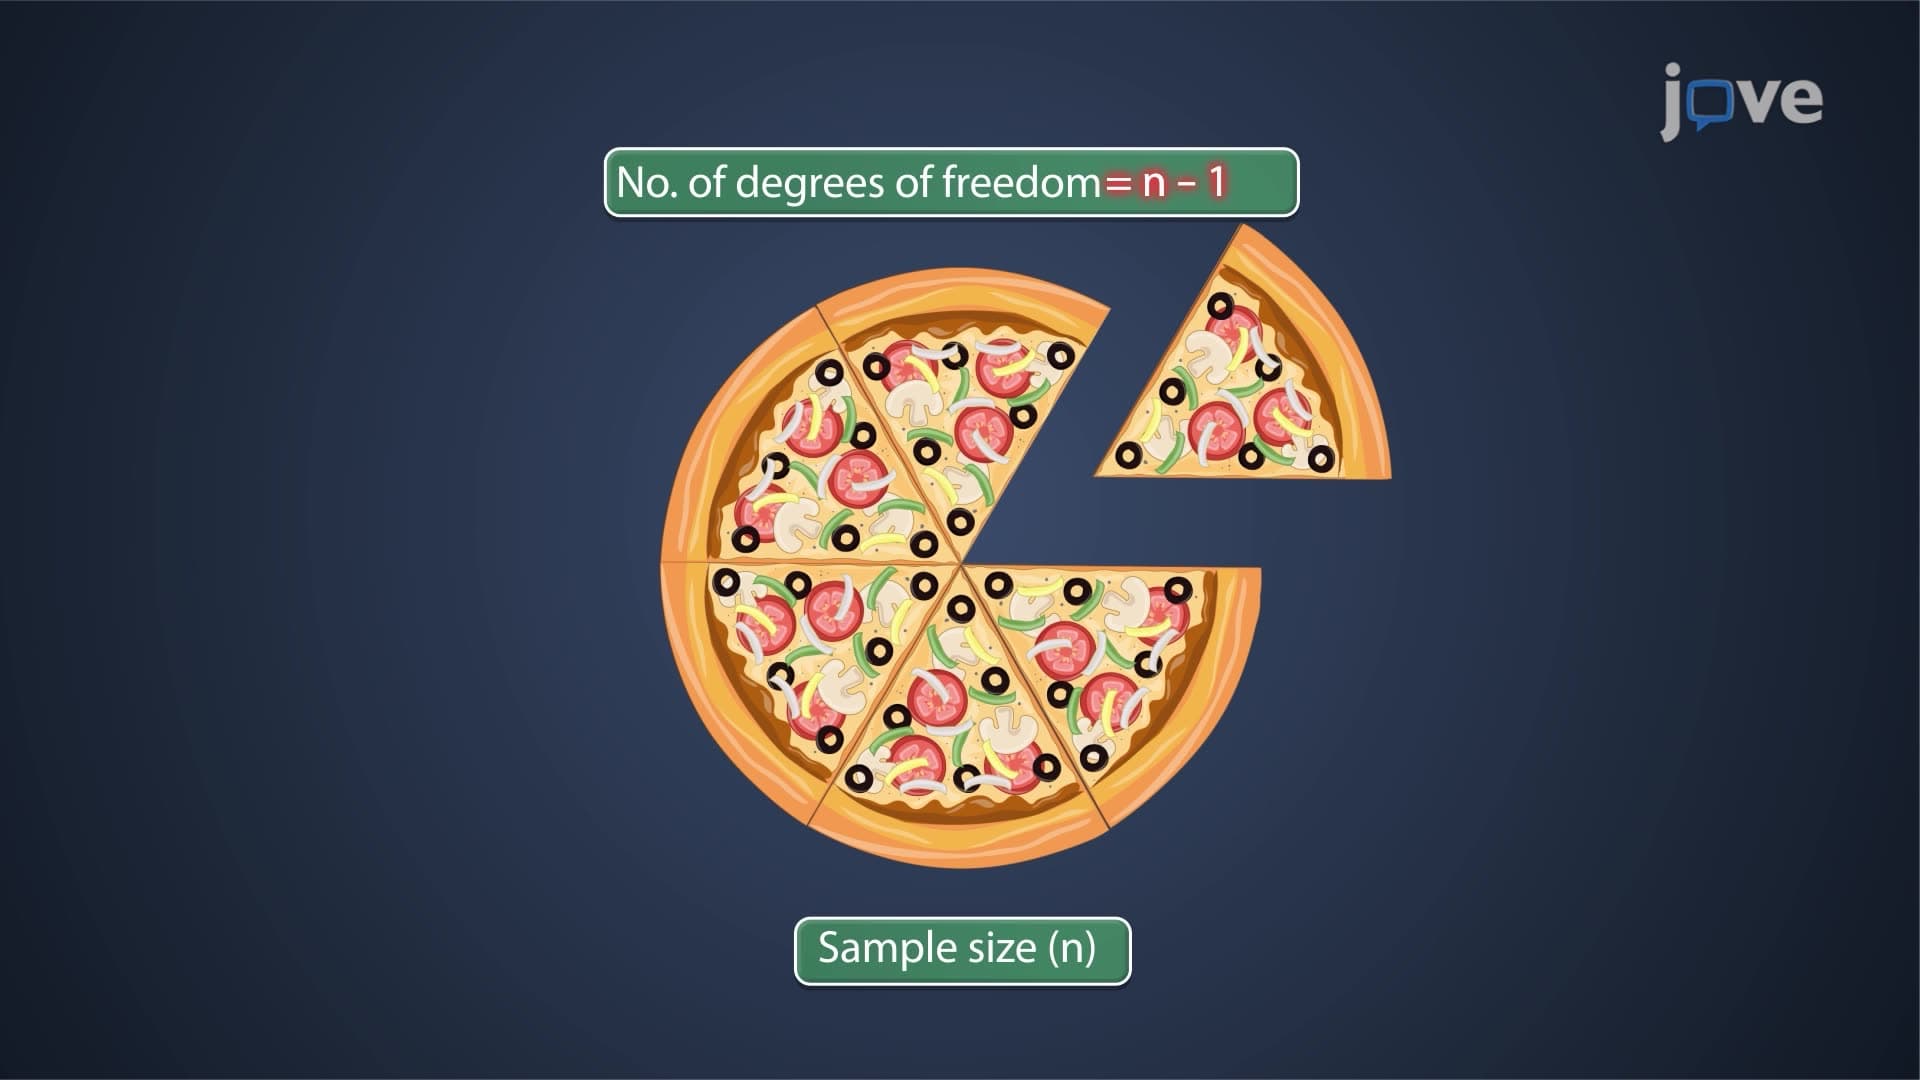

Video Summary: What Is Degrees of Freedom
Ever wonder why statisticians always subtract 1 from sample size? Degrees of freedom statistics represent the number of independent values that can vary freely in a statistical calculation. Picture analyzing test scores from 30 students at Lincoln High School-you can freely assign 29 scores, but the 30th is locked in by the constraint of the known average. This fundamental concept underlies every statistical test from t-tests to chi-square analyses. Watch the full video on JoVE Coach to master this concept with expert-led visuals and step-by-step explanations.
Degrees of freedom statistics fundamentally represent the number of independent pieces of information available for statistical estimation after accounting for constraints. Think of it as your statistical "budget"-once you use information to calculate certain parameters, you lose flexibility in your remaining calculations. This concept appears throughout statistical analysis, from basic descriptive statistics to advanced hypothesis testing procedures.
How to calculate degrees of freedom depends entirely on the statistical context and constraints involved. For a single sample mean, df = n - 1 because estimating the population mean from sample data consumes one degree of freedom. In the dalmatian example, with seven dogs averaging 100 spots each, six values can vary freely while the seventh must equal 700 minus the sum of the first six values.
For more complex scenarios, degrees of freedom in data analysis follows the principle: df = (number of observations) - (number of parameters estimated). In two-sample t-tests comparing SAT scores between districts, df = (n₁ + n₂) - 2. For chi-square tests analyzing course enrollment patterns across majors, df = (rows - 1) × (columns - 1).
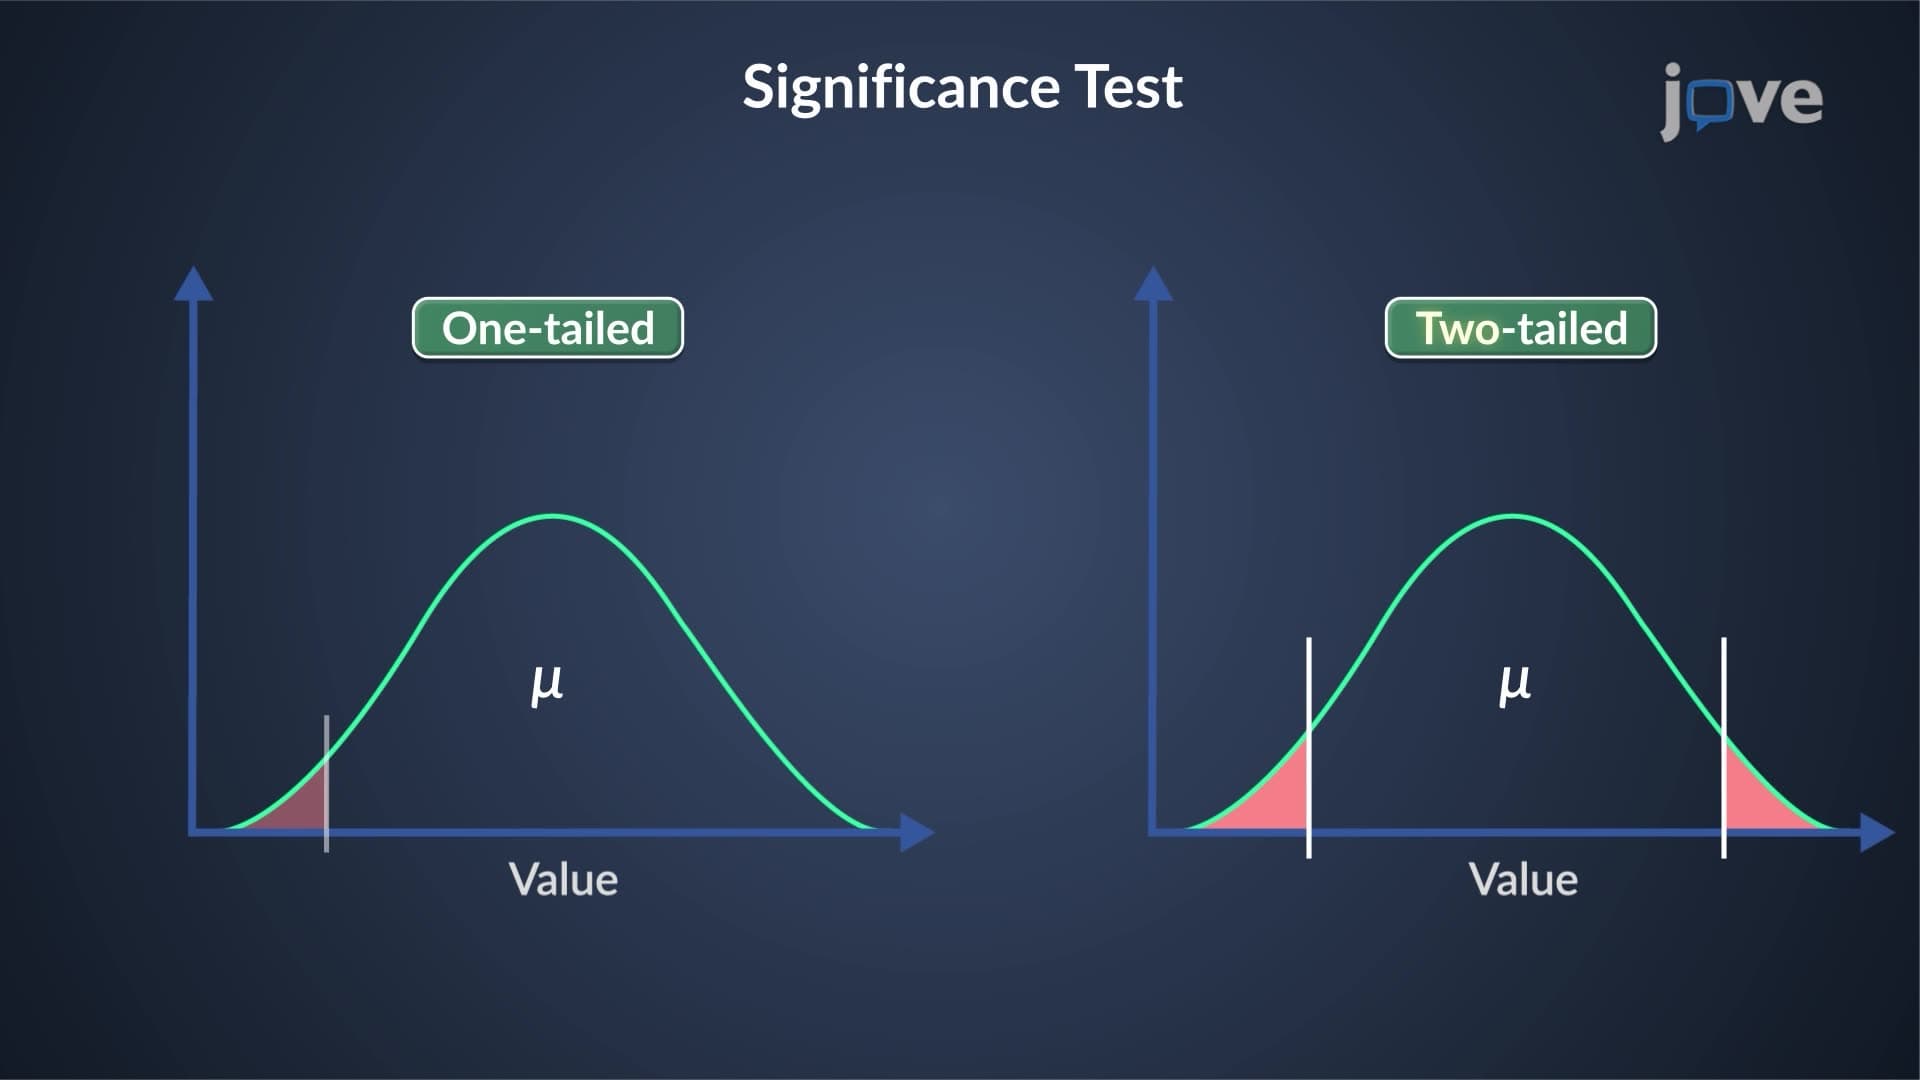
Statistical degrees of freedom directly influence critical values and p-values in hypothesis testing. Higher degrees of freedom generally produce distributions closer to normal, affecting decision thresholds in df in hypothesis testing scenarios. For AP Statistics students analyzing survey data, understanding that larger samples (higher df) provide more reliable estimates becomes crucial for interpretation.
In regression analysis-common in college statistics courses-degrees of freedom equals sample size minus the number of predictor variables minus one. When analyzing factors affecting graduation rates across US high schools, each additional predictor variable reduces available degrees of freedom for error estimation.
The practical significance of chi-square degrees of freedom appears frequently in research contexts. When testing whether course preferences differ across grade levels in American high schools, correct degree of freedom calculation determines whether observed differences are statistically significant. Incorrect calculations lead to wrong conclusions about educational interventions or policy effectiveness.
For students preparing for standardized tests, recognizing that degrees of freedom affects statistical power helps optimize experimental design. Smaller degrees of freedom require larger effect sizes for statistical significance-knowledge essential for interpreting research studies on MCAT, AP, or college exams.
Related Micro-courses