Loading subject page…

- Analytical Chemistry
- Chemical Applications of Statistical Analyses
- Quantifying and Rejecting Outliers: The Grubbs Test
Micro-course: Chemical Applications of Statistical Analyses
104,967 views
Learn key concepts and earn your certificate.







Quantifying and Rejecting Outliers: The Grubbs Test

00:00
01:02
Video Summary: What Is Grubbs Test
Ever wondered how NASA scientists spot faulty sensor readings among thousands of data points? Grubbs test statistics provide the solution by mathematically identifying outliers in normally distributed datasets. This Grubbs test for outliers calculates a G-statistic comparing suspicious values to the sample mean and standard deviation. For example, when the FDA analyzes drug purity data from pharmaceutical companies, they use the Grubbs test to flag contaminated batches. Watch the full video on JoVE Coach to master this concept with expert-led visuals and step-by-step explanations.
- Understand the Grubbs test as a statistical method for detecting outliers in normally distributed datasets with seven or more observations
- Identify when to apply Grubbs test versus other outlier detection methods like Dixon's Q-test in laboratory and research settings
- Apply the Grubbs statistic formula by calculating the ratio of absolute difference between questionable value and mean to standard deviation
- Compare calculated G-values with critical values from statistical tables to determine outlier status at specified confidence levels
- Analyze the decision-making process for retaining or rejecting suspicious data points based on statistical criteria
- Evaluate the importance of sample size requirements and normal distribution assumptions before applying the test
- Recognize real-world applications in quality control, scientific research, and data validation across multiple industries
- Explore connections between Grubbs test and other statistical concepts like standard deviation, confidence intervals, and hypothesis testing
Understanding the Grubbs Test Foundation
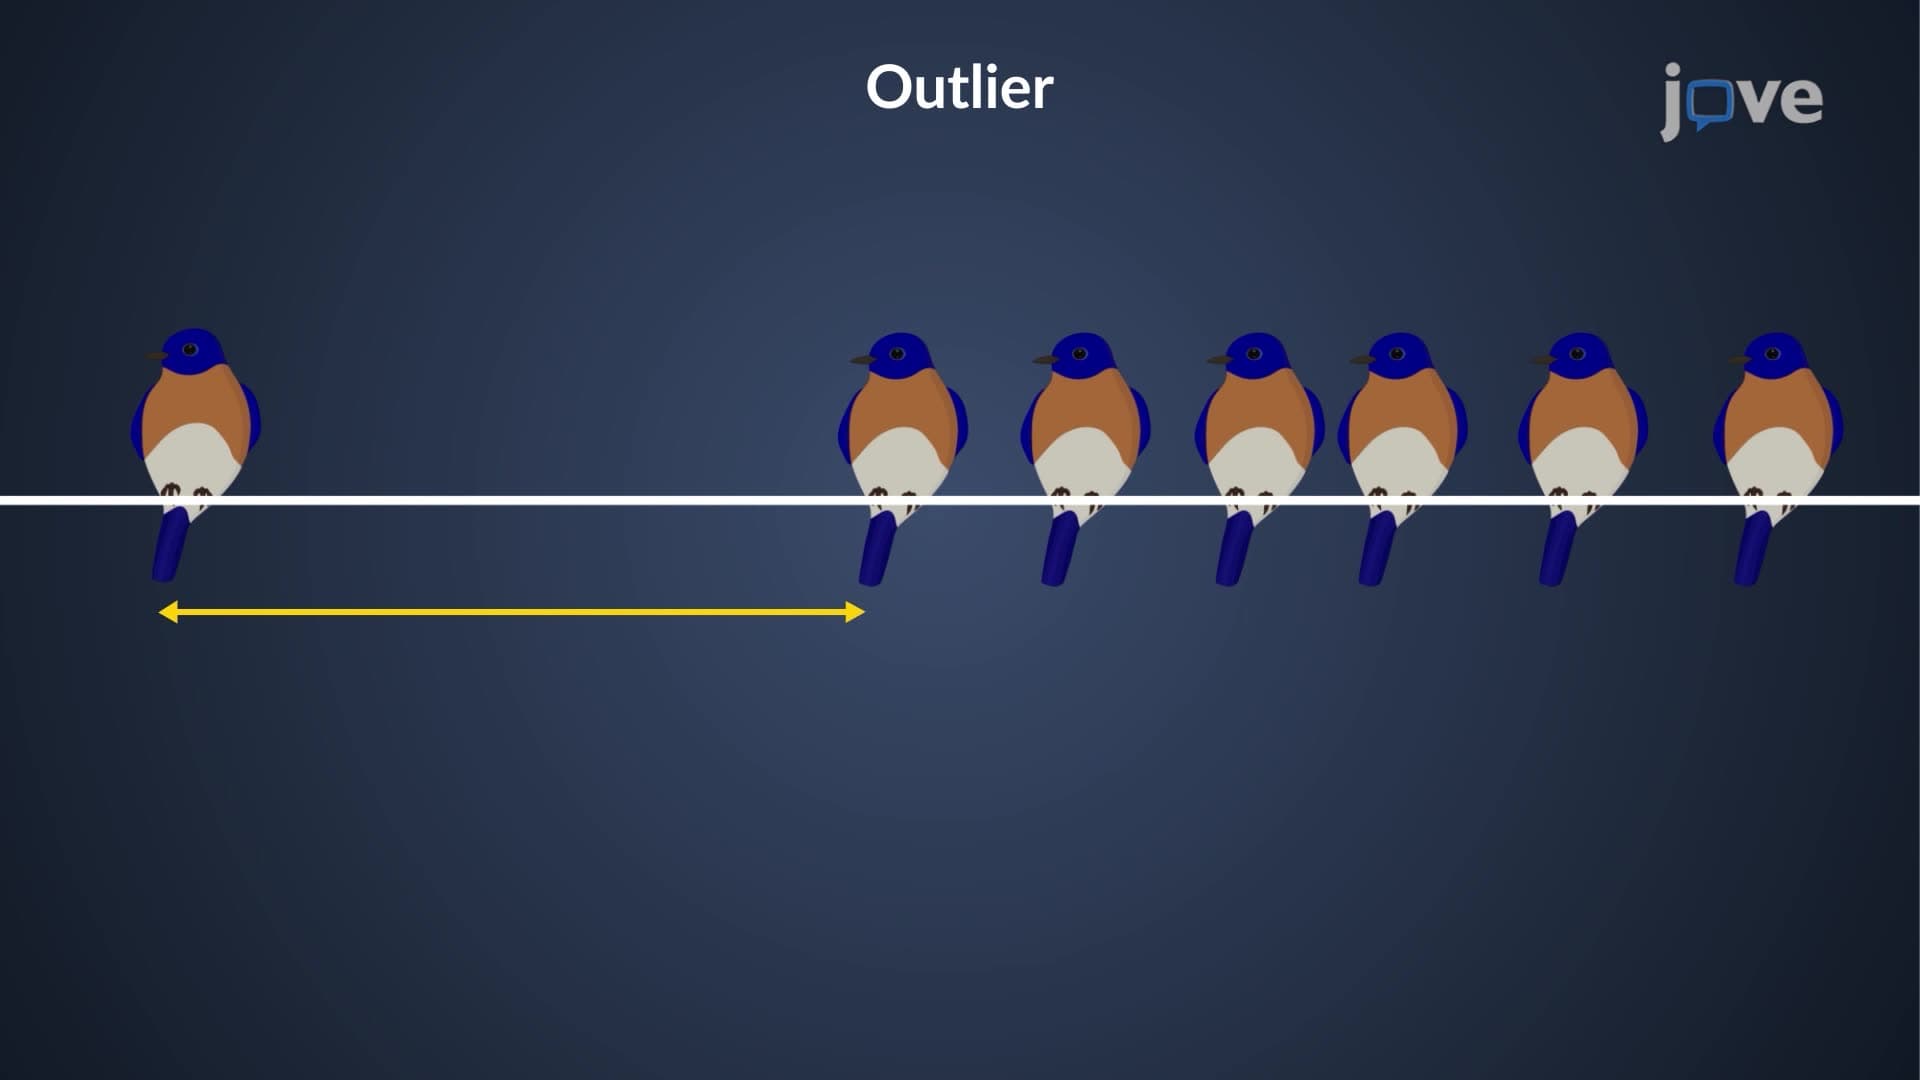
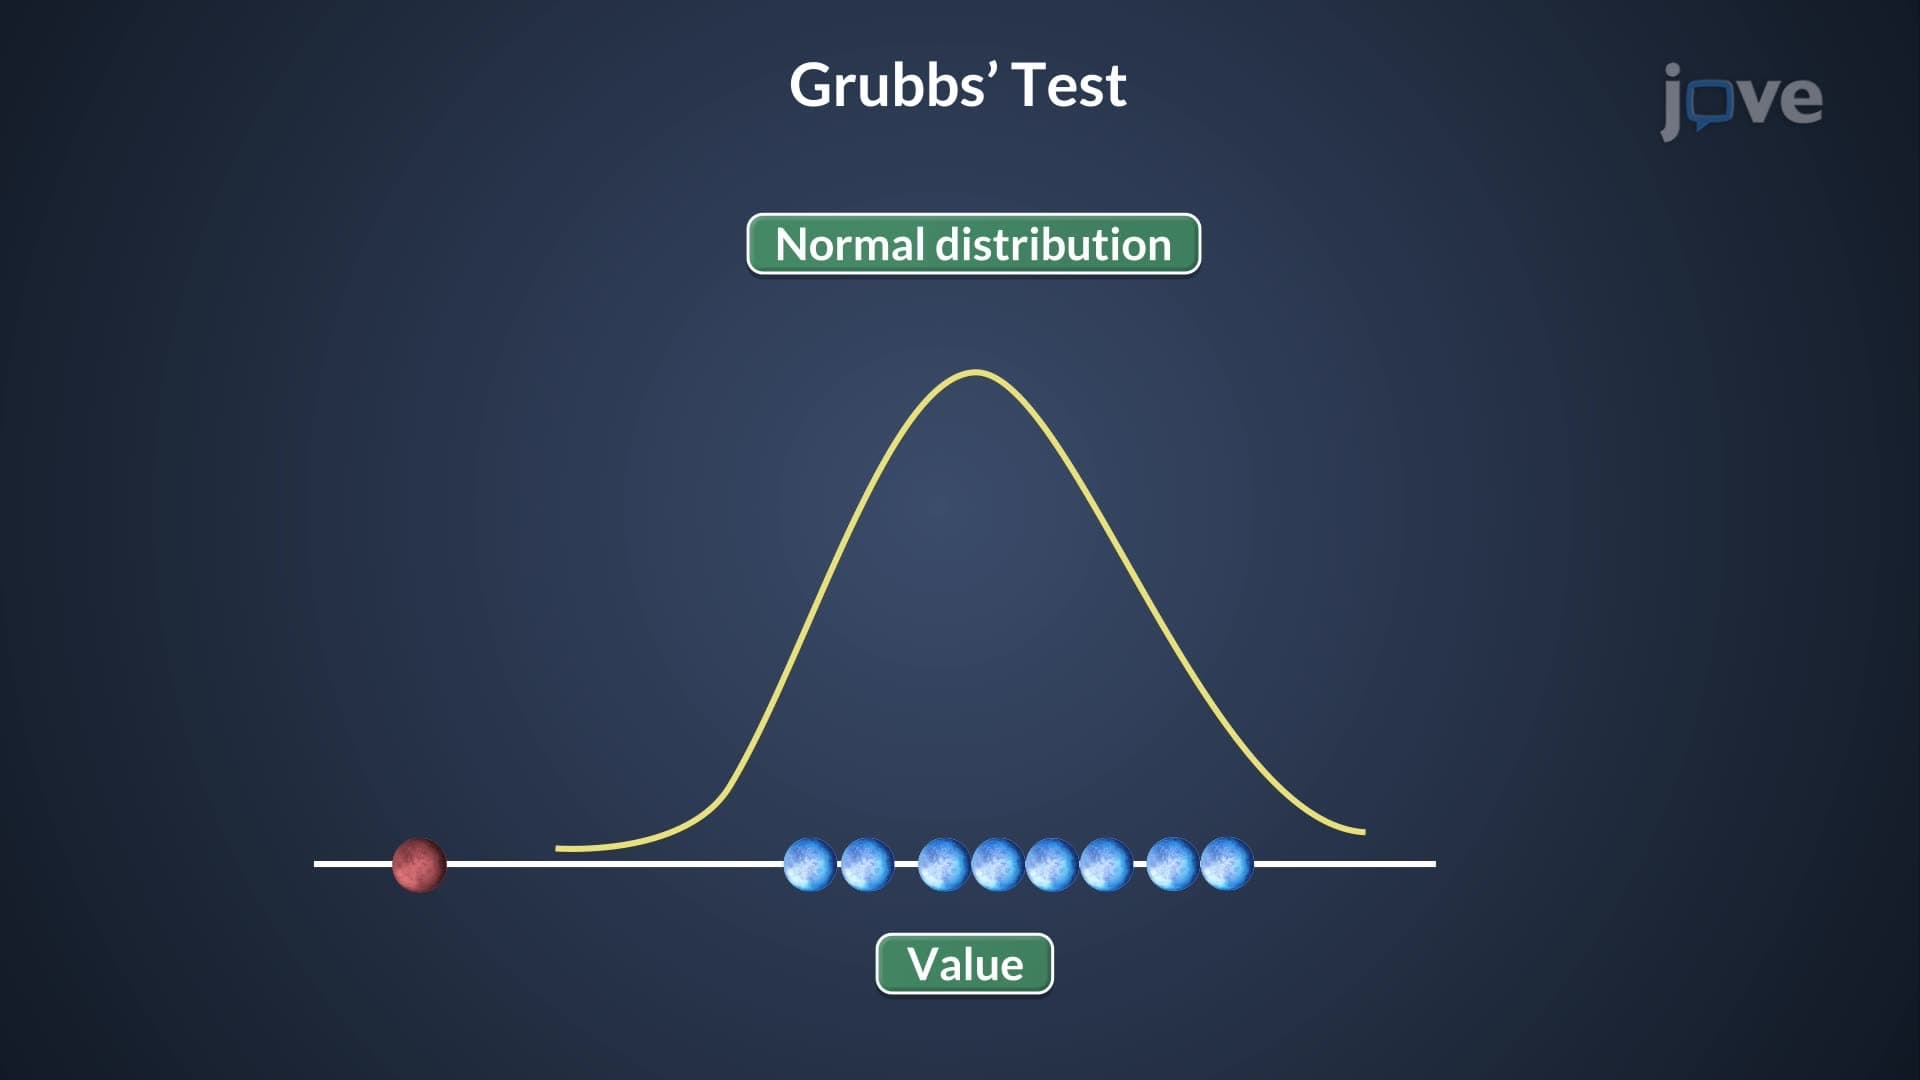
The Grubbs test serves as a cornerstone method for outlier detection Grubbs in statistical analysis, particularly valuable for students preparing for AP Statistics, college statistics courses, and standardized tests like the MCAT. Named after Frank Grubbs who developed it in 1950, this statistical outlier test specifically targets single outliers in datasets that follow normal distribution patterns.
Unlike subjective visual inspection of data, the Grubbs test provides objective mathematical criteria for outlier identification. The test requires at least seven observations and assumes the underlying data follows a normal distribution, conditions commonly encountered in laboratory experiments, quality control processes, and research studies across American universities and industries.
Grubbs Test Procedure and Calculation Methods
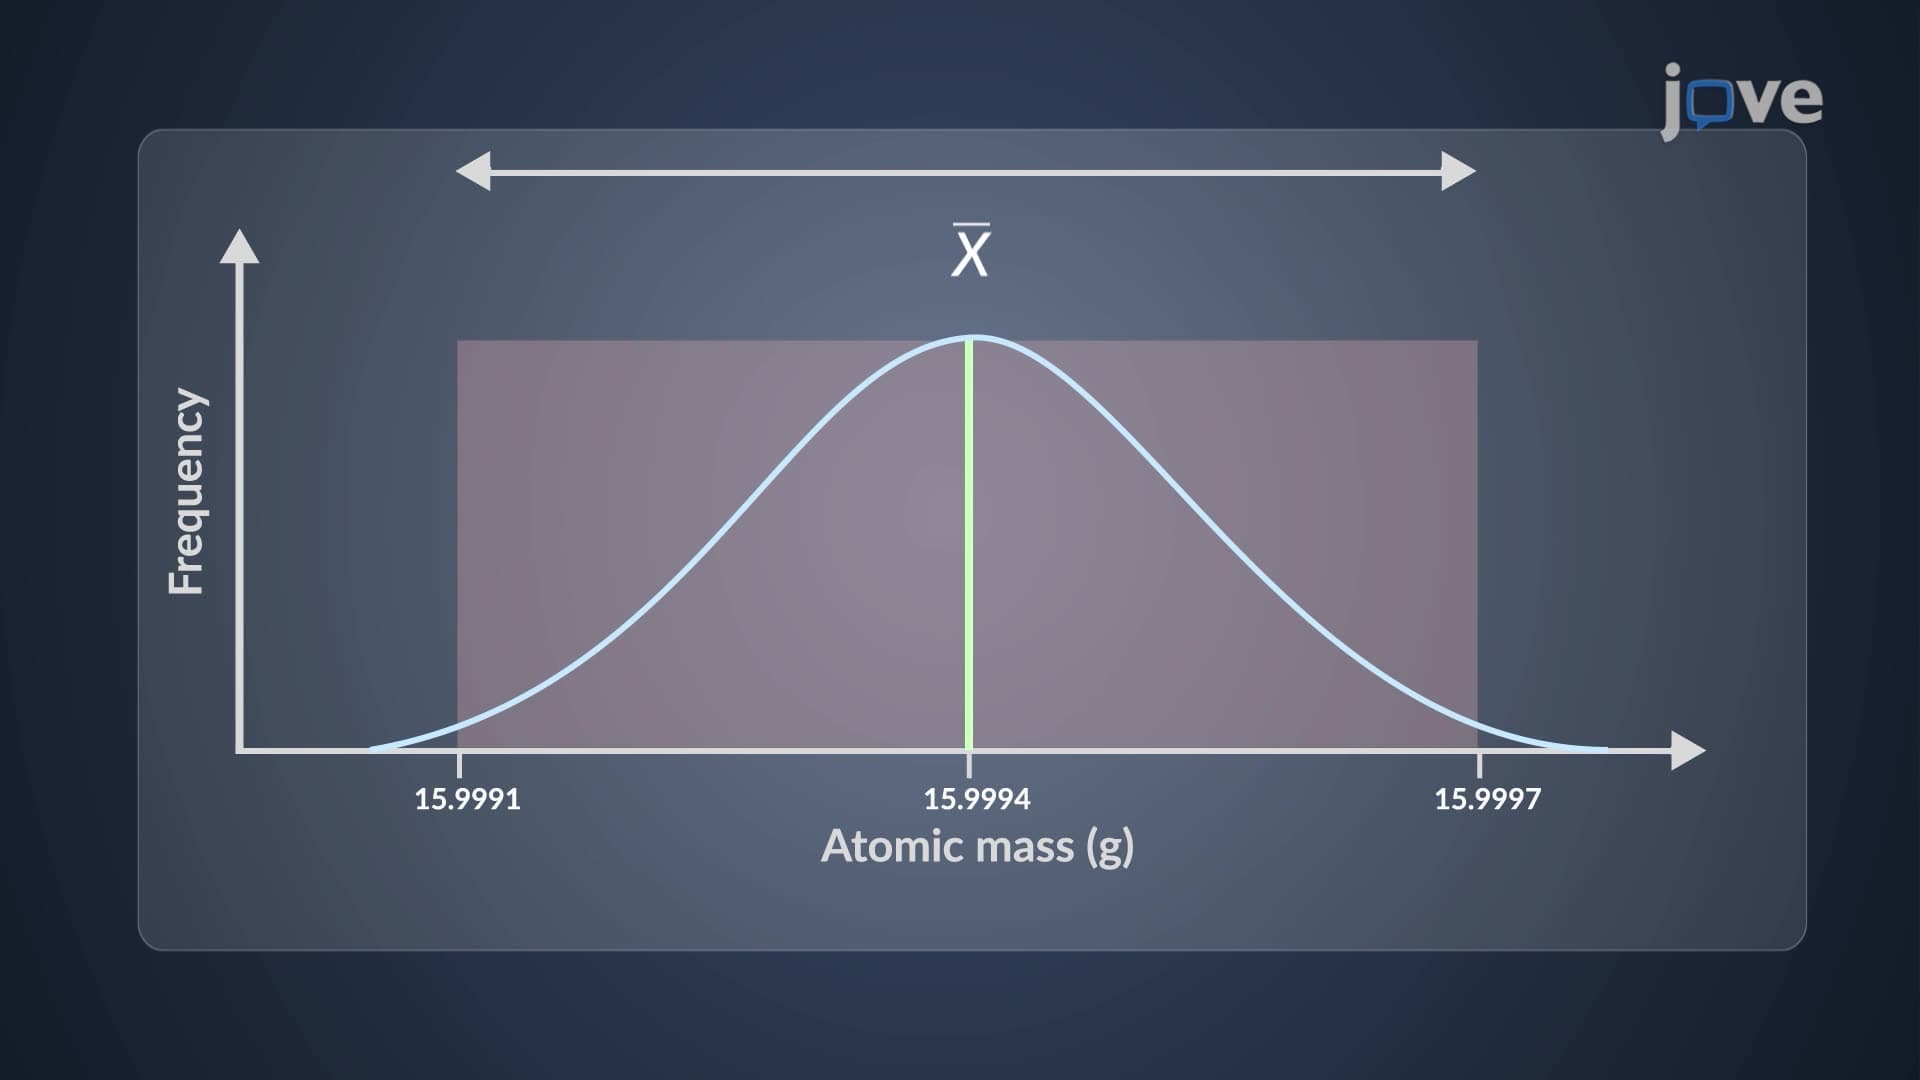
The Grubbs test procedure centers on calculating the G-statistic using the formula: G = |X - X̄| / s, where X represents the suspected outlier, X̄ is the sample mean, and s is the sample standard deviation. This extreme value test statistics approach quantifies how many standard deviations the questionable point lies from the mean.
Students learning how to use Grubbs test chemistry applications will find this particularly relevant in analytical chemistry courses where precision matters. For instance, when analyzing the concentration of lead in drinking water samples from Flint, Michigan, chemists use Grubbs test to identify contaminated readings that could indicate systematic errors or contamination events.
Critical Value Interpretation and Decision Making
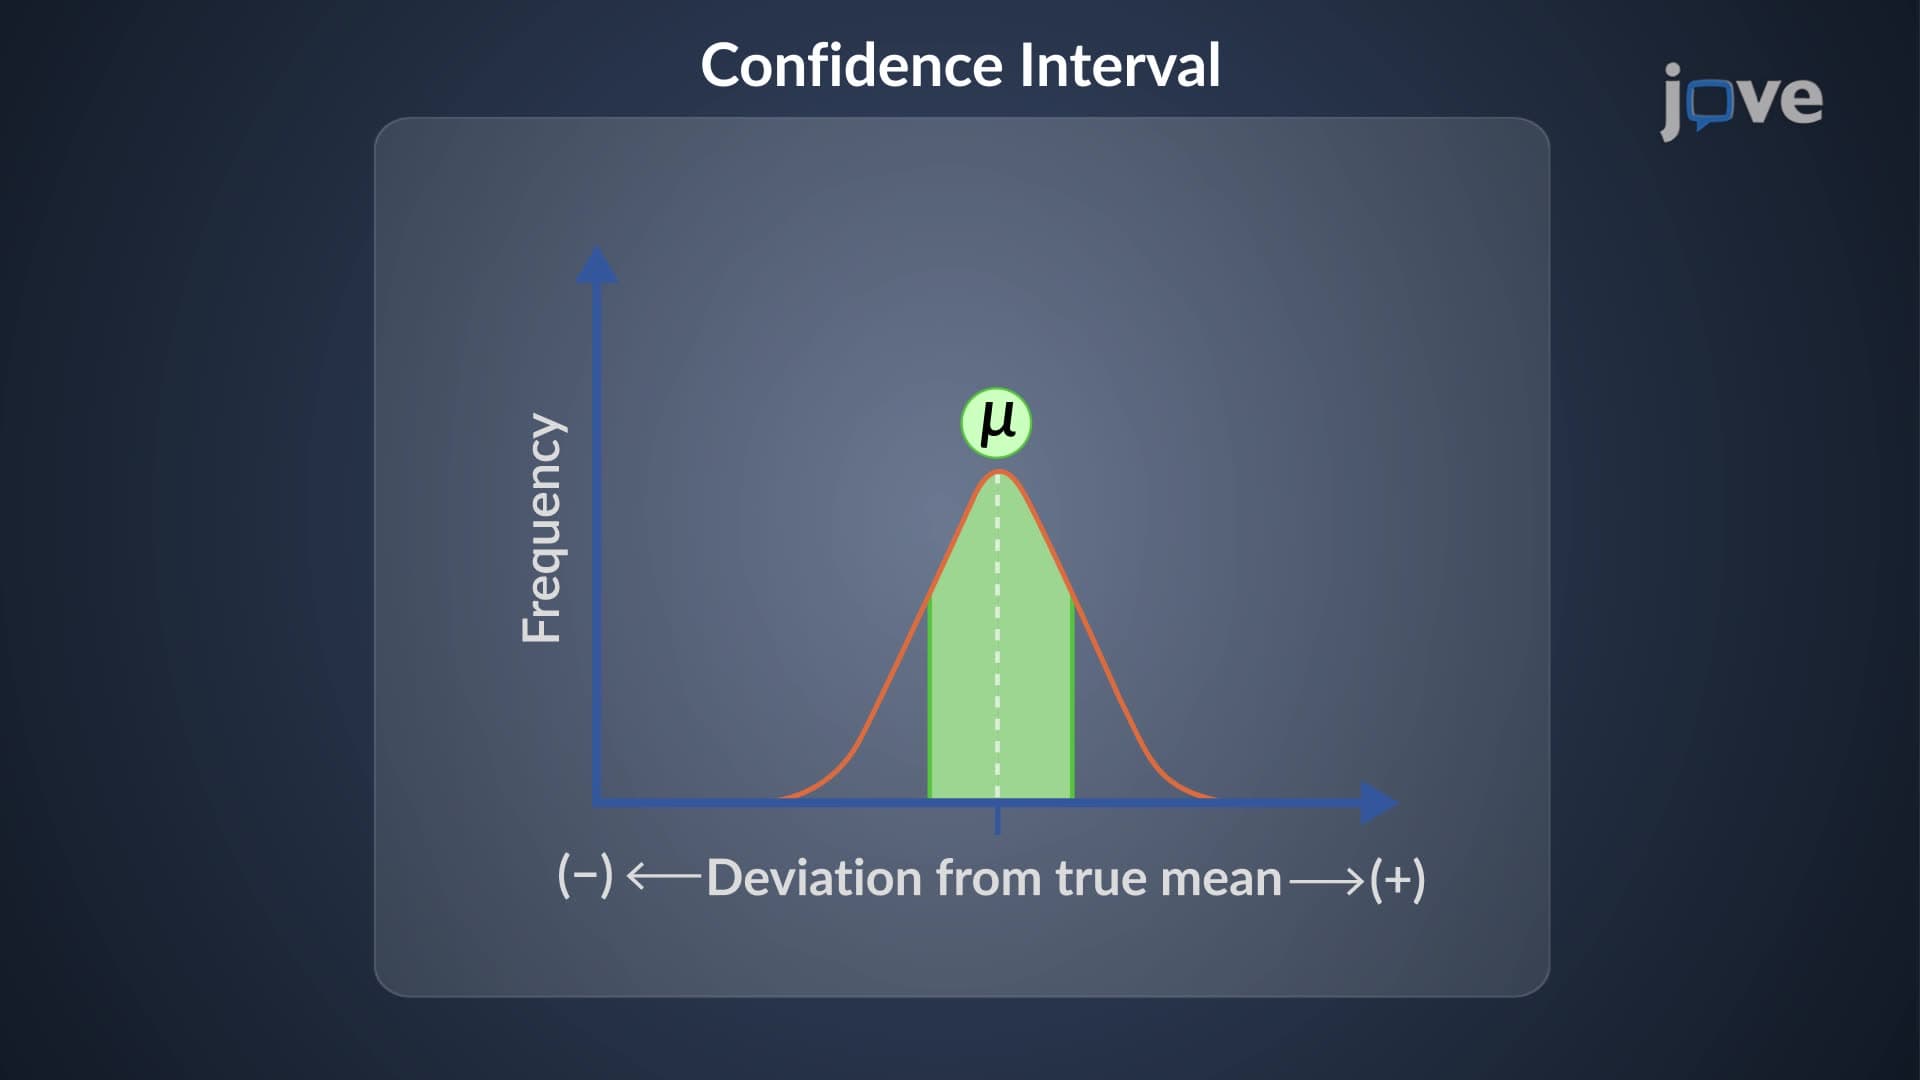
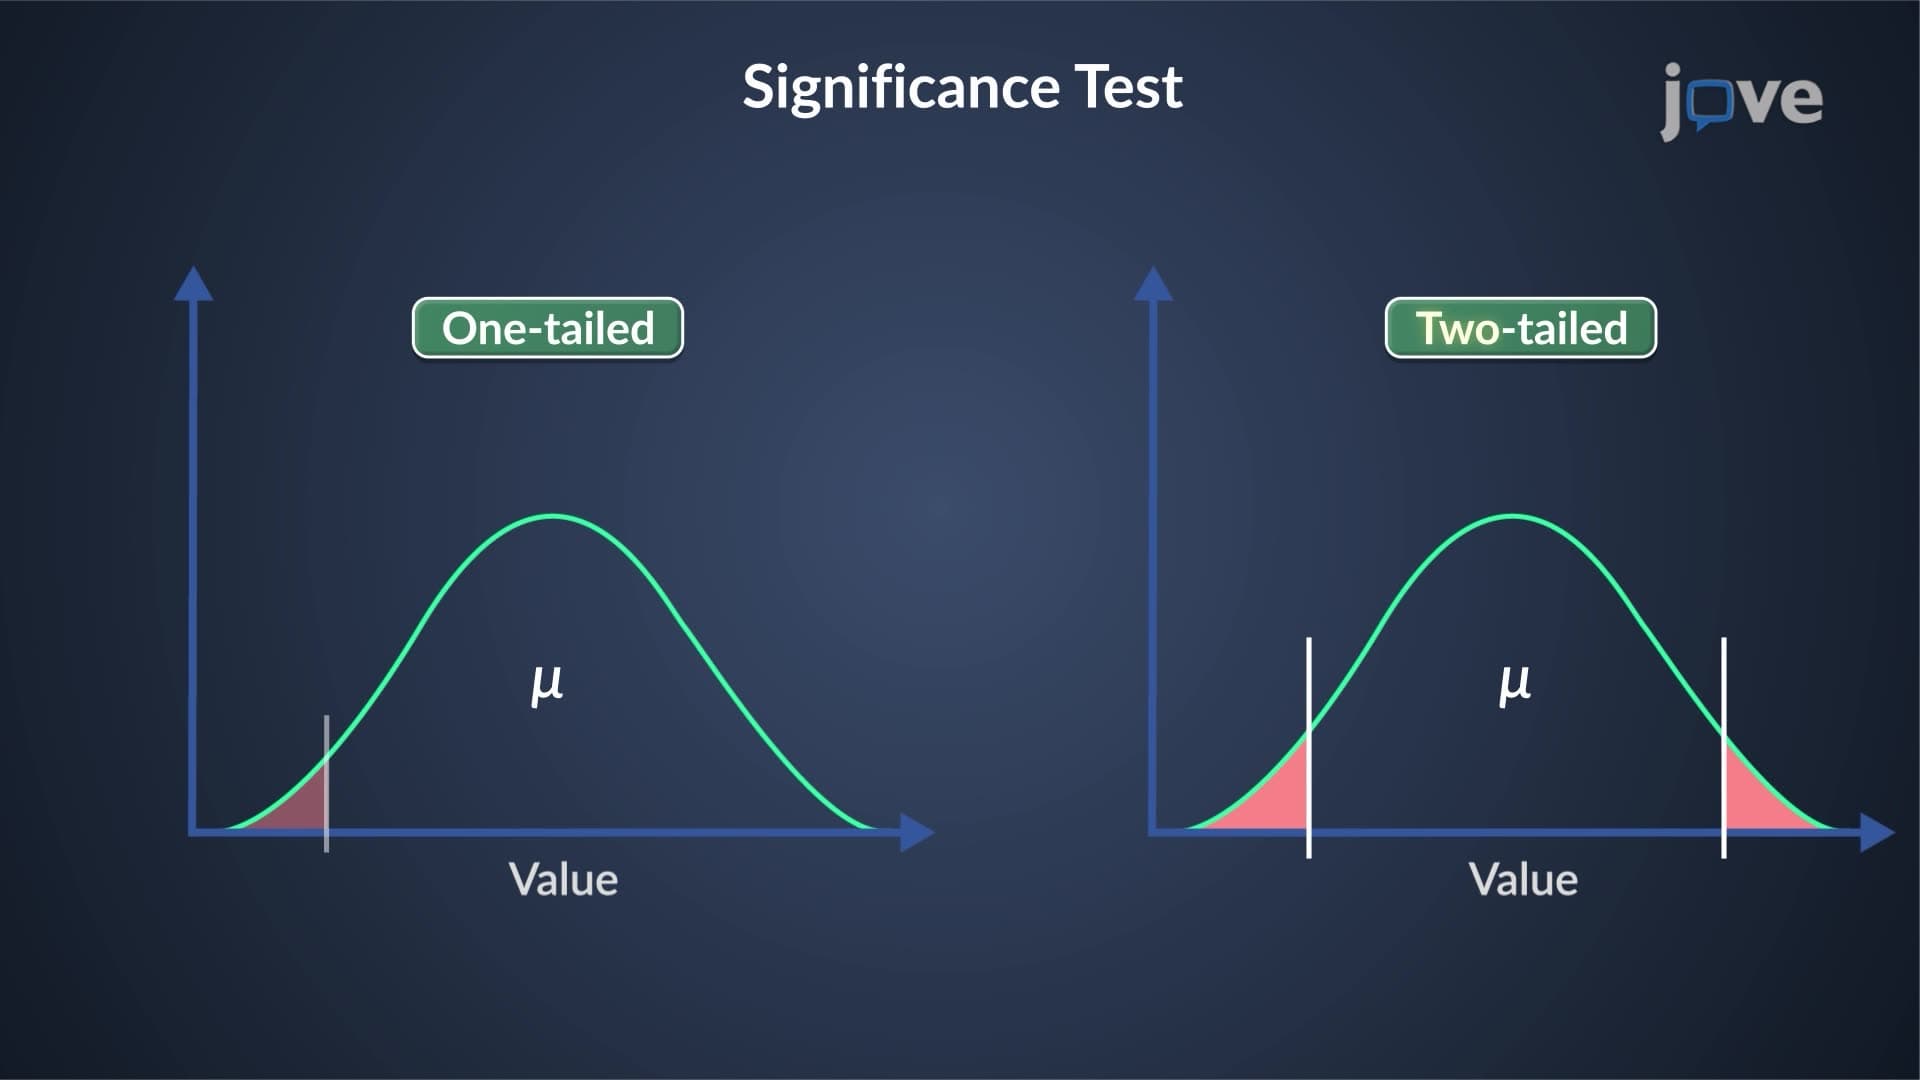
The Grubbs critical value comparison forms the heart of the decision-making process. After calculating the G-statistic, researchers compare it against tabulated critical values based on sample size and desired confidence level (typically 95% or 99%). These critical values, available in standard statistical tables used in American textbooks, represent the threshold beyond which a data point becomes statistically unlikely to belong to the same population.
When the calculated G-value exceeds the critical value, the suspicious observation is rejected as an outlier. Conversely, if G falls below the critical threshold, the questionable point remains in the dataset. This binary decision framework provides clear, reproducible results essential for scientific integrity and regulatory compliance.
Real-World Applications and Academic Relevance
In practice, Grubbs test for outliers finds extensive use across American industries and academic institutions. Pharmaceutical companies like Pfizer employ it during drug development to identify anomalous clinical trial results. Environmental agencies use it to spot unusual pollution readings that might indicate industrial accidents or equipment malfunctions.
For students taking advanced placement courses or college statistics, understanding Grubbs test enhances data analysis skills crucial for STEM careers. The test frequently appears in statistics textbooks, homework assignments, and exam questions, making mastery essential for academic success and future professional applications in research, quality control, and data science fields.
Frequently Asked Questions
Grubbs test is a statistical method for identifying single outliers in normally distributed datasets with at least 7 observations. Use it when you suspect one extreme value might be contaminating your data analysis, such as in laboratory experiments or quality control processes. It's particularly useful for AP Statistics students and college courses requiring objective outlier detection rather than visual inspection.
AP Statistics and college exams often present Grubbs test in data analysis scenarios requiring outlier identification. You'll typically encounter problems asking you to calculate G-statistics, compare with critical values, and make decisions about data point retention. The College Board includes outlier detection concepts in AP Statistics curriculum, making Grubbs test knowledge valuable for exam success.
Yes, MCAT psychology and sociology sections may include Grubbs test concepts within research methods and statistical analysis questions. Medical schools value students who understand data quality control since clinical research requires identifying anomalous patient responses or measurement errors. Understanding outlier detection strengthens your scientific reasoning skills tested on entrance exams.
Companies like Johnson & Johnson use Grubbs test to identify unusual patient responses during clinical trials, ensuring drug safety data integrity. For example, if one patient shows extremely high blood pressure readings during hypertension medication testing, Grubbs test helps determine whether this represents a genuine adverse reaction or measurement error requiring investigation.
No, Grubbs test requires only high school algebra and basic statistics concepts like mean and standard deviation. If you understand how to calculate averages and can follow simple formulas, you can master Grubbs test. The most challenging aspect involves interpreting statistical tables, but practice with homework problems builds confidence quickly.
Create a simple checklist: verify normal distribution, ensure n≥7, calculate G-statistic using the formula, find critical value from tables, compare values, and make retention decision. Practice with real datasets from American industries like environmental monitoring or pharmaceutical testing to reinforce concepts through concrete examples rather than abstract theory.
Learn both since they serve different purposes in American statistics education. Grubbs test works best for larger datasets (n≥7) with normal distributions, while Dixon's Q-test handles smaller samples effectively. AP Statistics and college courses often compare these methods, so understanding both strengthens your statistical toolkit for academic success and professional applications.
Explore multiple outlier detection methods like generalized extreme studentized deviate test, robust statistical measures, and non-parametric alternatives. Advanced topics include multivariate outlier detection and time series anomaly identification, valuable for students pursuing data science, engineering, or research careers in American universities and industries.
Related Micro-courses

19 Concepts

14 Concepts
17 Concepts