Loading subject page…

- Analytical Chemistry
- Chemical Applications of Statistical Analyses
- Detection of Gross Error: The Q Test
Micro-course: Chemical Applications of Statistical Analyses
104,967 views
Learn key concepts and earn your certificate.











Detection of Gross Error: The Q Test


00:00
01:00
Video Summary: What Is Q Test
Ever wondered how scientists decide if that one weird data point in their chemistry lab results is a real measurement or just experimental error? Q test outliers analysis provides the statistical answer that could save your grade on that AP Chemistry lab report. When MIT researchers analyze water contamination levels across Massachusetts, they use the Q test to determine whether an unusually high reading from Boston Harbor represents true pollution or measurement error. The Q test gives you the mathematical confidence to either keep or discard questionable data points. Watch the full video on JoVE Coach to master this concept with expert-led visuals and step-by-step explanations.
- Understand what the Q test is and why it's essential for identifying outliers in scientific data sets
- Identify when to apply Q test for outlier detection in laboratory experiments and research scenarios
- Analyze the mathematical relationship between Q test statistics and critical values for decision-making
- Apply the Dixon Q test formula to calculate rejection quotients for suspected outliers
- Evaluate whether to retain or reject questionable data points based on statistical significance
- Compare experimental Q values with tabulated critical values at different significance levels
- Recognize the importance of outlier analysis in maintaining data integrity for AP Chemistry and college laboratory courses
- Explore real-world applications of Q test methodology in pharmaceutical quality control and environmental monitoring
Understanding the Q Test Foundation
The Q test represents one of the most practical statistical tools in analytical chemistry and experimental science. Named after statistician W.E. Dixon, this outlier rejection method helps students and researchers make objective decisions about suspicious data points that seem inconsistent with the rest of their measurements. Unlike subjective judgment calls, Q test outliers analysis provides mathematical rigor to data quality decisions that directly impact scientific conclusions.
The fundamental principle behind how to apply Q test in chemistry involves comparing the suspected outlier's deviation to the overall data spread. This approach ensures that outlier rejection follows statistical principles rather than personal bias-a critical skill emphasized in AP Chemistry laboratory investigations and college analytical chemistry courses.
The Q Test Mathematical Framework
The Dixon Q test calculation centers on a straightforward ratio called the rejection quotient. This statistic compares the absolute difference between the suspected outlier and its nearest neighbor to the entire data range. For a suspected maximum outlier, the formula becomes: Q = (x_suspected - x_nearest) / (x_max - x_min).
Q test critical values vary based on sample size and desired confidence level, typically 95% or 99%. Students preparing for the MCAT or advanced chemistry courses must understand that larger sample sizes require higher Q values for outlier rejection, reflecting increased statistical power. The tabulated critical values ensure consistent decision-making across different experimental contexts.
Practical Applications in US Laboratory Settings
Data outlier testing using the Q test appears frequently in FDA pharmaceutical quality control, EPA environmental monitoring, and university research laboratories across institutions like Stanford, UC Berkeley, and Johns Hopkins. When analyzing drug purity at Pfizer's Connecticut facilities, chemists routinely apply Q test methodology to ensure manufacturing consistency.
The Q test procedure chemistry follows a systematic approach: arrange data in ascending order, identify the suspected outlier, calculate the Q statistic, compare with critical values, and make the retention or rejection decision. This standardized process appears in laboratory manuals from Harvard to UCLA, emphasizing its universal acceptance in American scientific education.
Statistical Significance and Decision Making
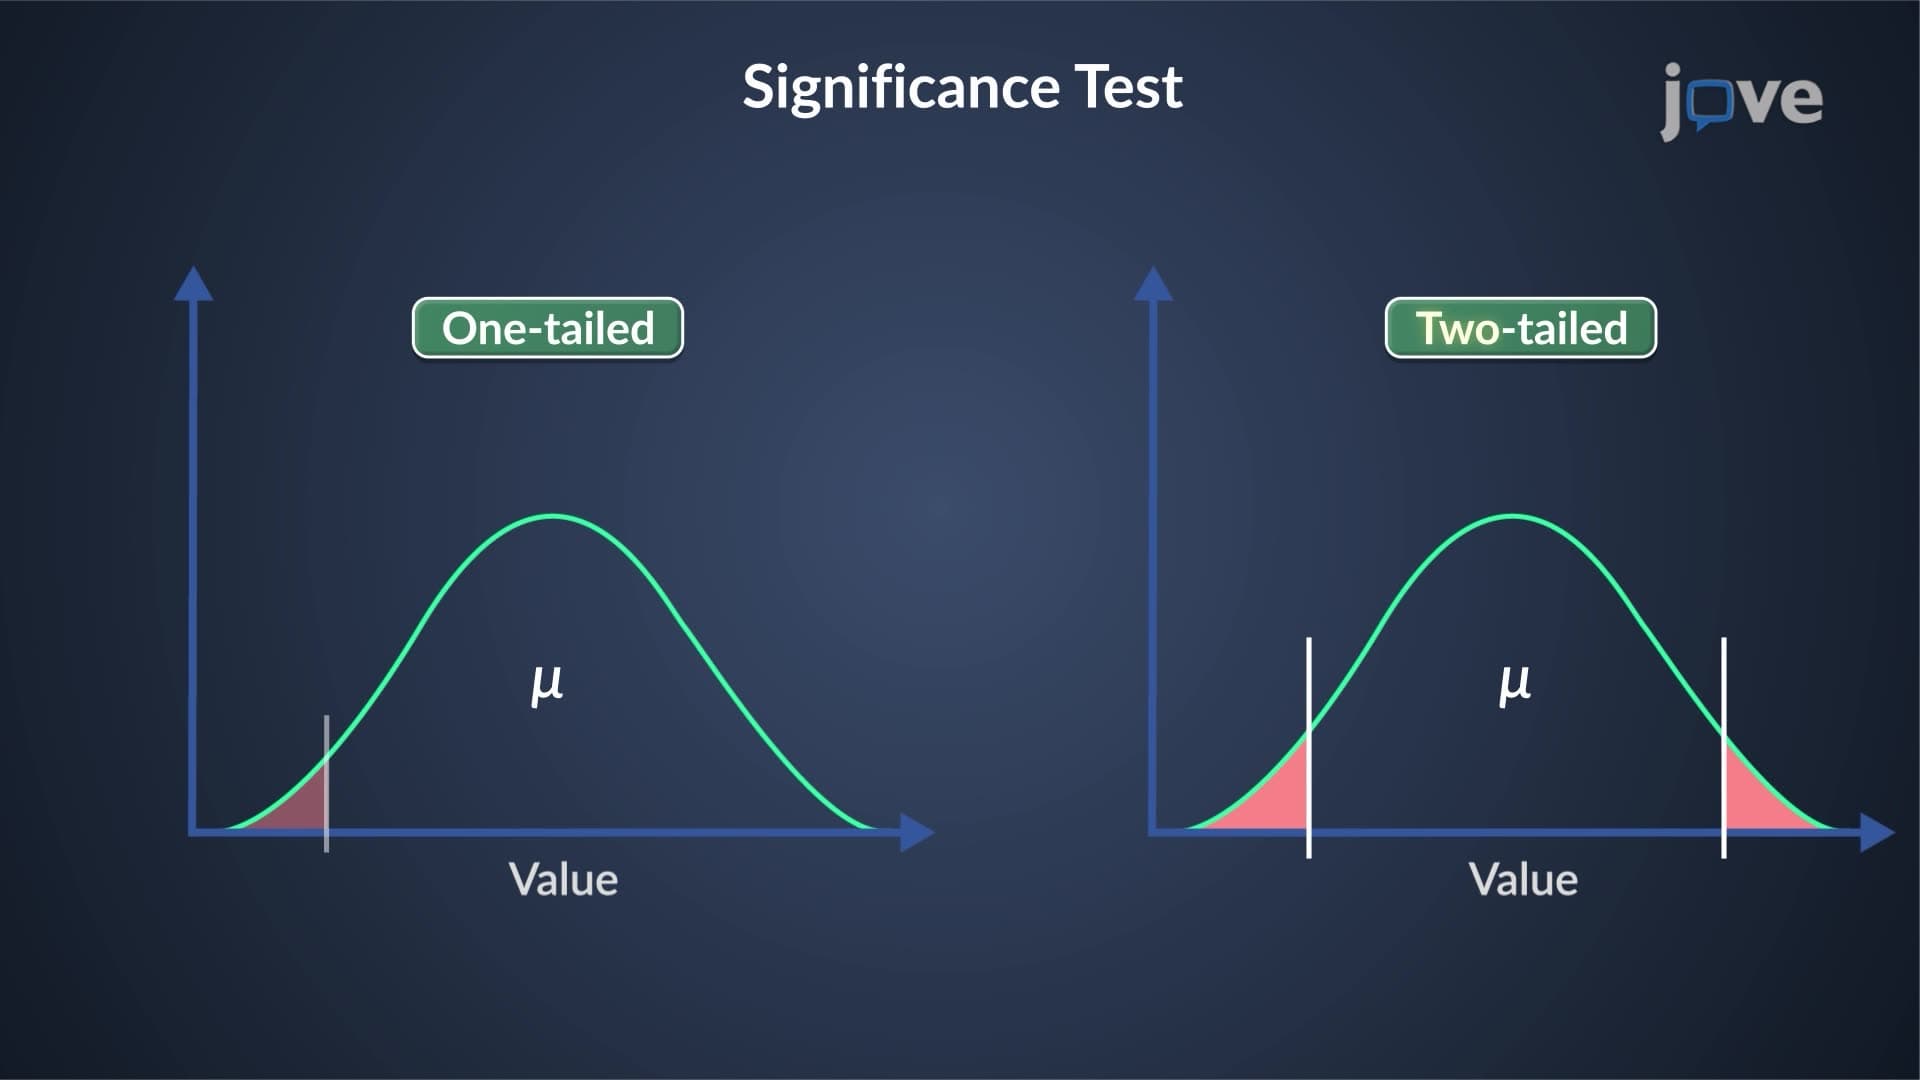
Understanding outlier rejection statistics requires grasping the null hypothesis framework underlying the Q test. The null hypothesis assumes the suspected data point belongs to the same population as other measurements. When experimental Q values exceed critical thresholds, researchers reject this hypothesis and remove the outlier. This decision-making process directly parallels hypothesis testing concepts essential for success in college statistics courses and standardized exams like the AP Statistics examination.
Frequently Asked Questions
The Q test is a statistical method that helps determine whether suspicious data points should be kept or removed from your dataset. You should use it when you have a small dataset (typically 3-10 measurements) and suspect one value is significantly different from the others. It's particularly useful in chemistry labs, quality control testing, and research experiments where data accuracy is critical.
AP Chemistry frequently includes Q test problems in laboratory-based free response questions, especially in data analysis sections worth 10-15% of the exam score. College analytical chemistry courses at universities like MIT and Caltech incorporate Q test calculations in laboratory reports and midterm exams. Students typically encounter these problems when analyzing titration results, spectroscopic data, or gravimetric analysis measurements.
The 99% confidence level requires higher Q values for outlier rejection compared to 95%, making it more stringent and less likely to remove legitimate data points. For example, with 5 data points, the critical Q value is 0.642 at 95% confidence but 0.780 at 99% confidence. MCAT and advanced chemistry courses typically use 95% confidence levels, while pharmaceutical and clinical applications often demand 99% confidence for safety reasons.
Johnson & Johnson's New Jersey pharmaceutical facilities use Q test analysis when manufacturing medications like Tylenol to ensure consistent active ingredient concentrations. If one batch shows 502mg acetaminophen per tablet while others show 498-501mg, quality control chemists apply the Q test to determine if this represents normal variation or a manufacturing defect requiring batch rejection.
The Q test is actually one of the more accessible statistical methods because it only requires basic arithmetic and table lookup skills. Unlike complex statistical procedures, you don't need advanced calculus or probability theory. High school algebra and the ability to arrange numbers in order are sufficient prerequisites for mastering Q test calculations.
Practice with real laboratory data sets and memorize the Q test formula and procedure steps. Create flashcards for common critical values (especially for n=3,4,5 data points at 95% confidence). Focus on understanding when to apply the test rather than just memorizing calculations, as exam questions often test conceptual understanding of outlier detection principles.
Grubbs' test for larger datasets, t-tests for comparing means between groups, and analysis of variance (ANOVA) for multiple group comparisons represent natural progressions. These concepts build on Q test principles while preparing you for advanced undergraduate statistics courses and graduate school research methods.
Related Micro-courses

19 Concepts

14 Concepts

17 Concepts