Loading subject page…

- Analytical Chemistry
- Chemical Applications of Statistical Analyses
- Significance Testing: Overview
Micro-course: Chemical Applications of Statistical Analyses
104,967 views
Learn key concepts and earn your certificate.



















Significance Testing: Overview

00:00
01:04
Video Summary: What Is Significance Testing
When pharmaceutical companies test new medications at facilities like the Mayo Clinic, they need to determine if observed improvements are genuine breakthroughs or just statistical noise. Significance testing explained through this lens reveals how scientists distinguish between real effects and random variation in data. This statistical method uses null hypothesis testing to evaluate whether differences between experimental groups exceed what chance alone could produce. The FDA relies on these analyses to approve life-saving treatments for millions of Americans. Watch the full video on JoVE Coach to master this concept with expert-led visuals and step-by-step explanations.
- Understand what significance testing is and how it determines whether observed differences are statistically meaningful or due to random error
- Identify the null hypothesis (no real difference exists) and alternative hypothesis (a real difference exists) in experimental scenarios
- Analyze the role of significance levels (alpha values) in setting confidence thresholds for hypothesis rejection
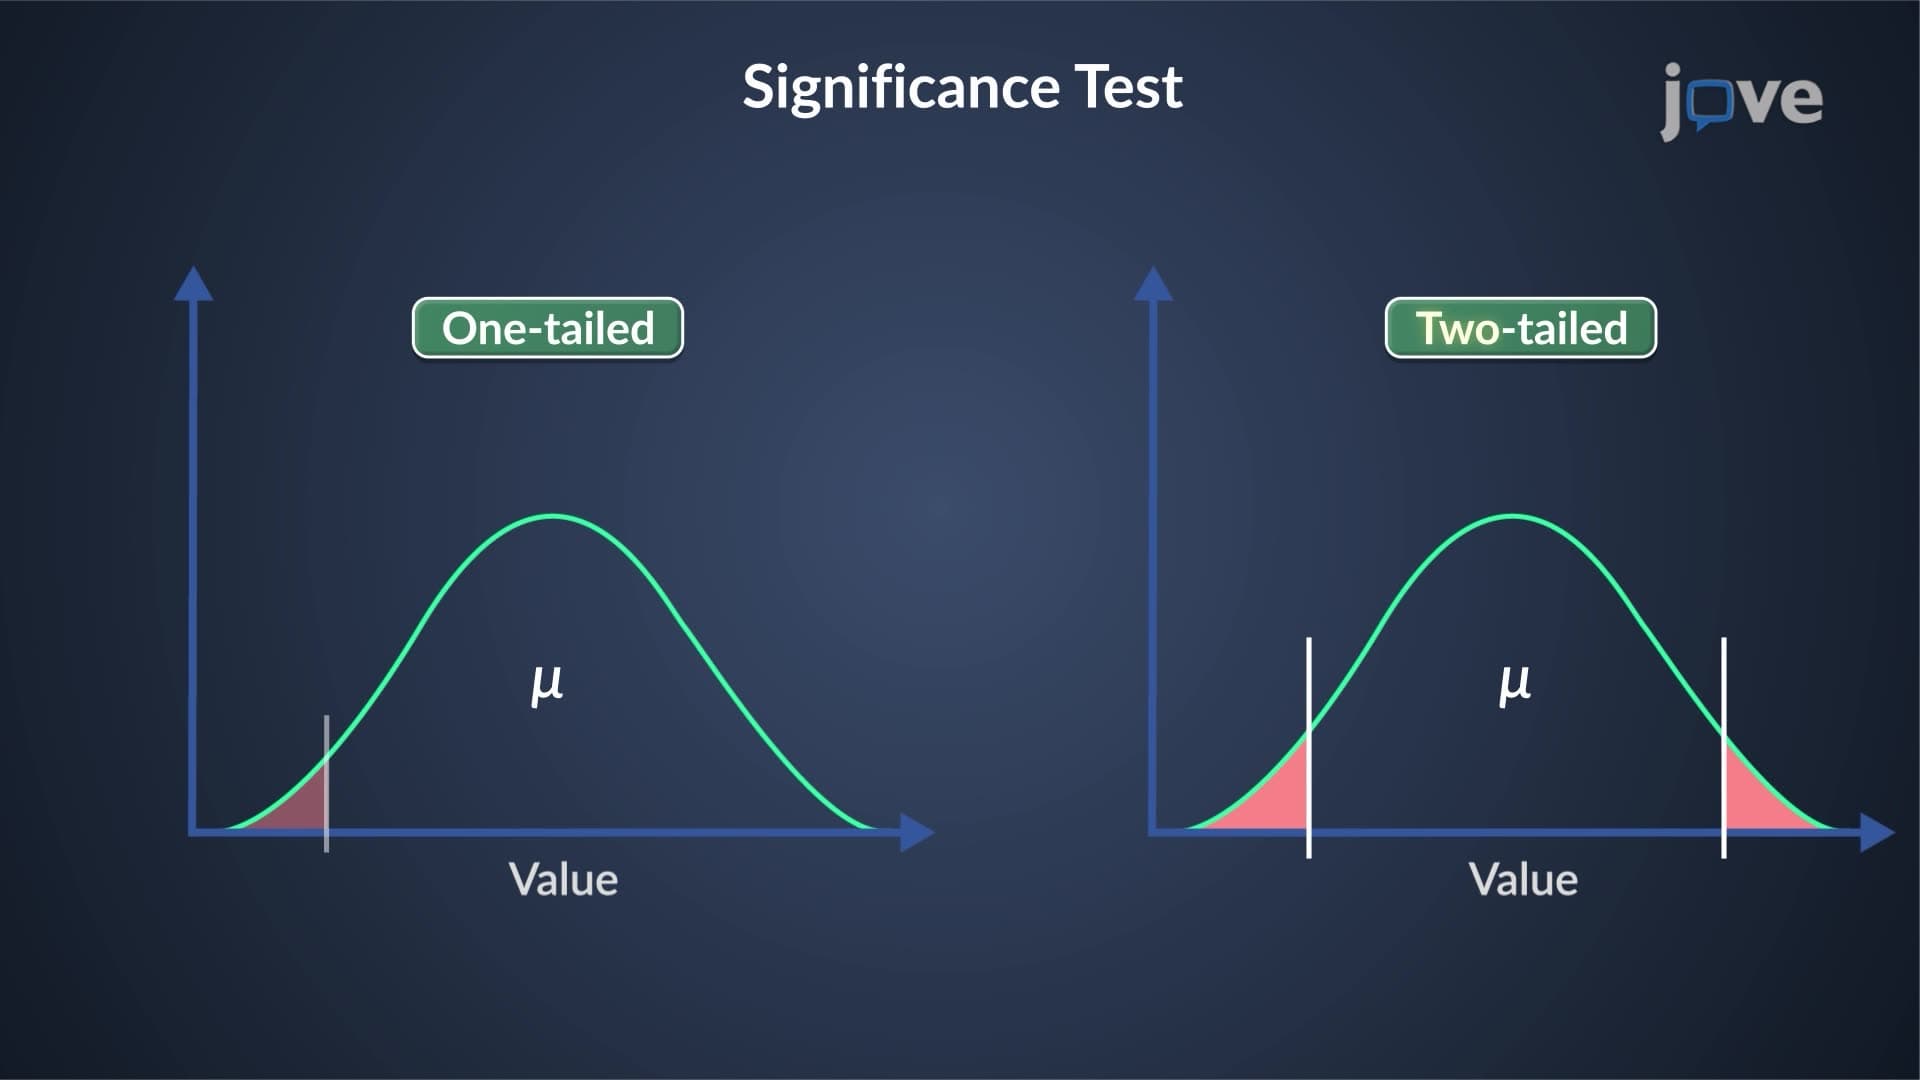
- Compare one-tailed versus two-tailed significance tests and determine which approach fits specific research questions
- Evaluate p-values against predetermined alpha levels to make statistical decisions about experimental results
- Apply significance testing principles to chemistry lab data, medical research, and quality control scenarios
- Recognize how Type I and Type II errors impact the reliability of statistical conclusions
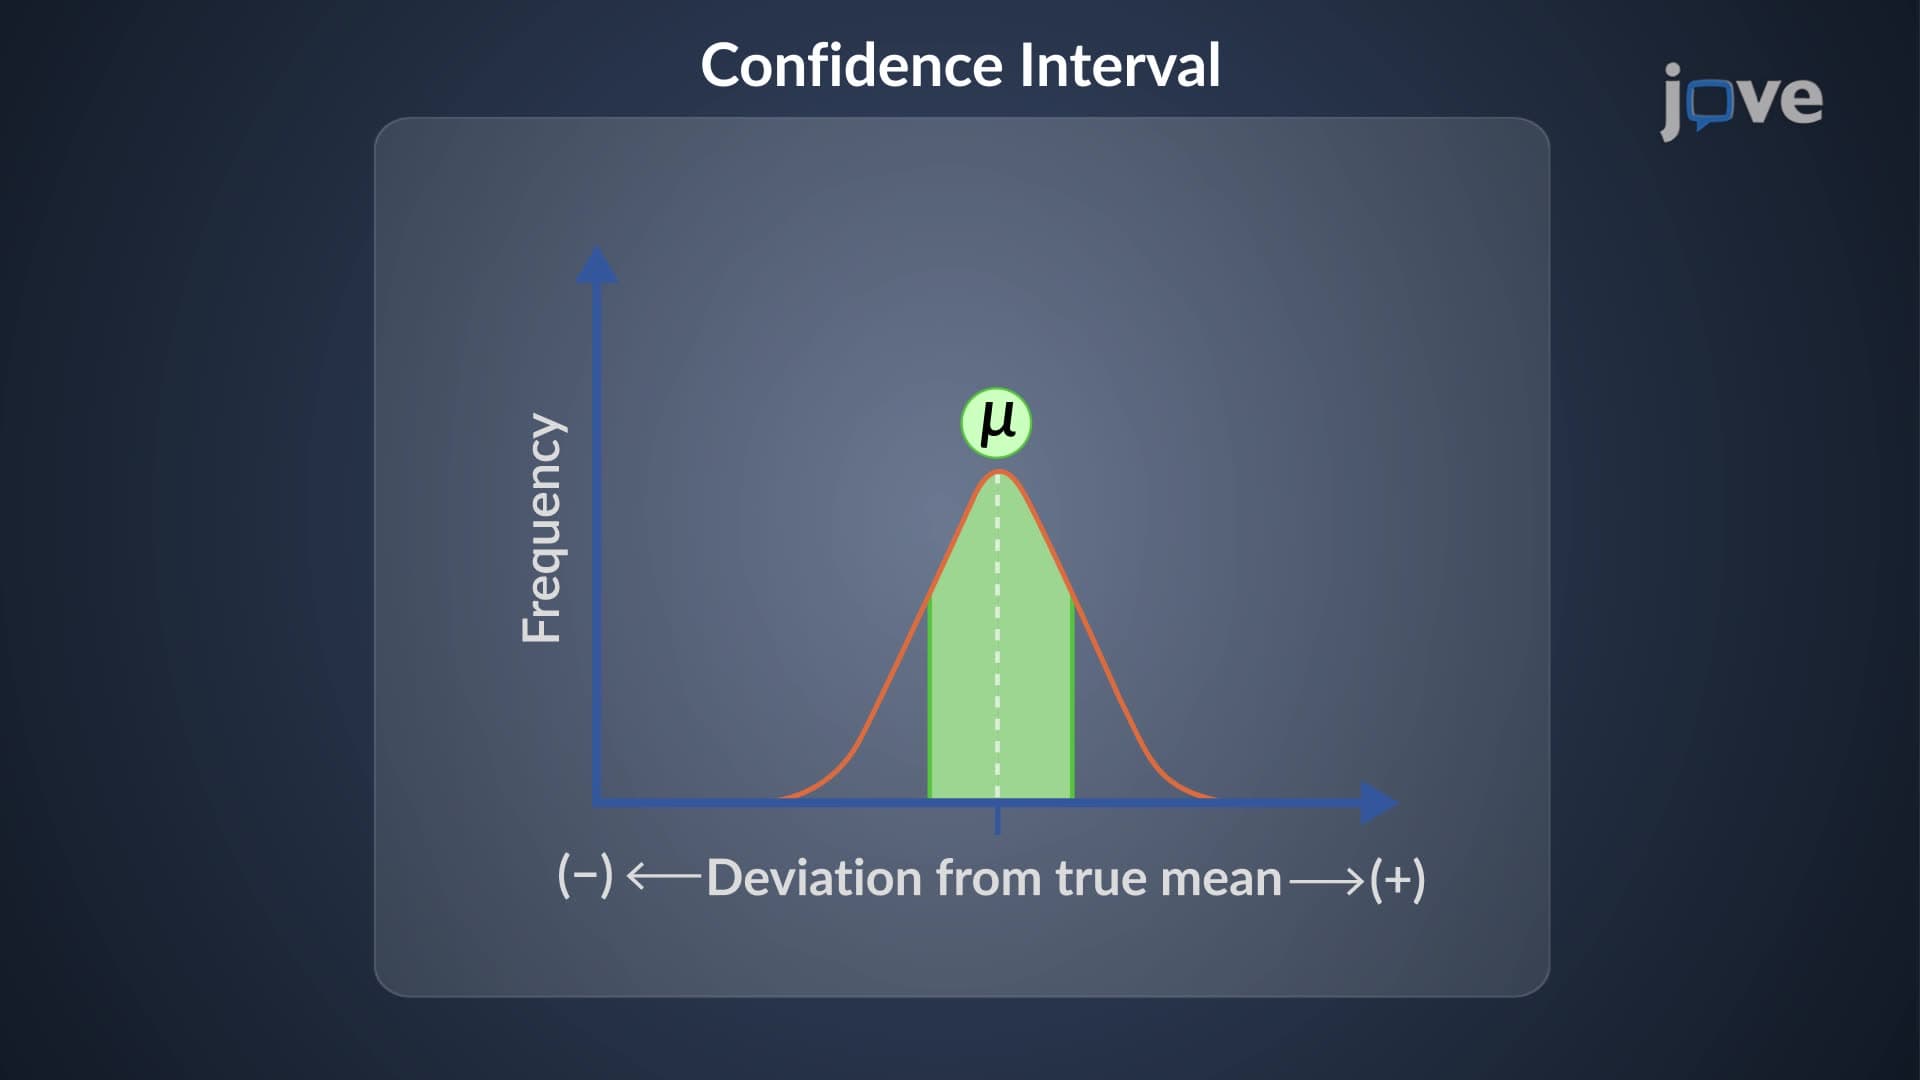
- Explore the connection between confidence intervals and significance testing in experimental design
Understanding What is Significance Testing
Significance testing forms the backbone of scientific decision-making, providing a systematic approach to determine whether experimental observations represent genuine effects or random fluctuations. This statistical method answers a fundamental question: "Is what we're seeing real, or could it have happened by chance?" In chemistry labs across American universities, students encounter this concept when comparing reaction yields, analyzing spectroscopic data, or evaluating the effectiveness of different catalysts.
The process centers on two competing explanations for observed differences. The null hypothesis proposes that no real difference exists between compared values-any variation stems from measurement uncertainty, instrument precision limits, or natural sample variation. Conversely, the alternative hypothesis suggests that observed differences reflect genuine, systematic effects that exceed what random error alone could produce.
Statistical Significance Thresholds and Alpha Levels
The significance level, denoted as alpha (α), establishes the threshold for statistical decision-making. Commonly set at 0.05 (5%), this value represents the maximum acceptable probability of incorrectly rejecting a true null hypothesis. When analytical chemistry students at institutions like UC Berkeley or MIT perform quantitative analyses, they use these predetermined thresholds to evaluate whether their experimental results demonstrate statistically significant differences.
P-value significance provides the crucial comparison metric. If the calculated p-value falls below the chosen alpha level, researchers reject the null hypothesis, concluding that observed differences likely represent real effects rather than random variation. This framework appears extensively in AP Chemistry courses and college-level analytical chemistry, where students learn to interpret statistical outputs from spectrophotometers, chromatographs, and other analytical instruments.
One-Tailed vs. Two-Tailed Testing Applications
The choice between one-tailed and two-tailed tests depends on the research question's directionality. One-tailed tests evaluate whether one value is significantly greater than (or less than) another, appropriate when investigating specific directional hypotheses. For example, testing whether a new pharmaceutical formulation increases drug bioavailability uses a one-tailed approach.
Two-tailed tests assess whether values differ significantly in either direction, without specifying which should be larger. Quality control applications in pharmaceutical manufacturing typically employ two-tailed tests to ensure product specifications fall within acceptable ranges. Students preparing for the MCAT encounter both approaches in research methodology questions, particularly in sections covering experimental design and data interpretation.
Real-World Applications in American Industries
Statistical significance in chemistry extends far beyond academic settings. Environmental testing laboratories use significance testing to determine whether pollutant levels exceed regulatory thresholds established by the EPA. Food and Drug Administration protocols require pharmaceutical companies to demonstrate statistical significance in clinical trial outcomes before approving new medications. Even brewing companies like Anheuser-Busch employ these methods to maintain consistent product quality across manufacturing facilities.
Frequently Asked Questions
Significance testing is a statistical method that determines whether observed differences between experimental groups are genuine effects or just random variation. It's crucial because it helps scientists distinguish between real discoveries and statistical noise, preventing false conclusions that could waste resources or mislead future research. This approach forms the foundation of evidence-based decision-making in fields from medicine to environmental science.
AP Chemistry questions often present experimental data requiring students to determine if differences between treatments are statistically significant. Students must identify null and alternative hypotheses, interpret p-values, and explain whether results support or reject proposed explanations. These concepts typically appear in free-response questions involving experimental design and data analysis sections.
Statistical significance indicates that observed differences probably aren't due to chance, while practical significance considers whether those differences matter in real-world applications. A new catalyst might show statistically significant improvement in reaction yield, but if the increase is only 0.1%, it may lack practical value for industrial processes. Both considerations are essential for meaningful scientific conclusions.
Not at all-significance testing concepts build naturally on basic probability and statistics covered in Algebra II and AP Statistics. High school chemistry students regularly encounter these ideas when analyzing lab data and comparing experimental results. Starting with simple examples like comparing two sample means helps students grasp the underlying logic before tackling more complex applications.
Focus on understanding the conceptual framework rather than memorizing formulas. Practice identifying null and alternative hypotheses from experimental descriptions, interpreting p-values in context, and recognizing appropriate test types for different research questions. Review how significance testing applies to medical research scenarios, as MCAT passages often feature clinical trial data requiring statistical interpretation.
Pharmaceutical companies use significance testing to compare drug effectiveness against placebos, evaluate side effect profiles between treatment groups, and assess bioequivalence of generic medications. Clinical trials at institutions like Johns Hopkins or the Cleveland Clinic rely on these methods to determine whether new treatments show genuine therapeutic benefits. FDA approval processes require demonstrating statistical significance across multiple trial phases.
Type I errors occur when researchers incorrectly reject a true null hypothesis, claiming significance when differences are actually random. Type II errors involve failing to detect genuine effects, accepting a false null hypothesis. The chosen significance level (alpha) directly controls Type I error probability, while factors like sample size and effect magnitude influence Type II error rates. Balancing these error types is crucial for reliable scientific conclusions.
Build toward confidence intervals, which provide range estimates complementing significance test results. Explore analysis of variance (ANOVA) for comparing multiple groups simultaneously, and regression analysis for examining relationships between continuous variables. These advanced techniques expand your statistical toolkit for complex research questions commonly encountered in upper-level chemistry and biology courses.
Manufacturing companies use significance testing to monitor production consistency, comparing current batch properties against established standards. Pharmaceutical quality control labs test whether active ingredient concentrations fall within specified ranges, while food processors verify that nutritional content meets labeling requirements. Environmental monitoring programs use these methods to detect pollution trends and assess remediation effectiveness across industrial sites.
Related Micro-courses

19 Concepts

14 Concepts

17 Concepts