Loading subject page…

- Analytical Chemistry
- Chemical Applications of Statistical Analyses
- Comparing Experimental Results: Student's t-Test
Micro-course: Chemical Applications of Statistical Analyses
104,967 views
Learn key concepts and earn your certificate.








Comparing Experimental Results: Student's t-Test

00:00
01:09
Video Summary: What Is T Test
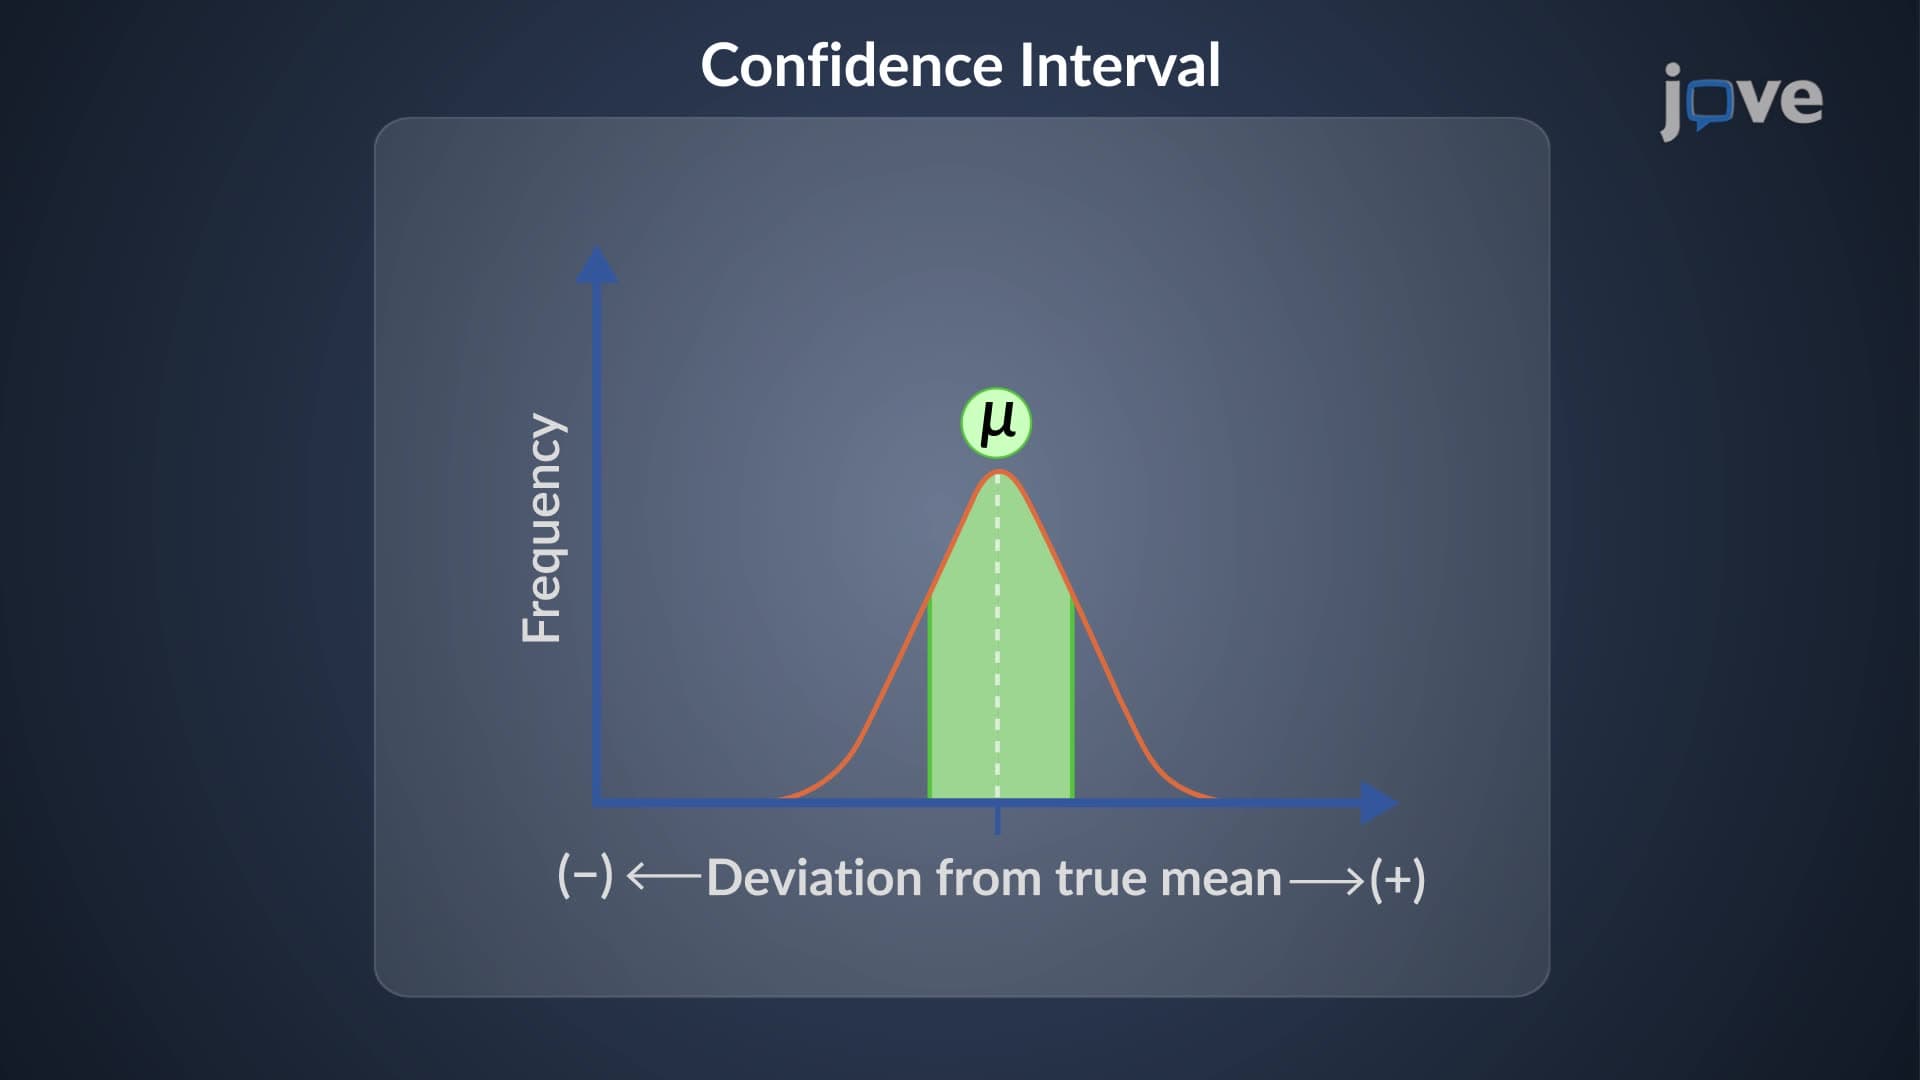
Did you know that pharmaceutical companies like Pfizer use T test explained methods to determine if new medications are statistically better than existing treatments? A T test compares means between groups or against known values to assess statistical significance. For example, researchers might use this analysis to compare cholesterol levels before and after a new drug treatment in clinical trials. This fundamental statistical tool helps scientists distinguish real effects from random variation in experimental data. Watch the full video on JoVE Coach to master this concept with expert-led visuals and step-by-step explanations.
- Understand what is T Test and how it determines statistical significance between sample means
- Identify the three main types: one-sample, paired, and two-sample T tests
- Analyze the difference between paired T test data (related measurements) and unpaired data (independent groups)
- Compare one-tailed versus two-tailed T tests based on research hypotheses
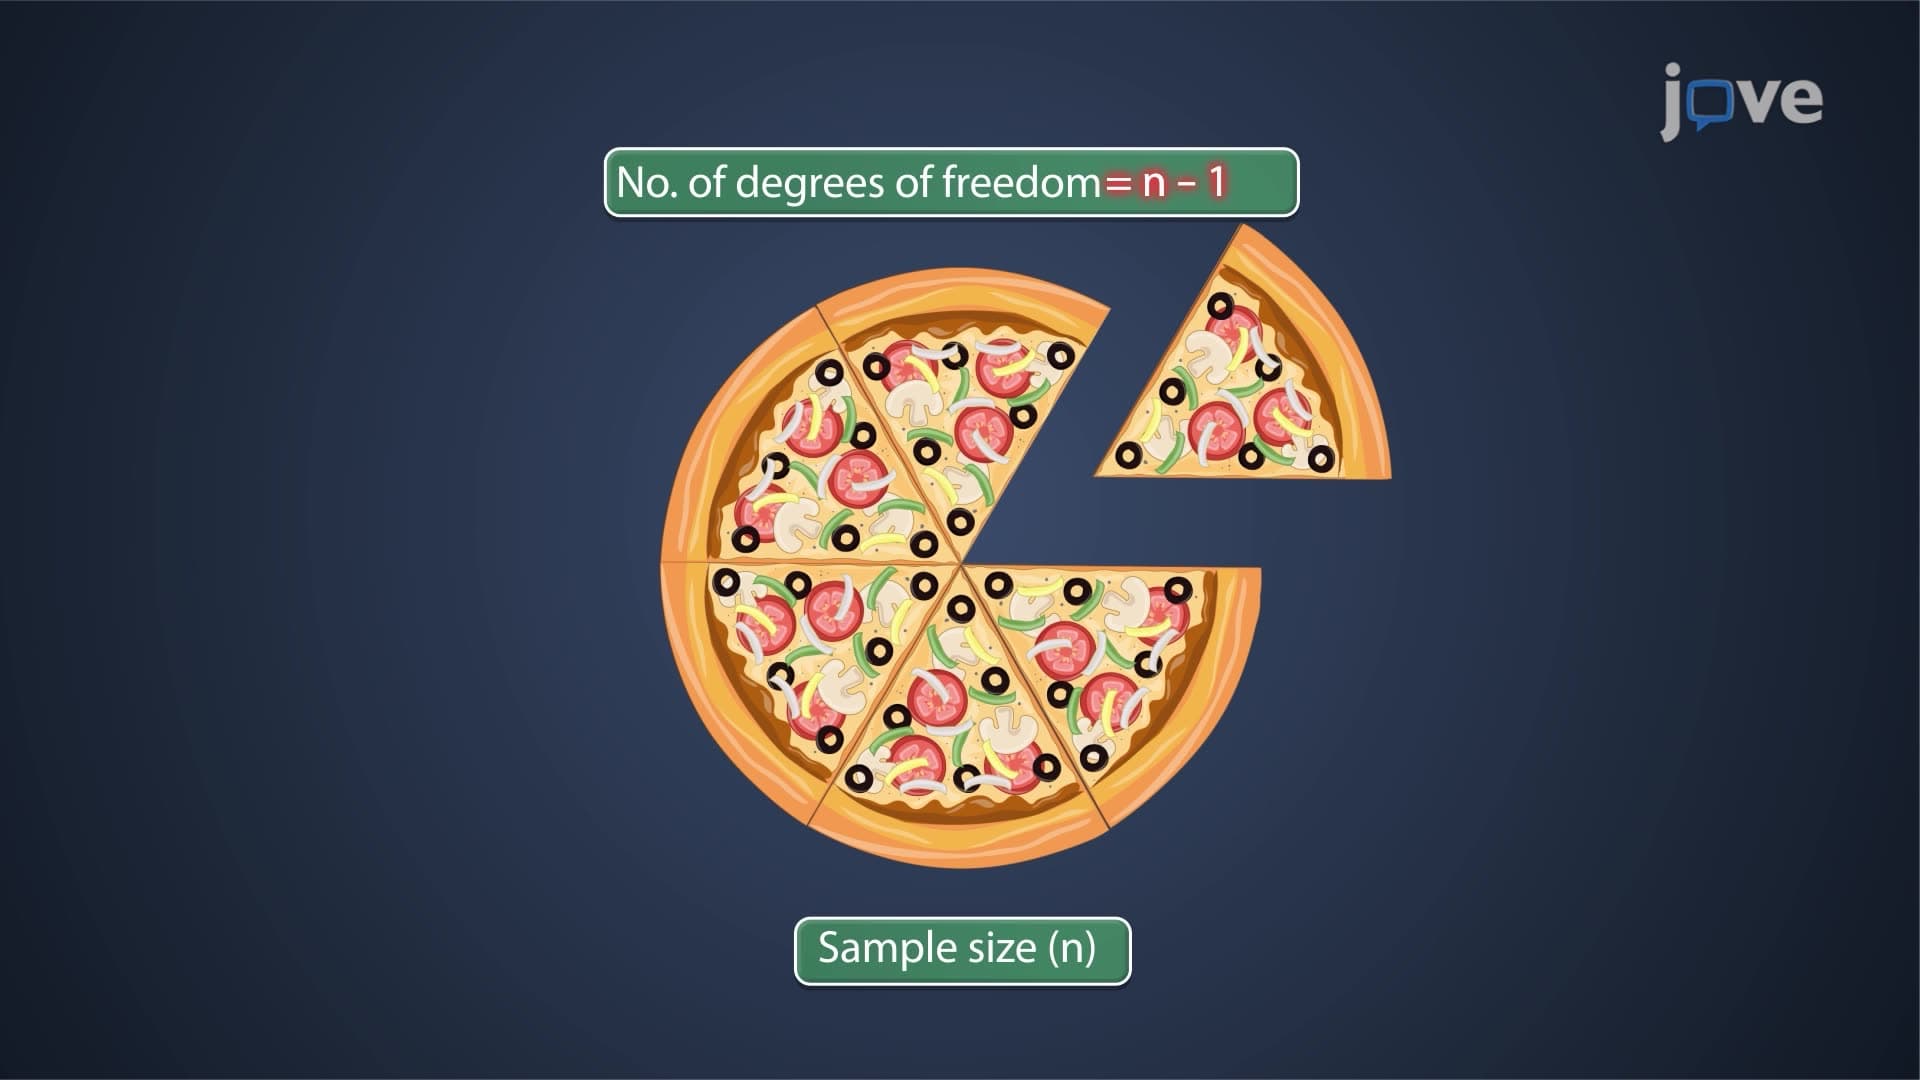
- Evaluate T test significance level results using critical values and degrees of freedom
- Apply student T test statistics to real laboratory and research scenarios
- Recognize when to use T test vs Z test based on sample size and population parameters
- Explore how to perform a T test using proper statistical methodology and interpretation
Understanding What is T Test: Foundation and Purpose
The T test stands as one of the most fundamental statistical tools in scientific research, designed to determine whether observed differences between groups are statistically significant or simply due to random chance. Named after statistician William Sealy Gosset (who published under the pseudonym "Student"), this test becomes essential when working with small sample sizes or unknown population standard deviations.
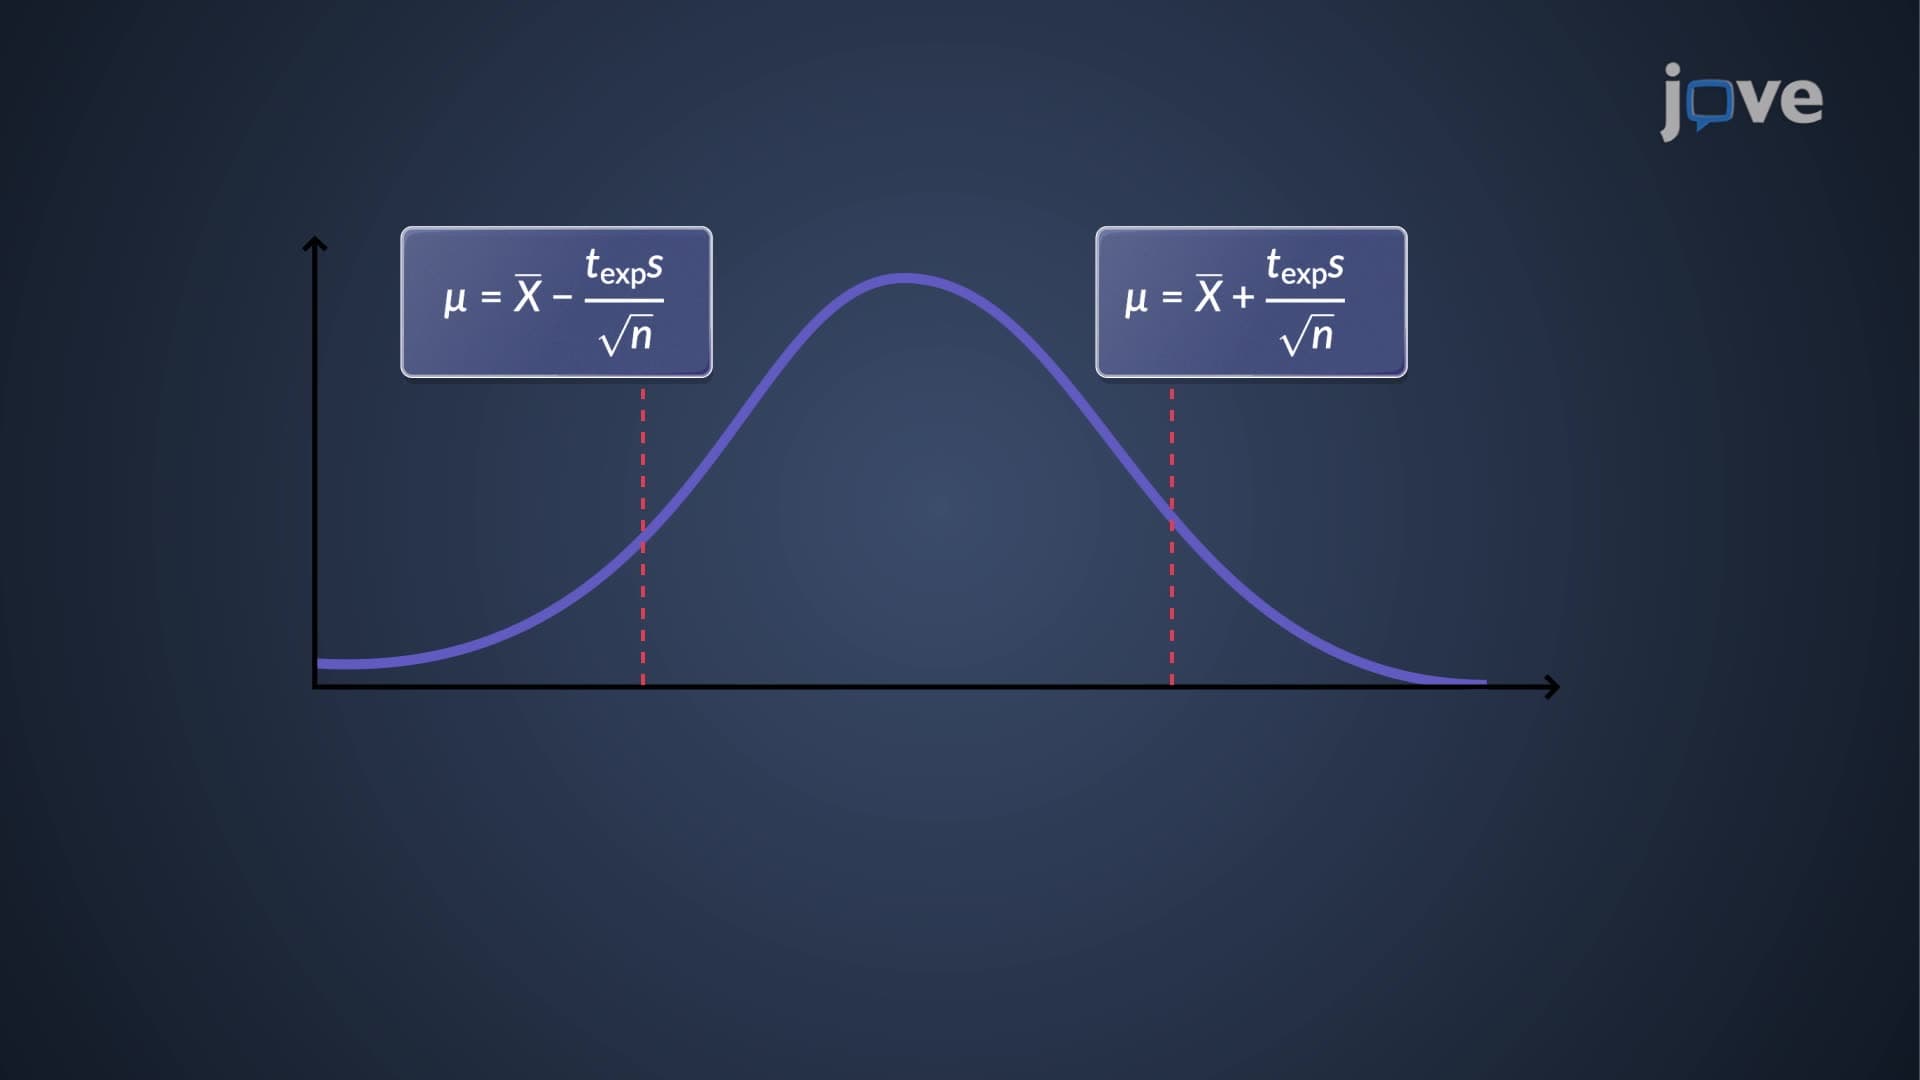
In T test in chemistry analysis, researchers frequently encounter situations where they need to validate analytical methods, compare instrument precision, or assess whether a new analytical technique produces significantly different results than established methods. The test operates by calculating a test statistic that follows the t-distribution, which accounts for the additional uncertainty present in smaller datasets.
Types of T Tests and Their Applications
The one-sample T test compares a sample mean against a known or hypothesized population value. For instance, if the EPA sets a maximum lead concentration of 15 parts per billion in drinking water, environmental scientists would use this test to determine if their water samples significantly exceed this threshold.
Paired T test scenarios involve comparing two related measurements from the same subjects or experimental units. Medical researchers studying blood pressure medications might measure patients' systolic pressure before and after treatment, using paired analysis to account for individual baseline differences. This approach increases statistical power by controlling for subject-specific variation.
Two-sample T tests (unpaired) compare means between independent groups. Educational researchers might compare SAT math scores between students who used online tutoring versus traditional classroom instruction, treating these as separate, unrelated groups.
Statistical Interpretation and Practical Considerations
The T test significance level, typically set at 0.05 (5%), determines the threshold for rejecting the null hypothesis. When the calculated t-statistic exceeds the critical value from statistical tables, researchers conclude that observed differences are statistically significant rather than due to sampling variation.
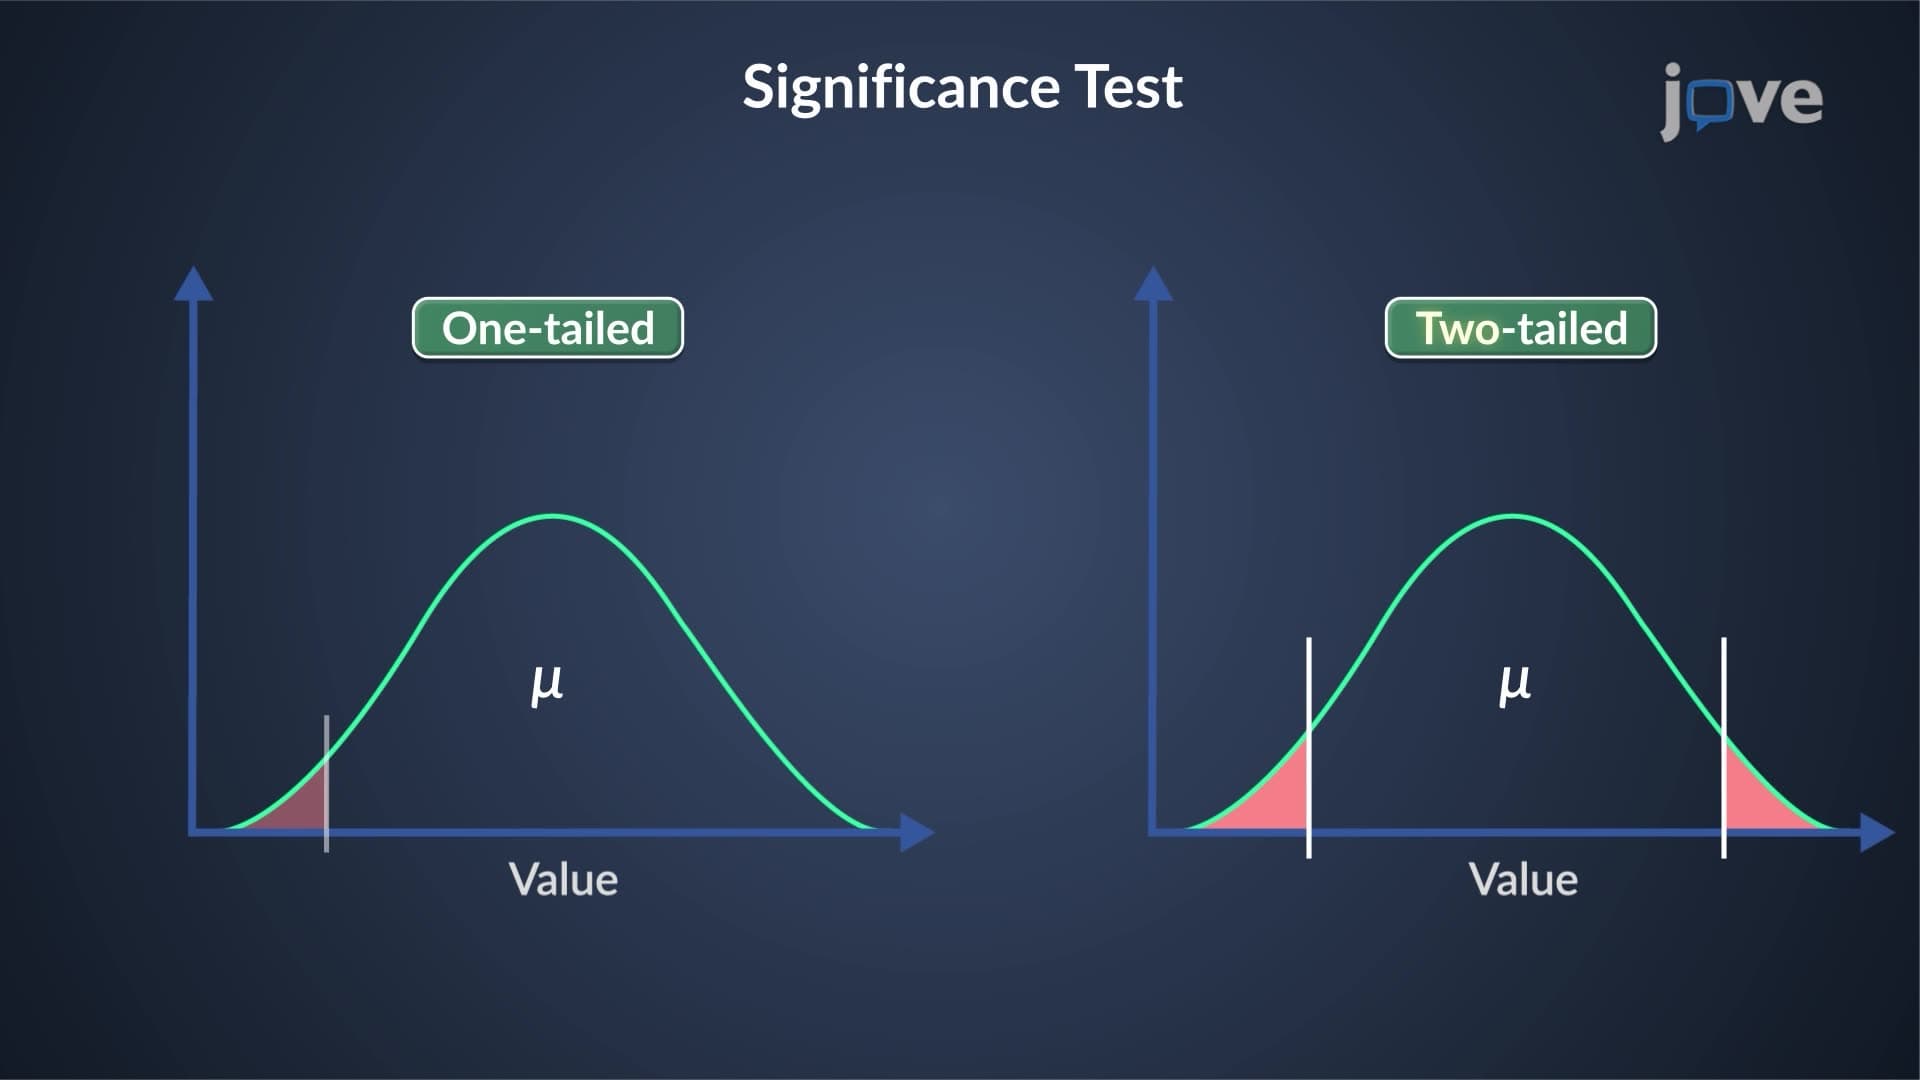
One-tailed tests focus on detecting differences in a specific direction (only increases or only decreases), while two-tailed tests can detect differences in either direction. AP Statistics students learn that one-tailed tests provide more statistical power when the research hypothesis predicts a specific directional effect.
Understanding T test vs Z test distinctions proves crucial for proper statistical analysis. T tests accommodate smaller samples (typically n < 30) and unknown population standard deviations, while Z tests require larger samples and known population parameters. This knowledge appears frequently on MCAT and college statistics exams, where students must select appropriate statistical procedures for given scenarios.
Frequently Asked Questions
A T test determines if differences between sample means are statistically significant rather than due to random variation. Use it when comparing analytical methods, testing instrument precision, or validating that your results meet specification limits. It's particularly valuable for small sample sizes common in laboratory work.
AP Statistics frequently tests T test selection and interpretation through multiple-choice and free-response questions. Students must identify appropriate test types, calculate test statistics, and interpret p-values. The MCAT includes T test concepts in data analysis passages, especially in biological and chemical research contexts.
Paired T tests analyze related measurements from the same subjects (before/after treatment, left/right measurements). Unpaired T tests compare independent groups (treatment vs. control groups from different participants). Choose based on whether your data points have natural pairings or represent separate, unrelated samples.
Pharmaceutical researchers use T tests to compare patient outcomes between treatment and placebo groups in clinical trials. They might test whether a new diabetes medication significantly lowers blood glucose compared to existing treatments, helping determine if the drug merits FDA approval.
Not at all! The T test builds on basic concepts you already know: means, standard deviations, and probability. Start with one-sample tests, then progress to paired and two-sample versions. Many graphing calculators and online tools handle the calculations, letting you focus on interpretation and application.
Practice identifying which T test type fits different scenarios, memorize the key assumptions (normal distribution, independence), and work through interpretation examples. Create a decision tree: one group vs. known value = one-sample; related pairs = paired; independent groups = two-sample.
Progress to ANOVA (comparing multiple groups), chi-square tests (categorical data relationships), and regression analysis (predicting outcomes). These advanced techniques build on T test foundations and appear frequently in college research methods courses and graduate school entrance exams.
Use T tests for small samples (typically under 30) or when population standard deviation is unknown, which describes most real-world research situations. Z tests require large samples and known population parameters, making them less common in practical applications but important for theoretical understanding.
Related Micro-courses

19 Concepts

14 Concepts

17 Concepts