Loading subject page…

- Analytical Chemistry
- Molecular Vibrational Spectroscopy
- IR Spectrum Peak Intensity: Amount of IR-Active Bonds
Micro-course: Molecular Vibrational Spectroscopy
28,167 views
Learn key concepts and earn your certificate.




IR Spectrum Peak Intensity: Amount of IR-Active Bonds

00:00
00:55
Video Summary: Ir Spectrum Peak Intensity Amount Explained
Why do some peaks in an IR spectrum tower over others like skyscrapers in Manhattan's skyline? IR peak intensity amount directly correlates with the strength of molecular vibrations and sample concentration. When pharmaceutical companies at Pfizer analyze drug purity using infrared spectroscopy, concentrated samples produce dramatically stronger absorption peaks than diluted ones. Understanding IR spectrum peak intensity helps chemists determine both molecular structure and quantitative composition. Watch the full video on JoVE Coach to master this concept with expert-led visuals and step-by-step explanations.
- Understand how IR spectrum peak intensity amount relates to dipole moment strength and molecular bond characteristics
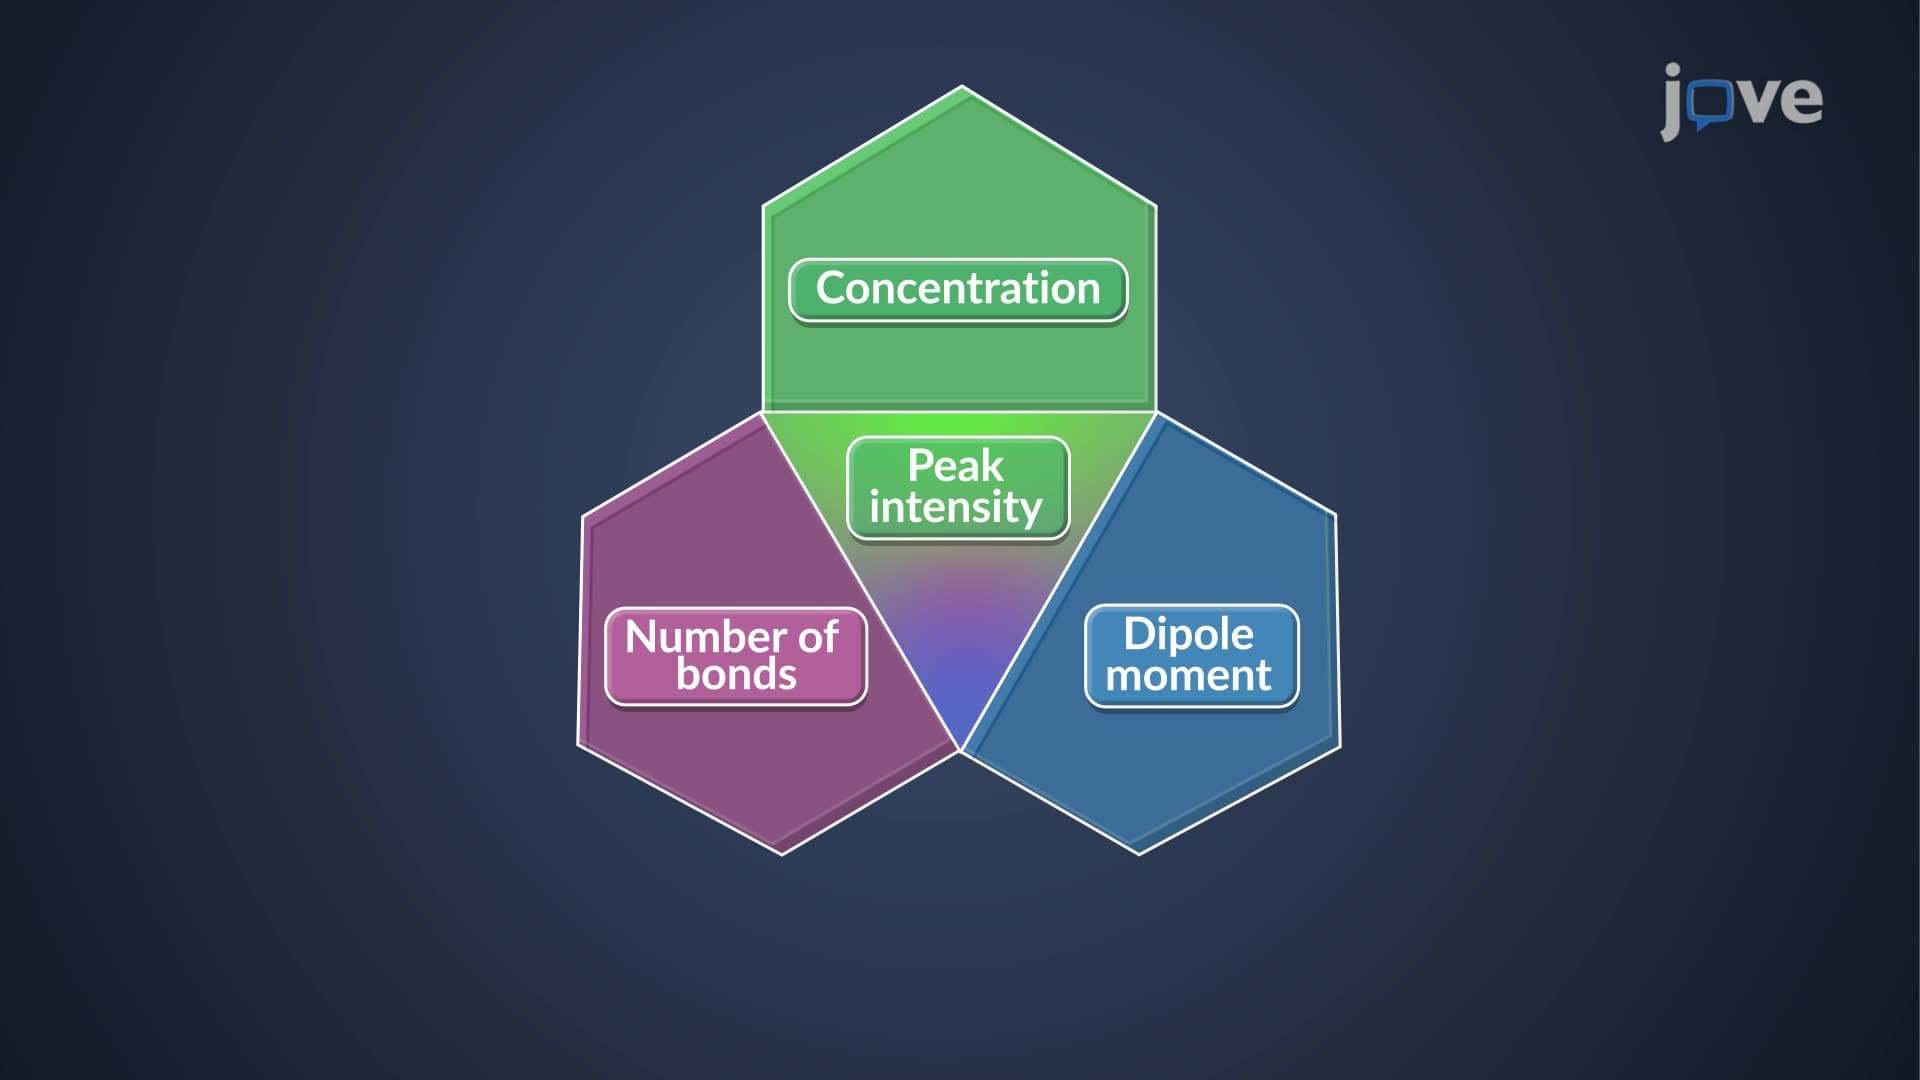
- Identify the three primary factors controlling IR peak intensity: sample concentration, number of IR-active bonds, and dipole moment magnitude
- Analyze the relationship between how concentration affects IR peak intensity in quantitative spectroscopic analysis
- Compare strong versus weak IR absorption peaks based on molecular dipole moments and bond polarity
- Evaluate Beer-Lambert law applications in determining sample concentration from IR peak heights
- Apply quantitative IR analysis principles to real laboratory scenarios and pharmaceutical quality control
- Recognize patterns in IR spectrum peak intensity concentration relationships for different functional groups
- Explore connections between molar absorptivity values and observed IR peak intensities in experimental data
Understanding IR Spectrum Peak Intensity Amount Fundamentals
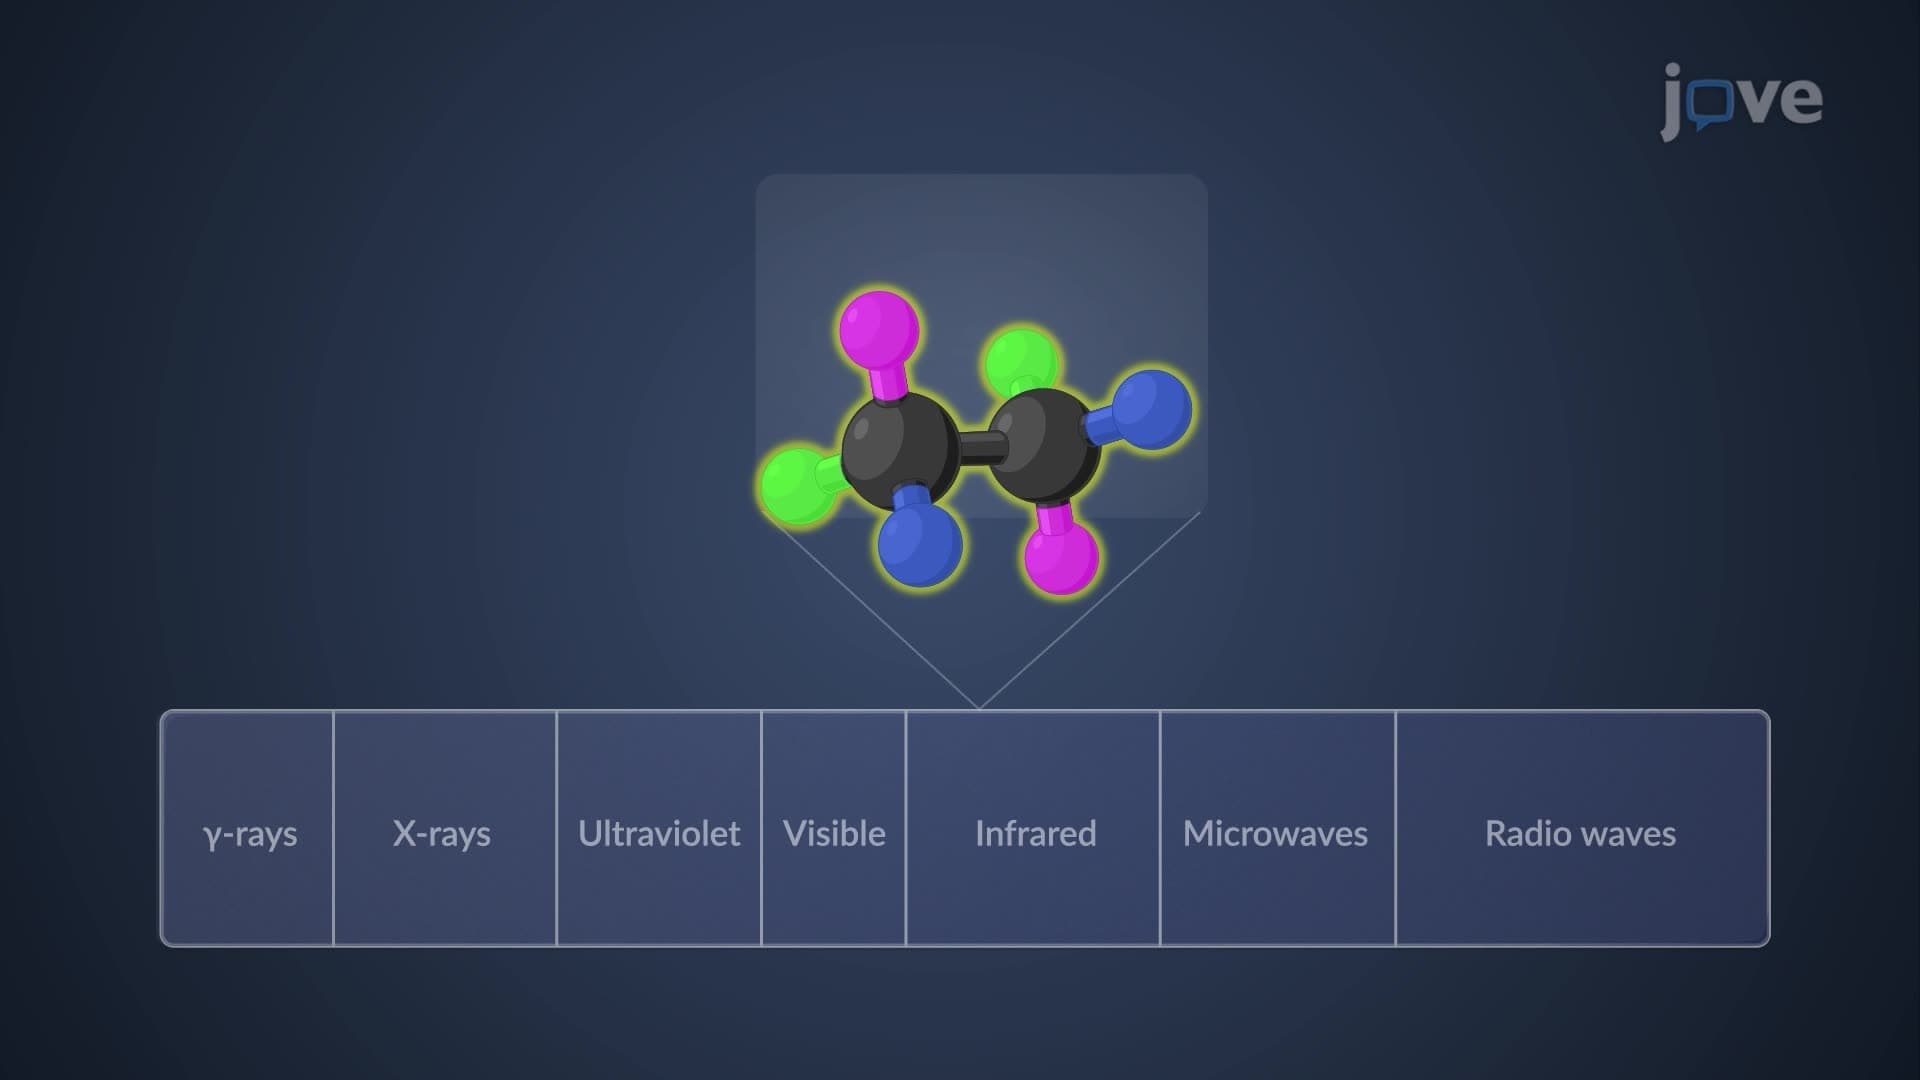
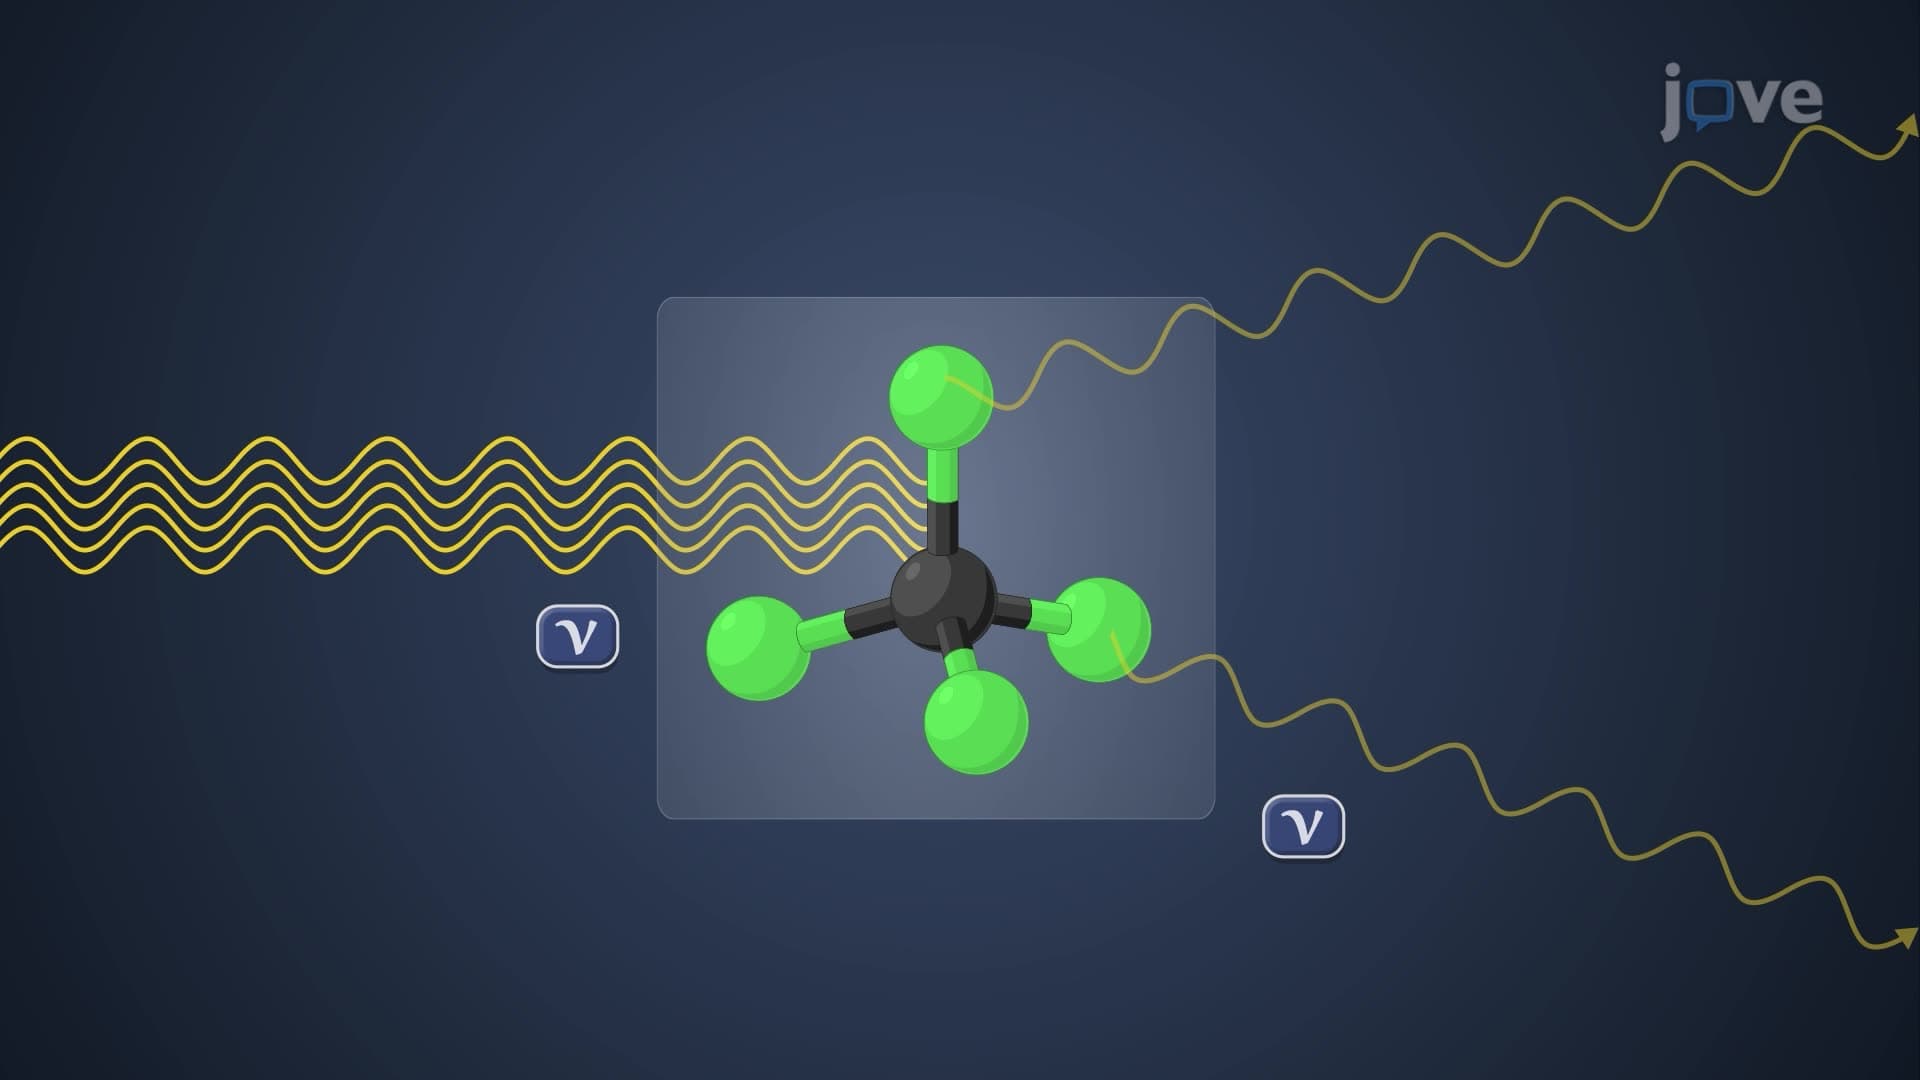
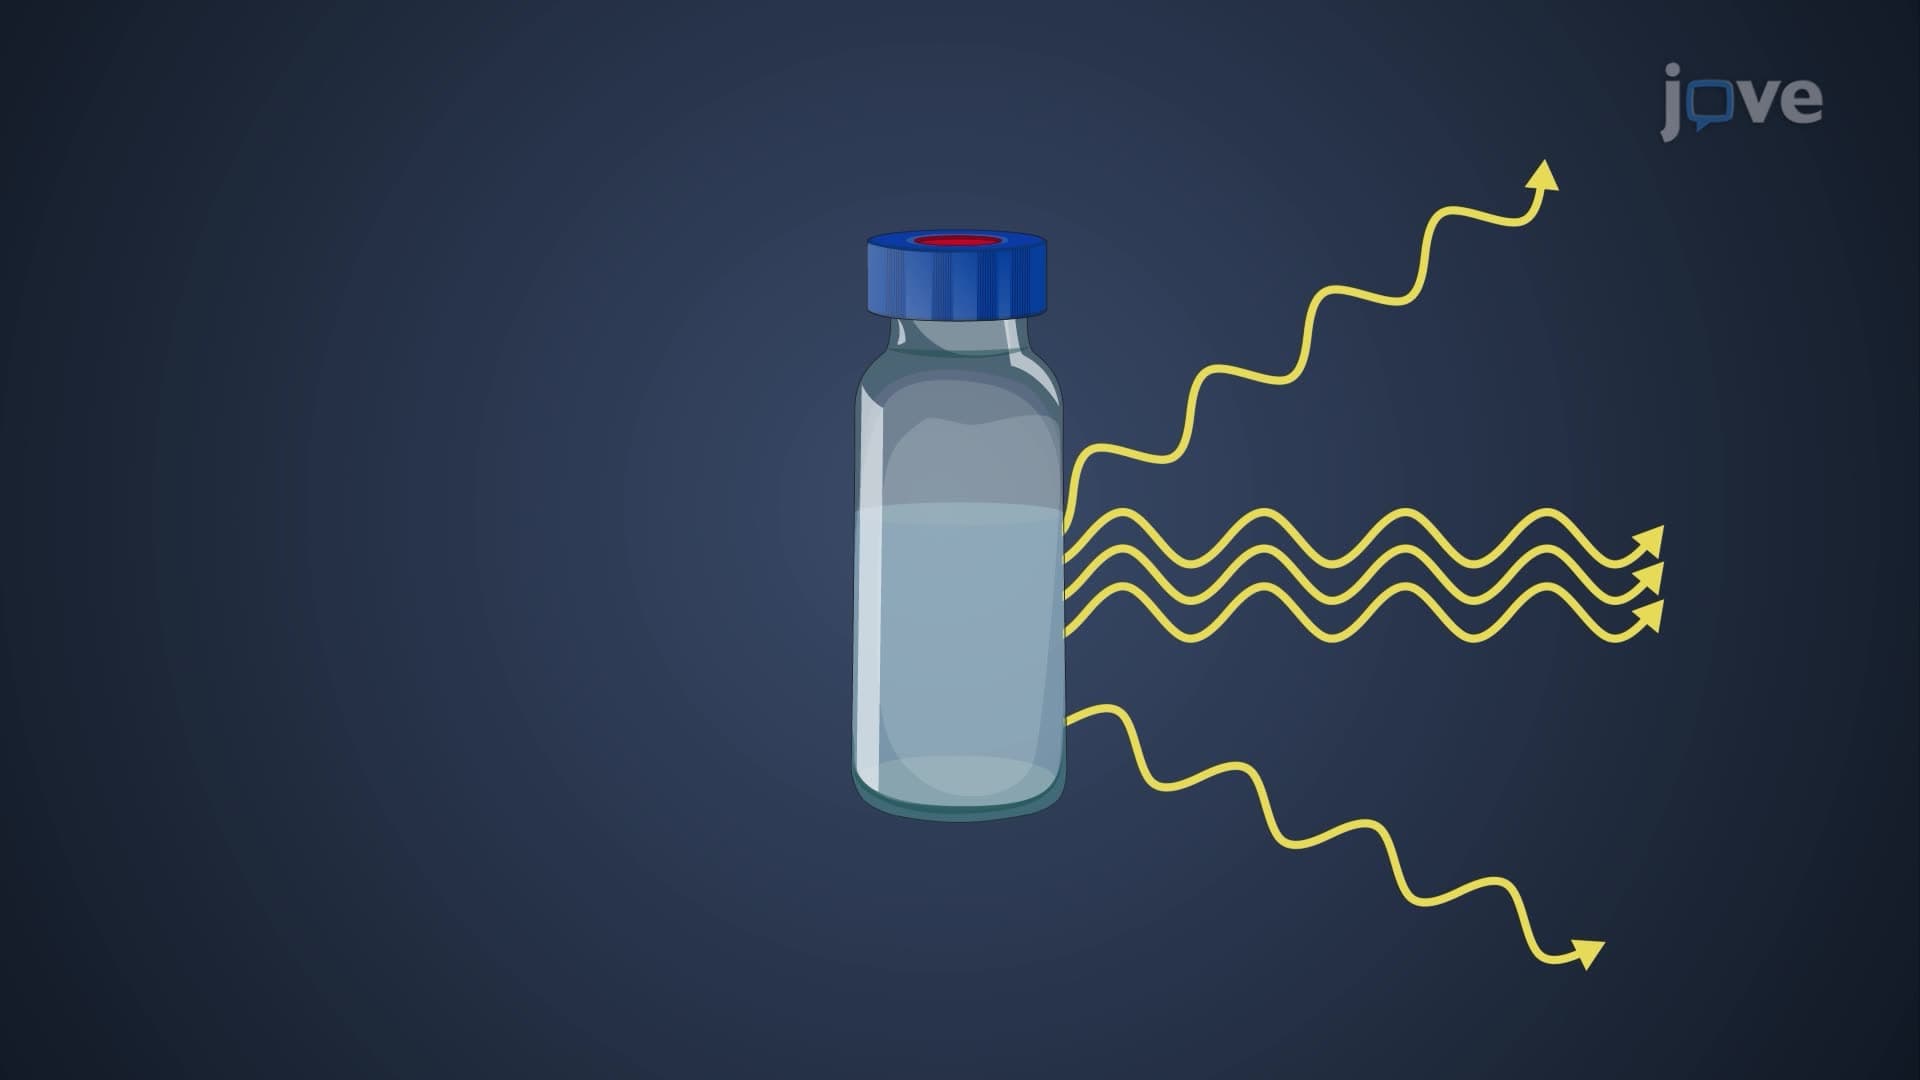
IR spectrum peak intensity amount reflects the efficiency of infrared light absorption by molecular bonds during vibrational transitions. When molecules absorb IR radiation, bonds stretch and bend at characteristic frequencies, creating the distinctive peak patterns chemists use for structural identification. The intensity of each peak provides crucial quantitative information beyond simple molecular fingerprinting.
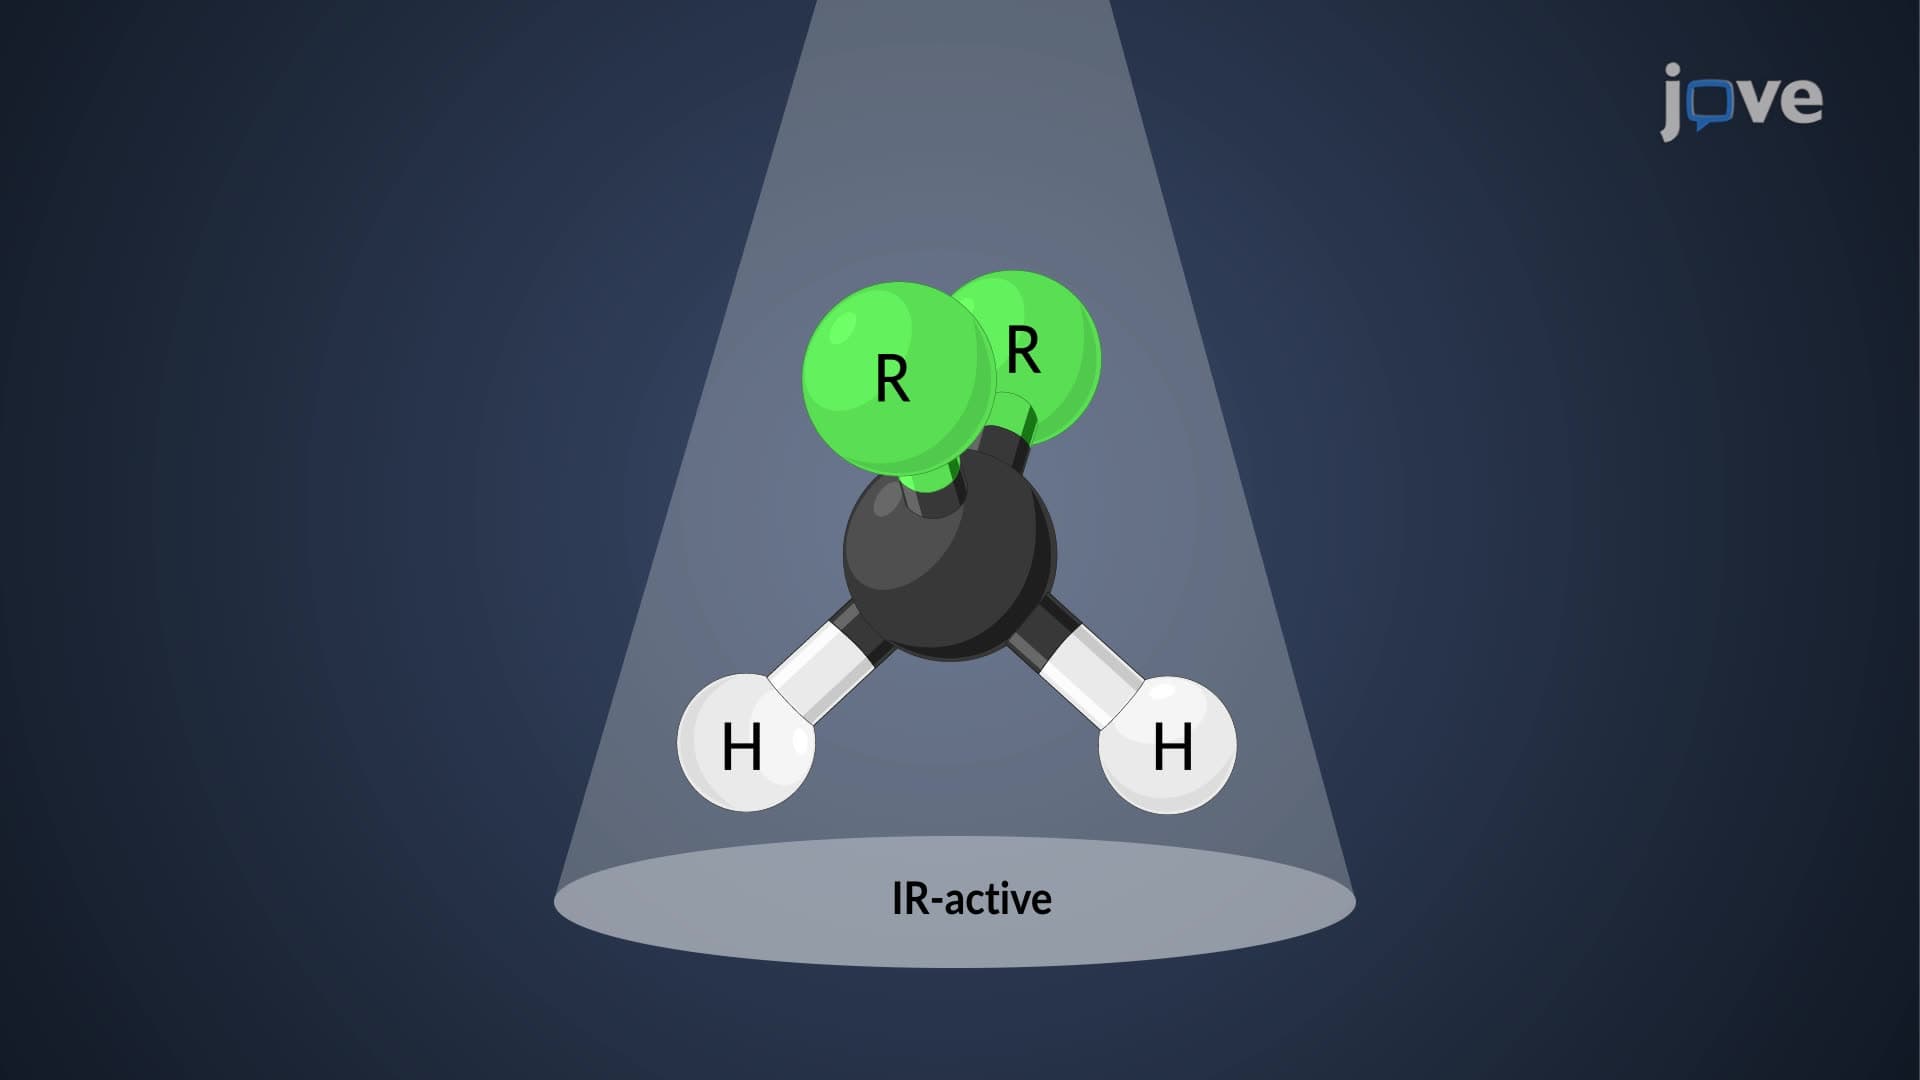
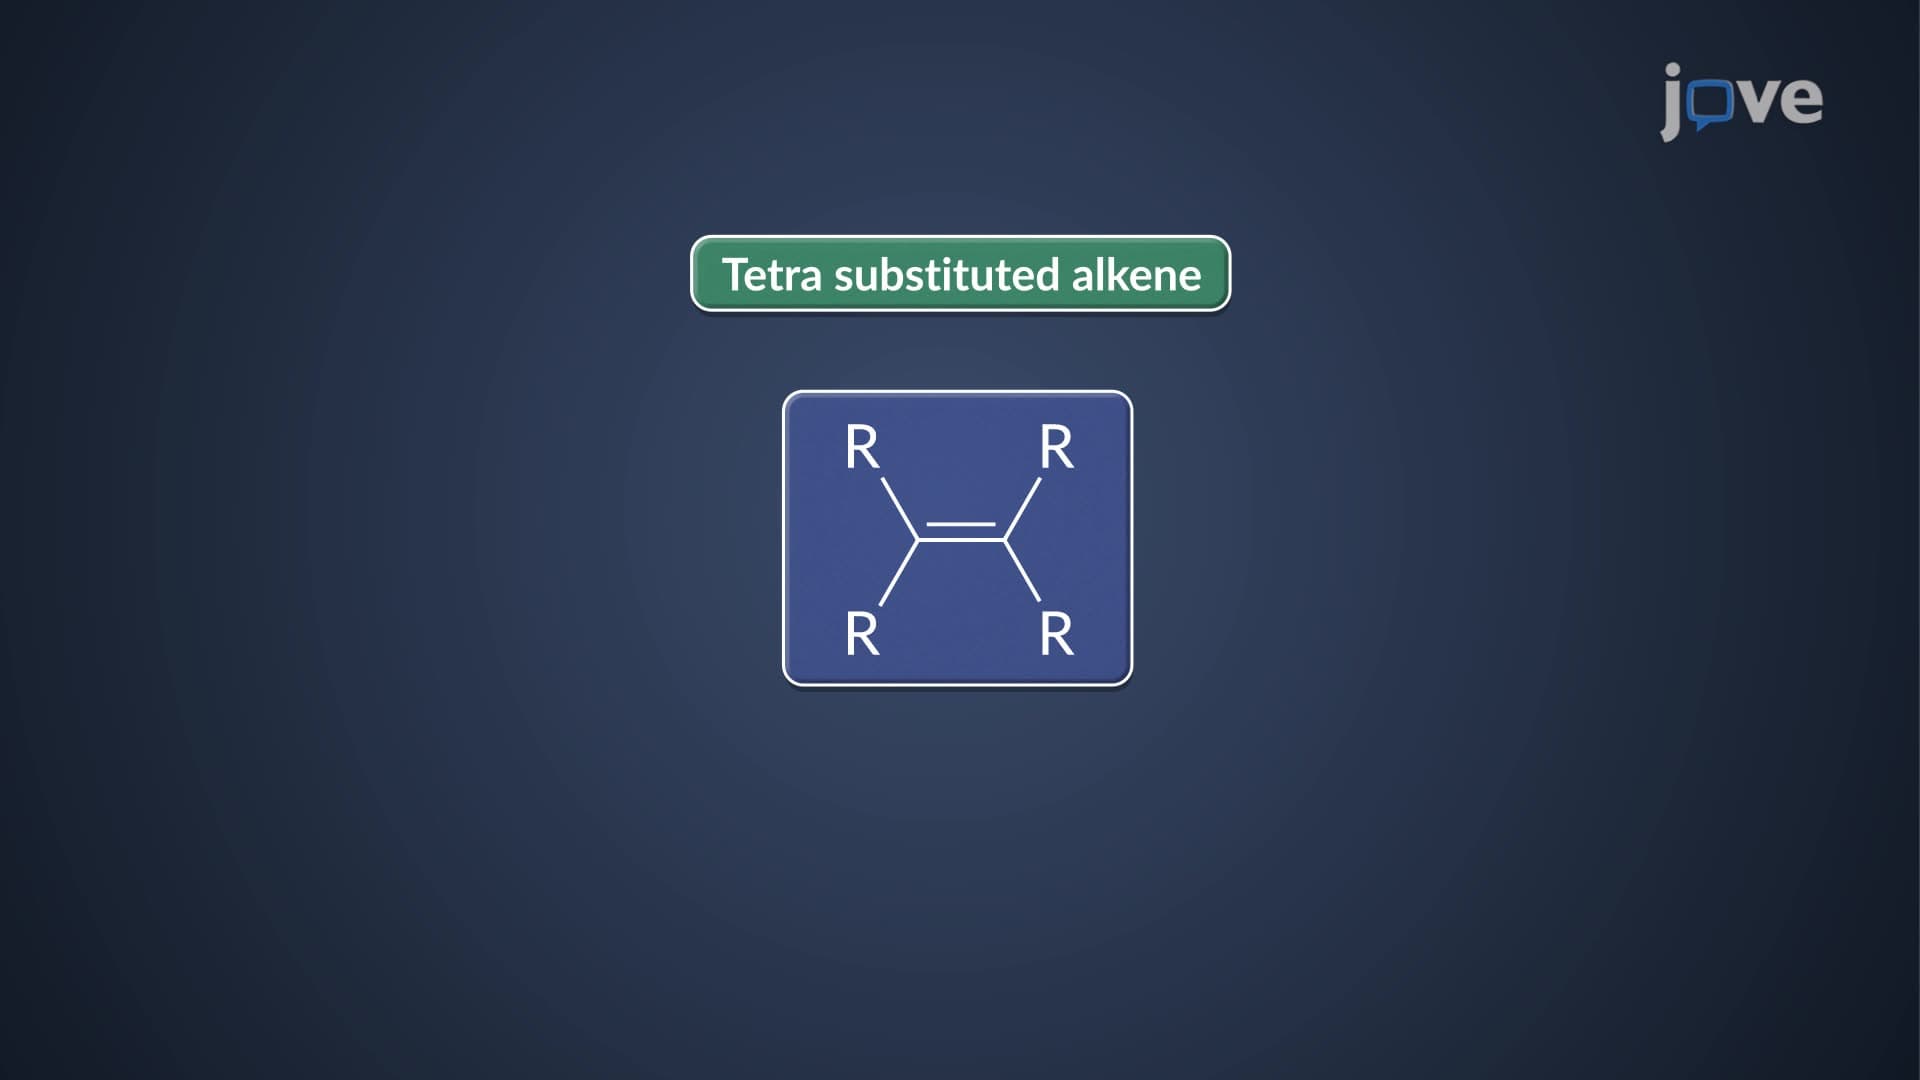
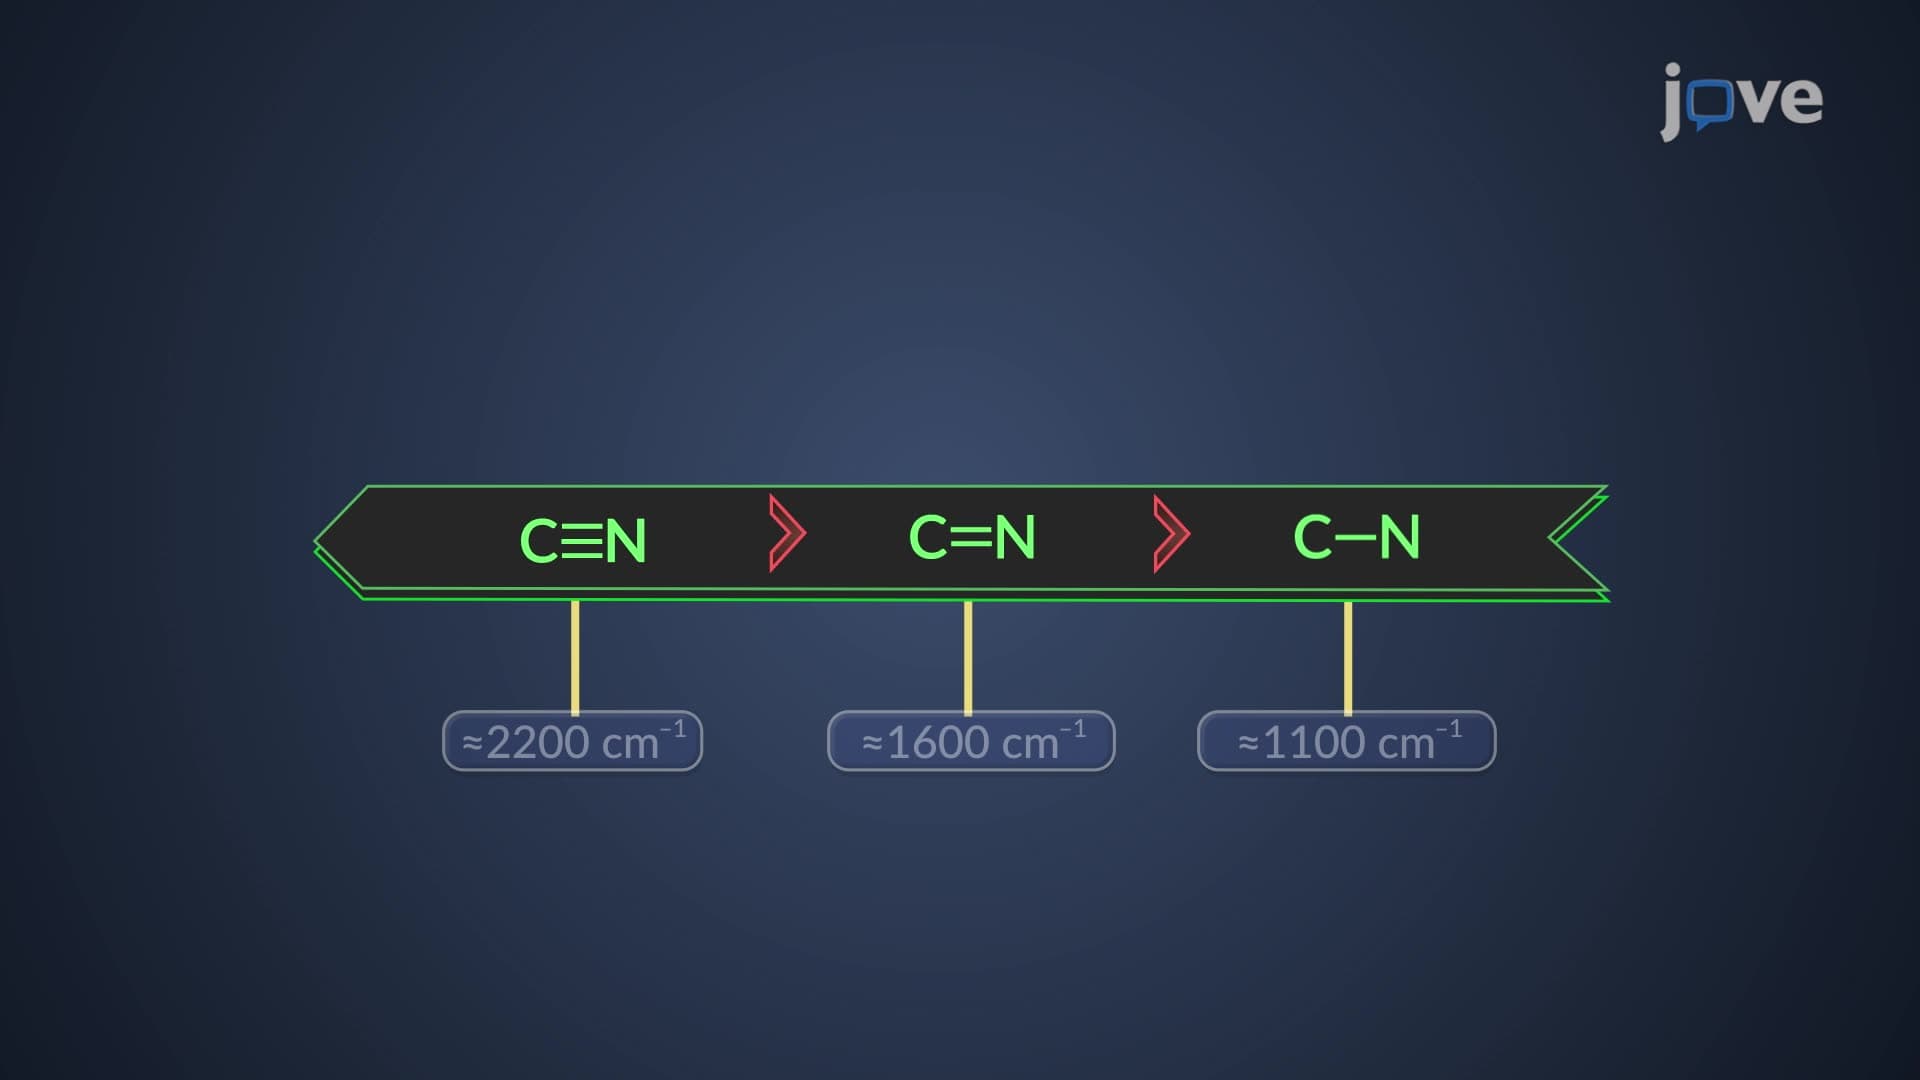
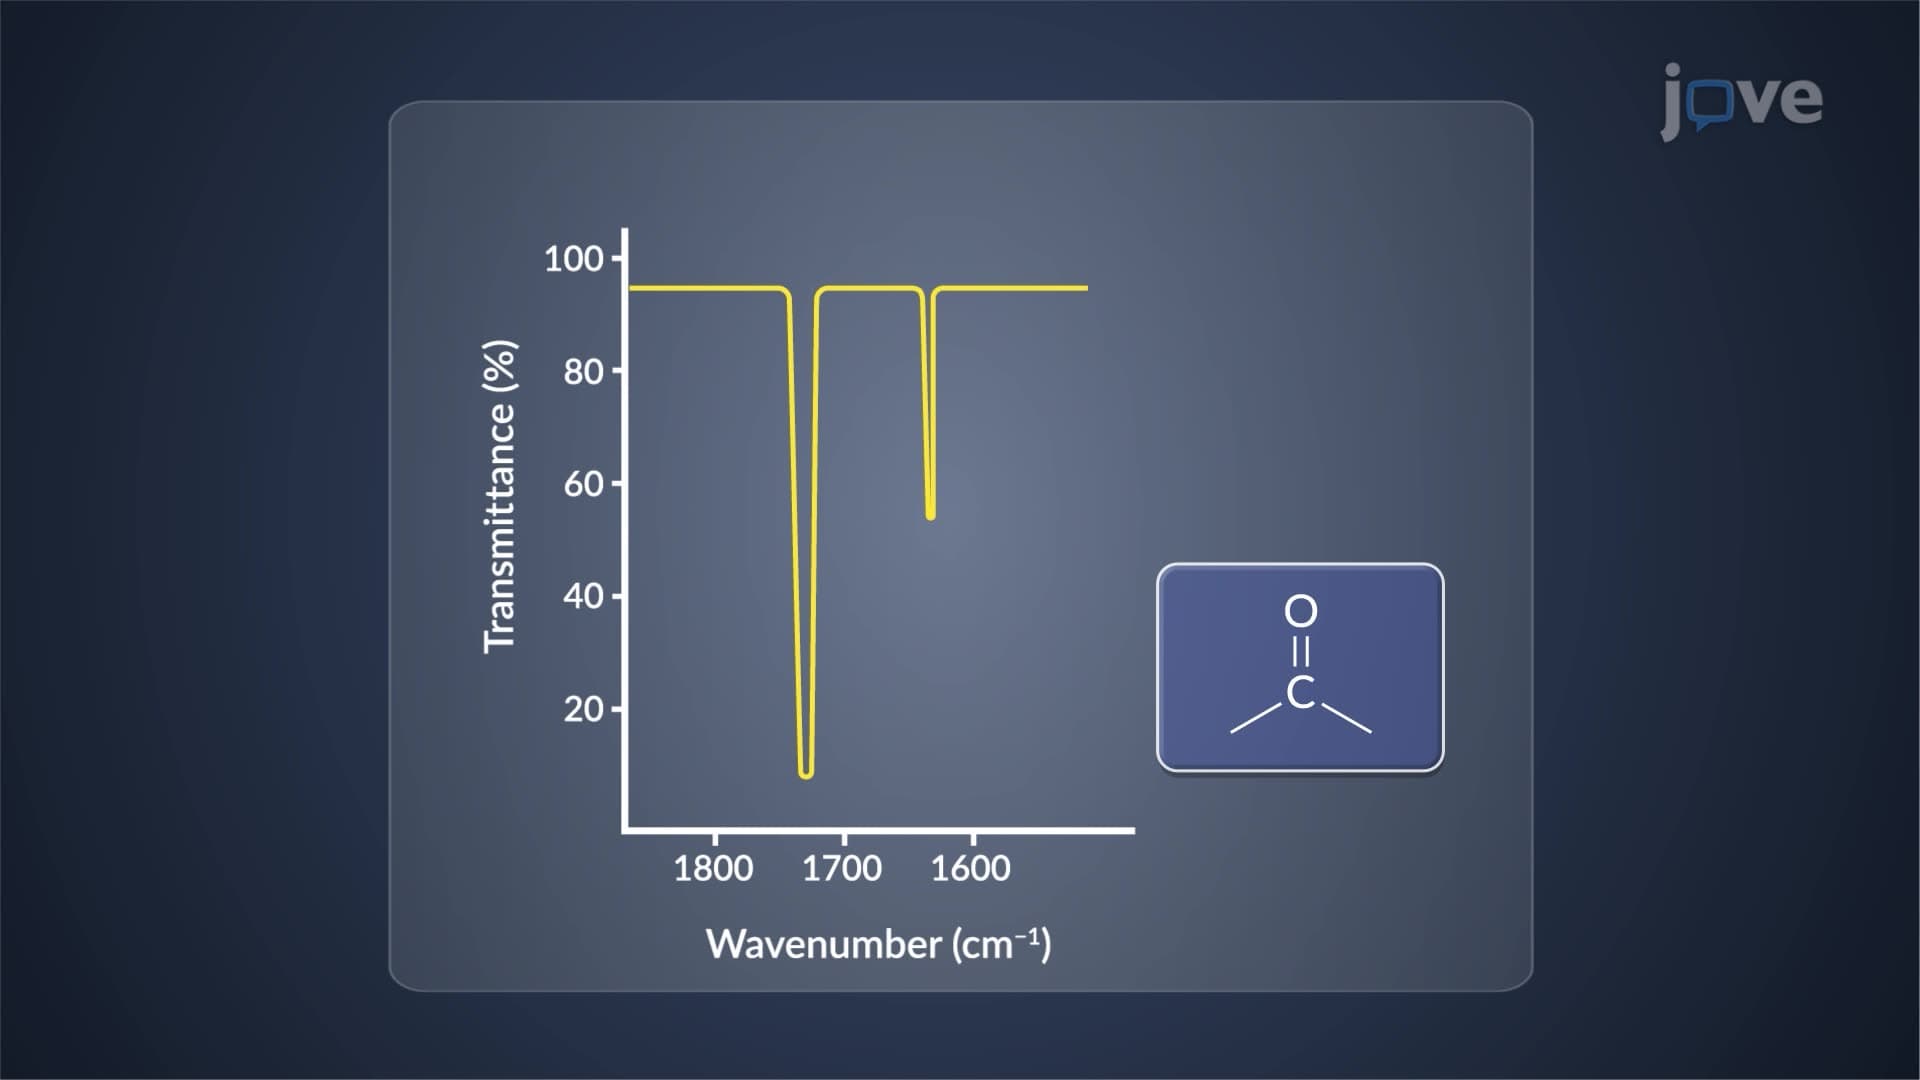
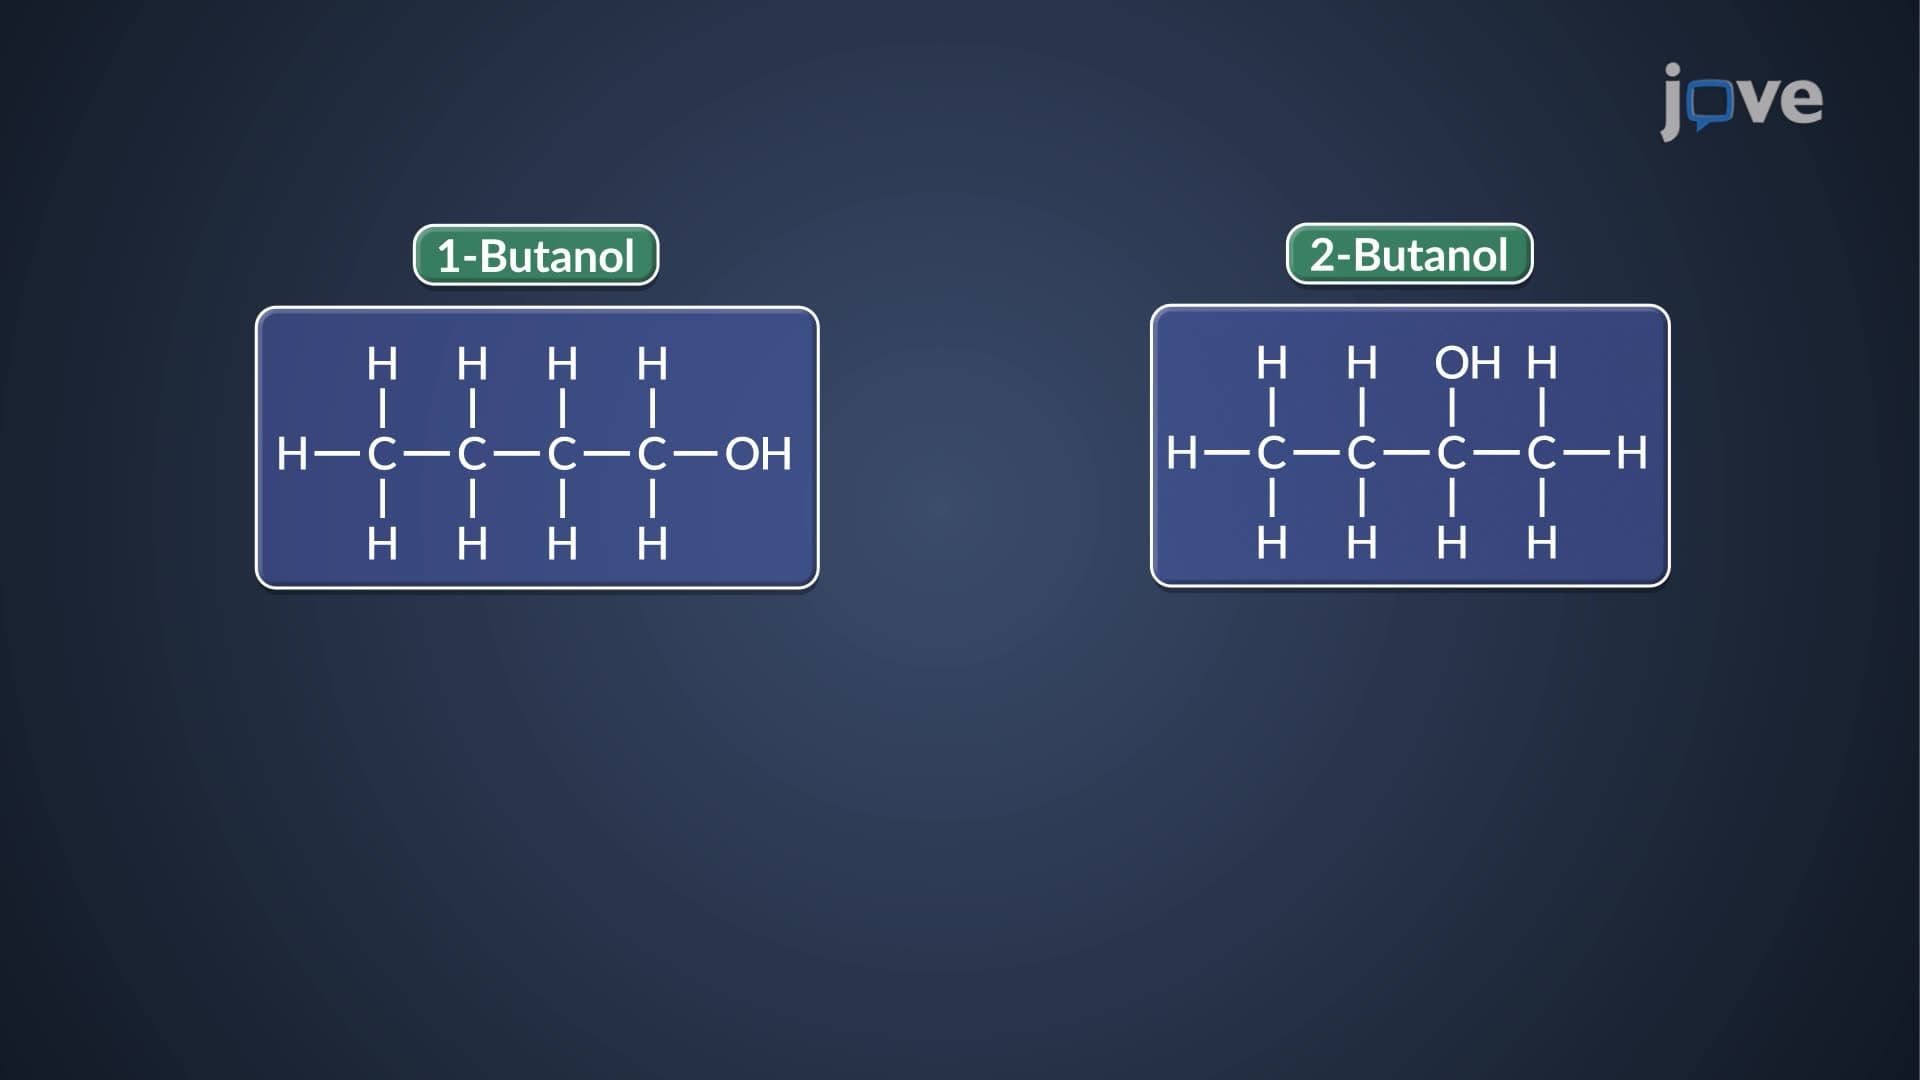
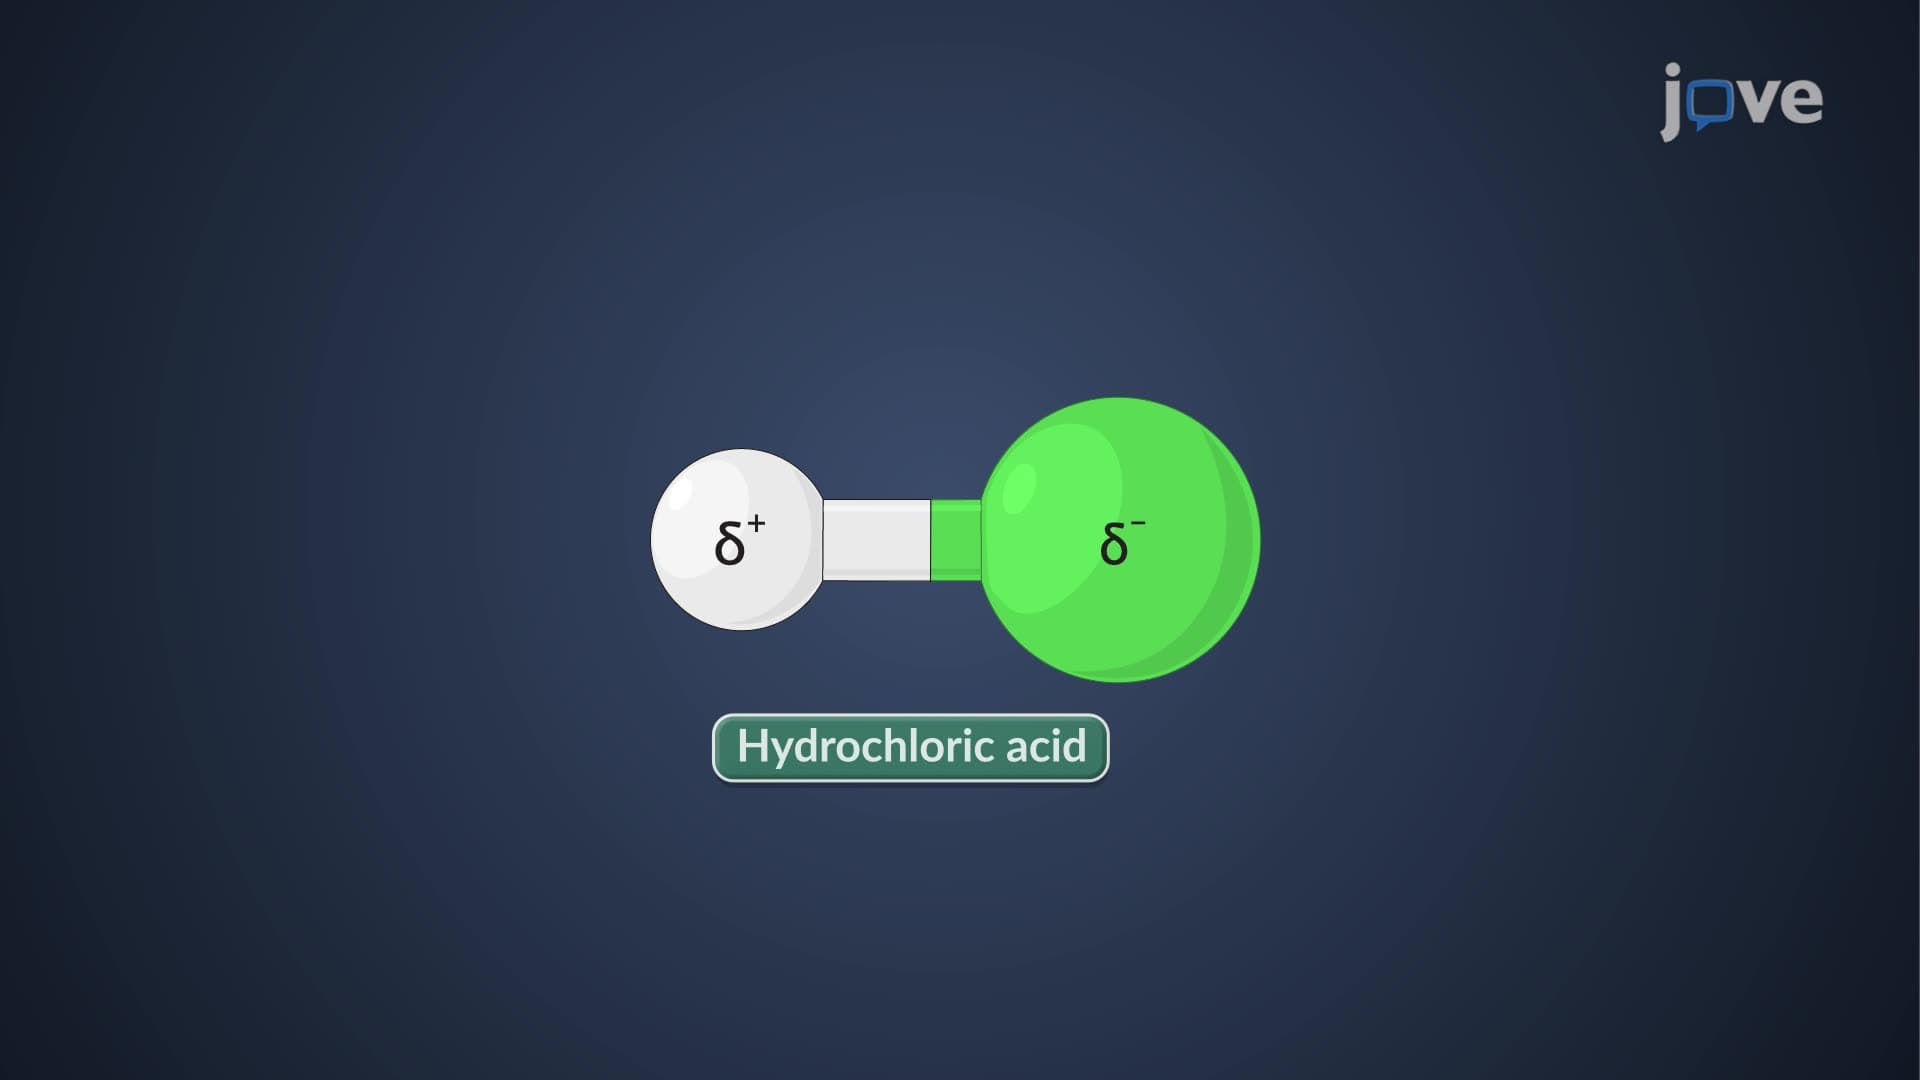
Three fundamental factors govern IR peak intensity: the strength of the bond's dipole moment, the number of identical bonds present, and the sample concentration. Bonds with large dipole moments-like C=O in carbonyl groups-produce intense, sharp peaks because they efficiently absorb IR energy. Conversely, symmetrical bonds like C=C in alkenes show weak or absent peaks due to minimal dipole moment changes during vibration.
How Sample Concentration Controls Peak Intensity
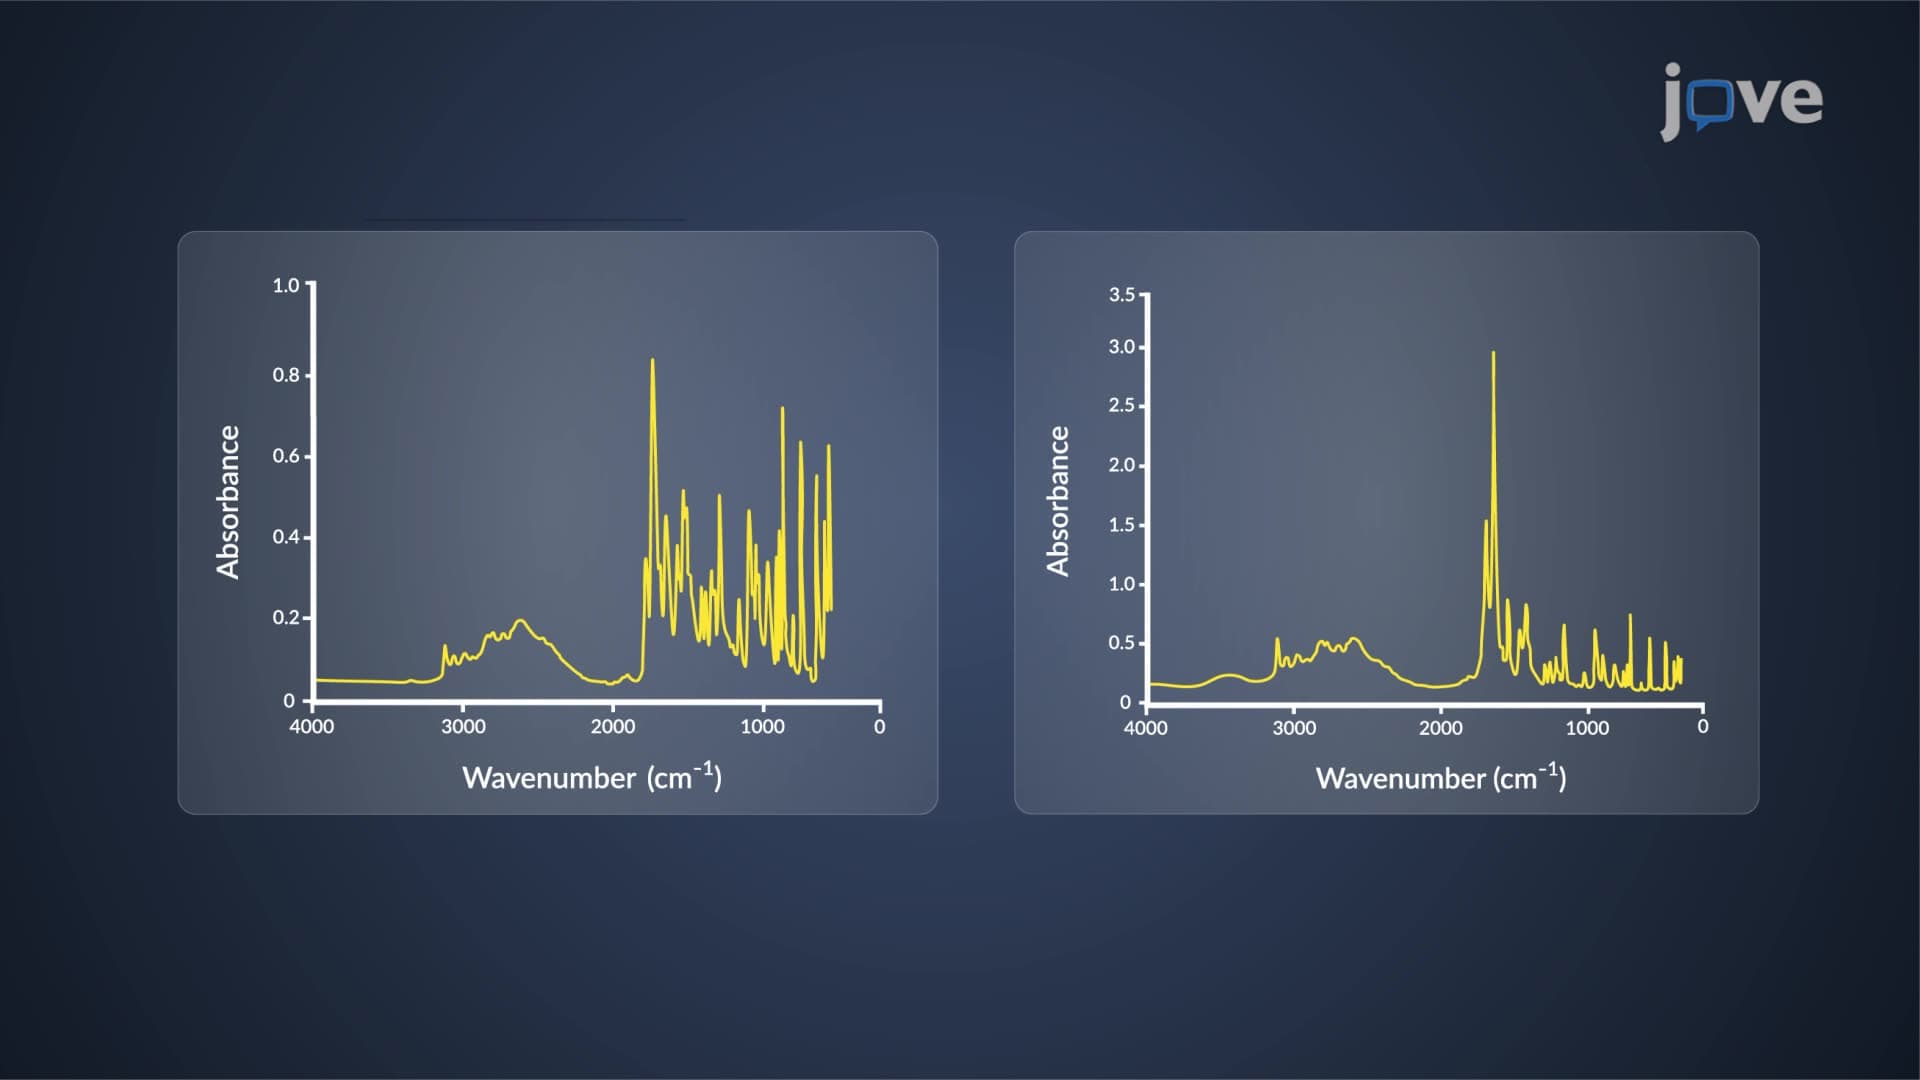
IR spectrum peak intensity concentration relationships follow Beer-Lambert law principles, where absorbance increases linearly with concentration. When analyzing a concentrated ethanol sample versus a diluted one, the O-H stretch around 3300 cm⁻¹ appears dramatically stronger in the concentrated sample due to more absorbing molecules in the light path.
This concentration effect proves invaluable for quantitative analysis. Environmental labs monitoring pollutant levels in water samples rely on this relationship to determine contaminant concentrations. The EPA frequently uses IR spectroscopy for hydrocarbon analysis, where how concentration affects IR peak intensity directly translates to regulatory compliance measurements.
Quantitative Applications and Beer-Lambert Relationships
The Beer-Lambert equation (A = εbc) governs IR peak intensity amount calculations, where absorbance (A) equals molar absorptivity (ε) times concentration (c) and path length (b). This relationship enables precise quantitative measurements essential for pharmaceutical quality control and forensic analysis.
Major pharmaceutical companies use calibration curves plotting IR peak height versus known concentrations to determine active ingredient levels in medications. The FDA requires such quantitative IR analysis for drug approval processes, making this concept critical for students pursuing careers in pharmaceutical sciences or analytical chemistry.
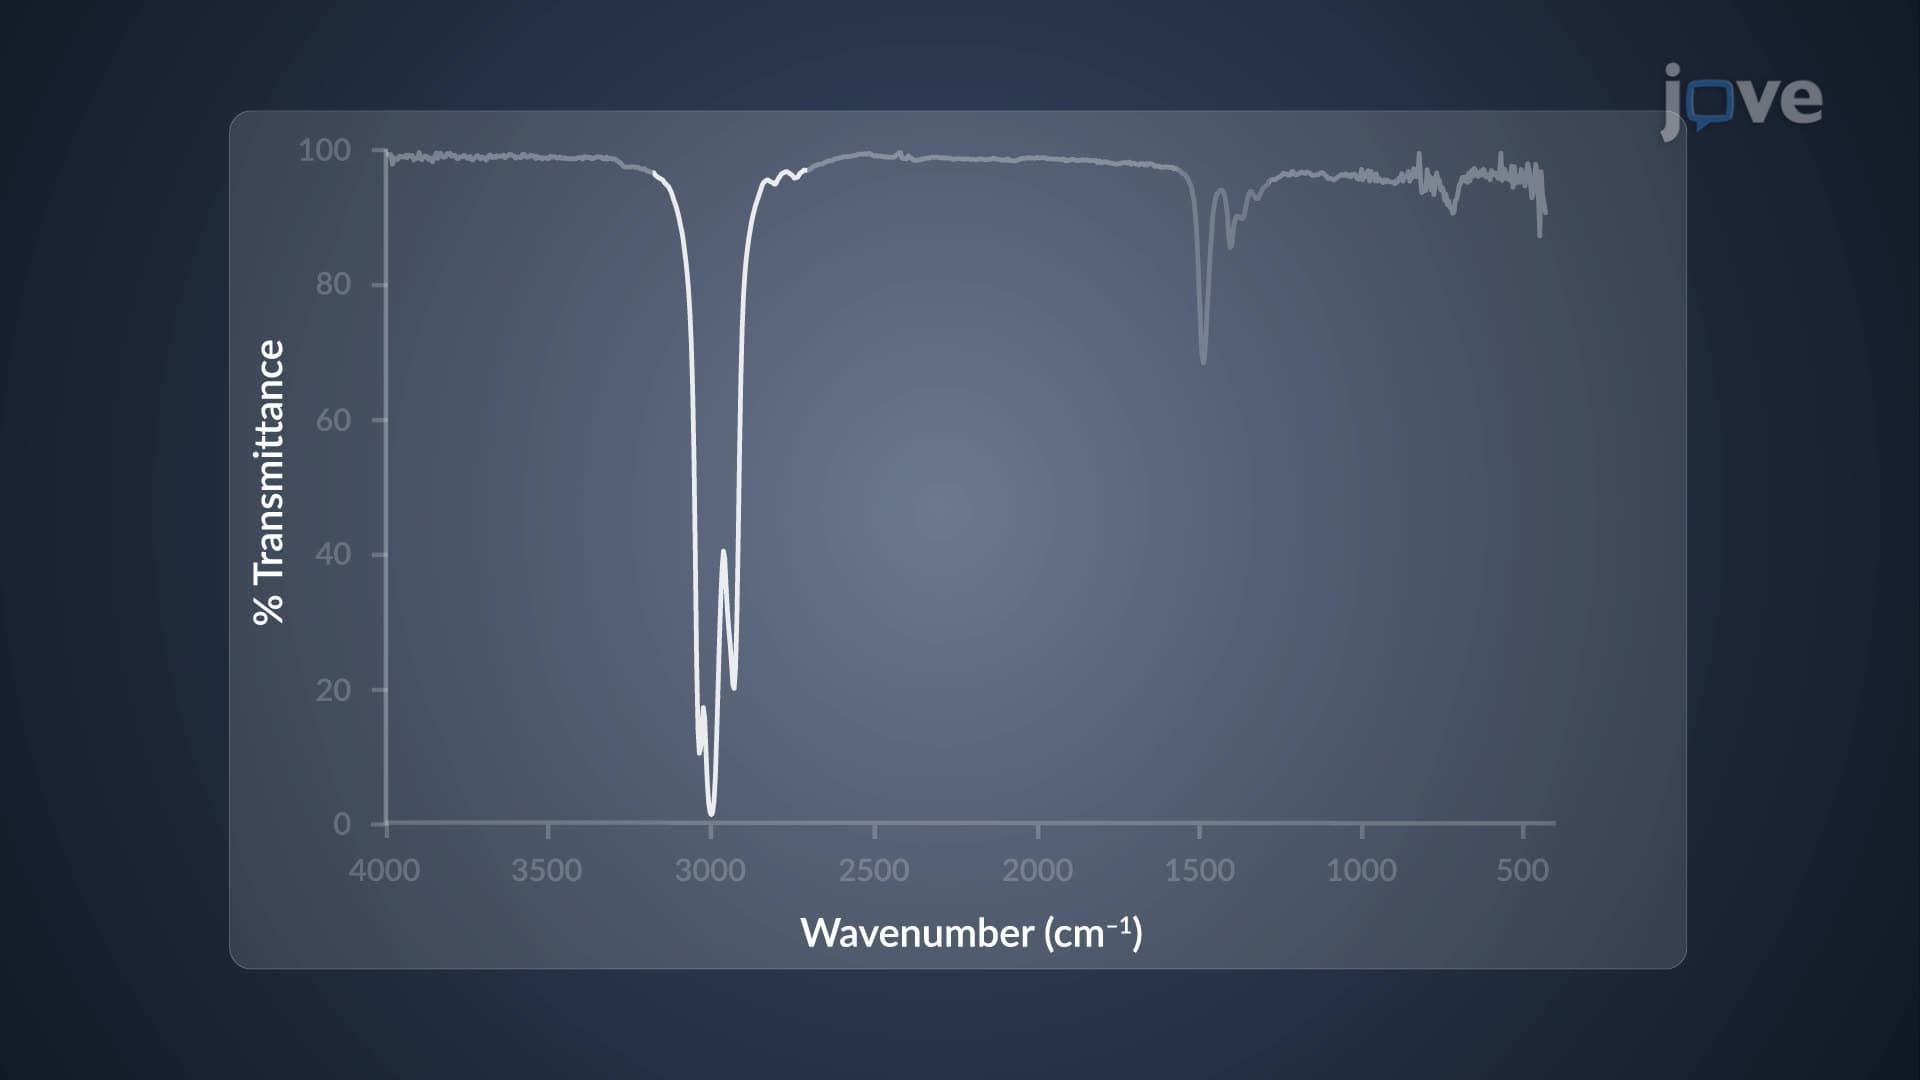
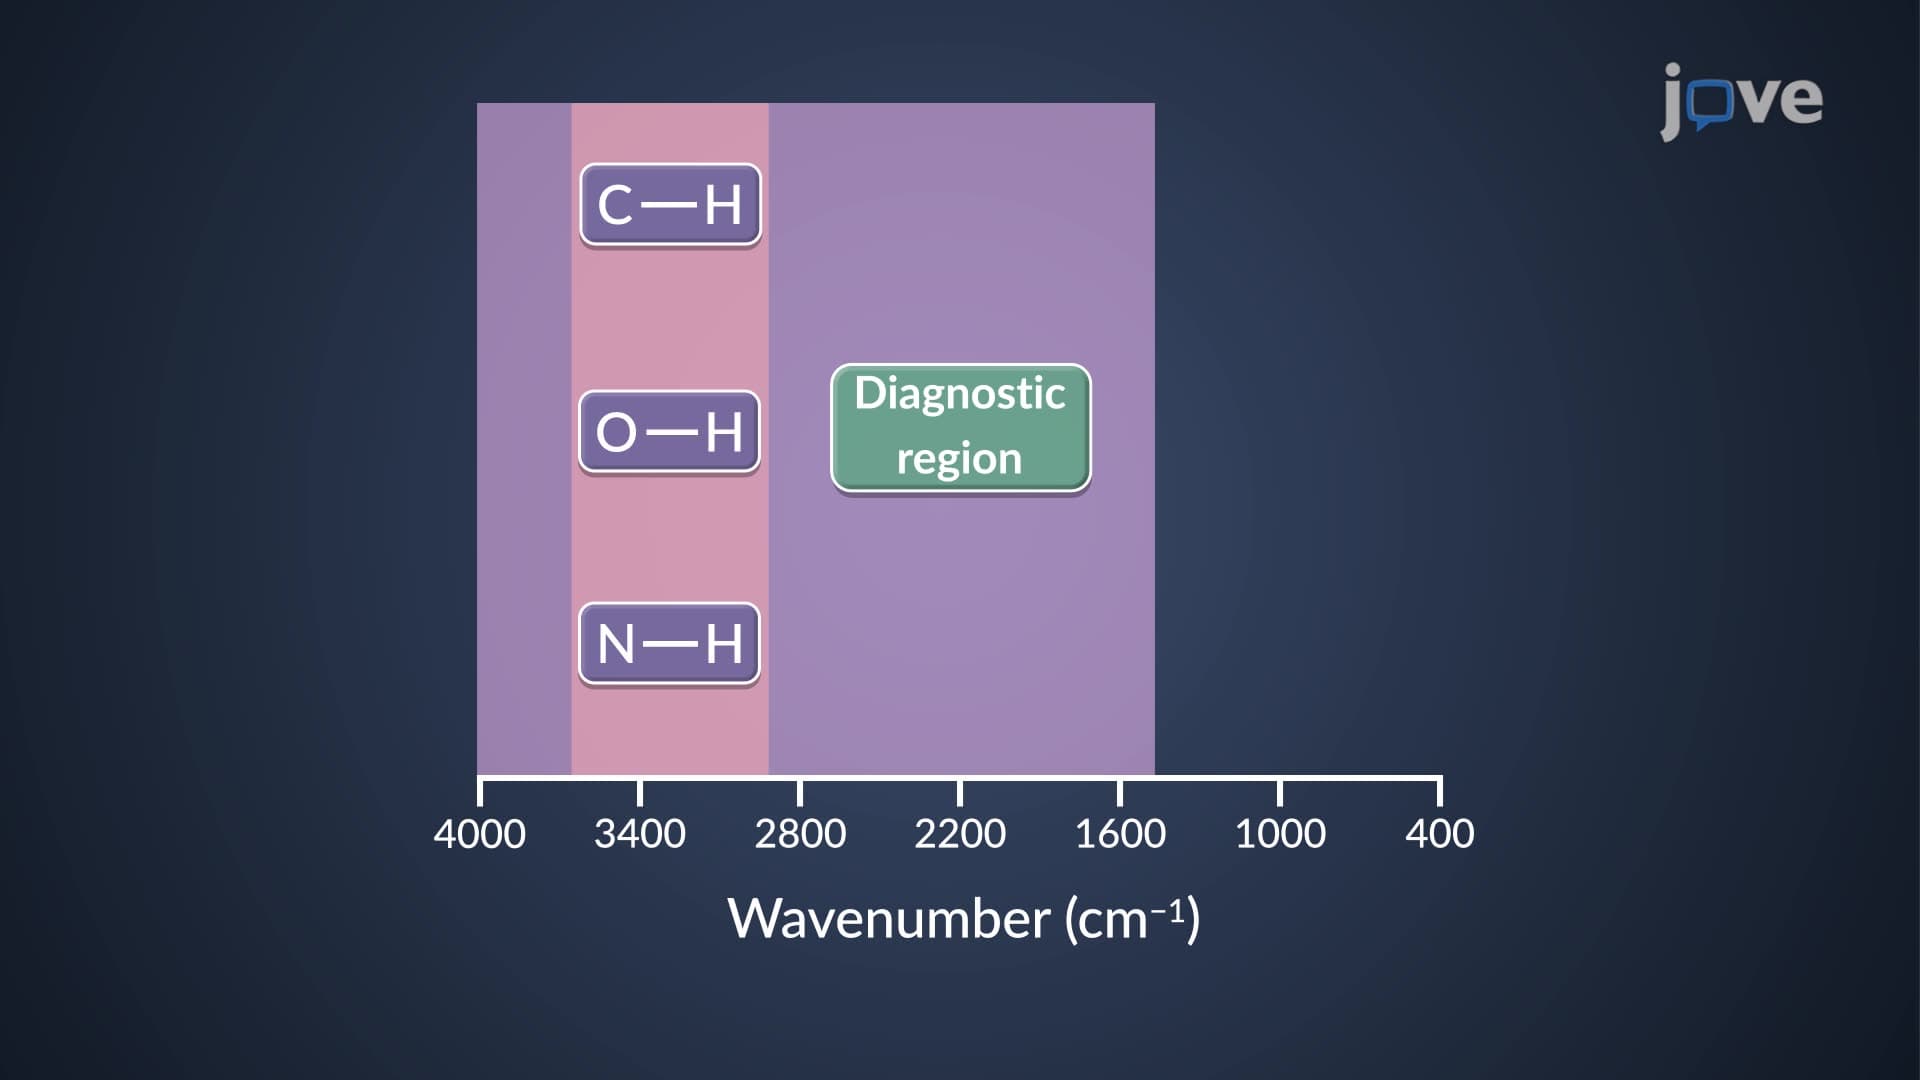
Students encountering this material in AP Chemistry or college organic chemistry courses should focus on connecting molecular structure to IR intensity patterns. Understanding why C-H stretches in alkanes produce moderate intensity peaks while O-H stretches in alcohols generate broad, intense absorptions provides the foundation for spectroscopic problem-solving on exams like the MCAT.
Frequently Asked Questions
IR spectrum peak intensity amount measures how strongly molecular bonds absorb infrared radiation at specific frequencies. Intensity varies because different bonds have different dipole moments-polar bonds like C=O produce intense peaks while nonpolar bonds like C-C show weak absorption. The number of identical bonds and sample concentration also directly influence peak intensity.
MCAT questions frequently test IR spectrum interpretation, requiring students to correlate peak intensity with functional group identification. Strong, broad peaks around 3300 cm⁻¹ indicate O-H groups, while sharp, intense peaks near 1700 cm⁻¹ suggest C=O bonds. Understanding intensity patterns helps eliminate incorrect answer choices and identify molecular structures accurately.
Yes, AP Chemistry regularly includes IR spectroscopy questions testing both qualitative and quantitative analysis concepts. Students must interpret how concentration changes affect peak height and apply Beer-Lambert principles to calculate unknown concentrations. Practice problems often involve comparing spectra of the same compound at different concentrations.
Companies like Johnson & Johnson use quantitative IR analysis to verify active ingredient concentrations in medications. They create calibration curves plotting IR peak intensity versus known drug concentrations, then measure unknown samples against these standards. This ensures each tablet contains the precise amount of active ingredient required for therapeutic effectiveness.
You need basic understanding of molecular polarity, dipole moments, and chemical bonding from general chemistry. Knowledge of functional groups from organic chemistry helps interpret peak assignments. No advanced mathematics is required-the Beer-Lambert relationship uses simple algebra that high school students can easily master.
Focus on understanding the underlying principles rather than pure memorization. Strong, polar bonds produce intense peaks while weak, nonpolar bonds show minimal absorption. Create comparison charts linking functional groups to expected intensity patterns, then practice with real spectra from your textbook or online databases.
IR intensity concepts provide the foundation for quantitative spectroscopic analysis used throughout analytical chemistry. Students progress to studying molar absorptivity coefficients, matrix effects in complex samples, and advanced techniques like ATR-FTIR. This knowledge proves essential for careers in forensic science, environmental monitoring, and pharmaceutical development.
IR spectroscopy offers rapid, non-destructive analysis ideal for many applications, but it has limitations. Complex mixtures may show overlapping peaks, and some compounds lack strong IR-active bonds. Analytical chemists typically combine IR with techniques like NMR, mass spectrometry, or chromatography for comprehensive quantitative analysis in research and industrial applications.
Related Micro-courses

17 Concepts

15 Concepts