Loading subject page…

Micro-course: Molecular Vibrational Spectroscopy
28,168 views
Learn key concepts and earn your certificate.



IR Spectrum

00:00
01:19
Video Summary: What Is Ir Spectrum
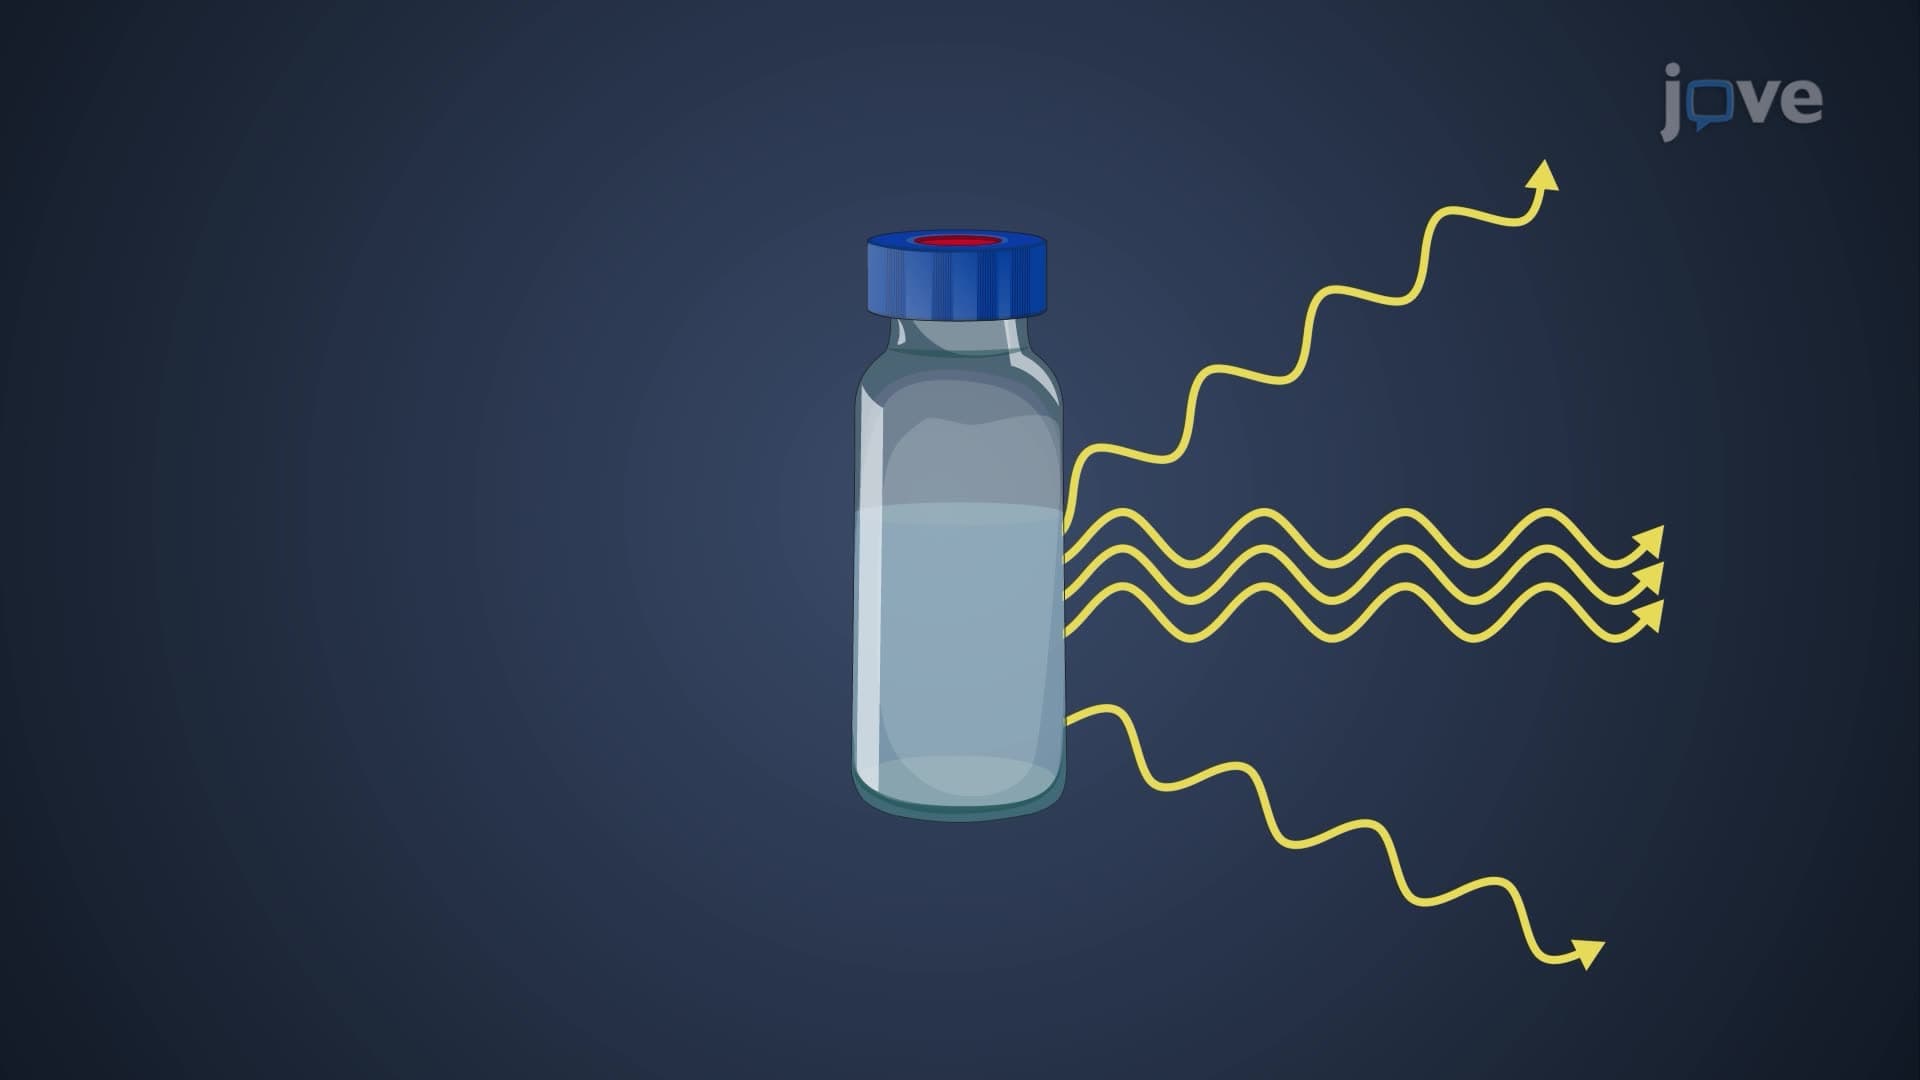
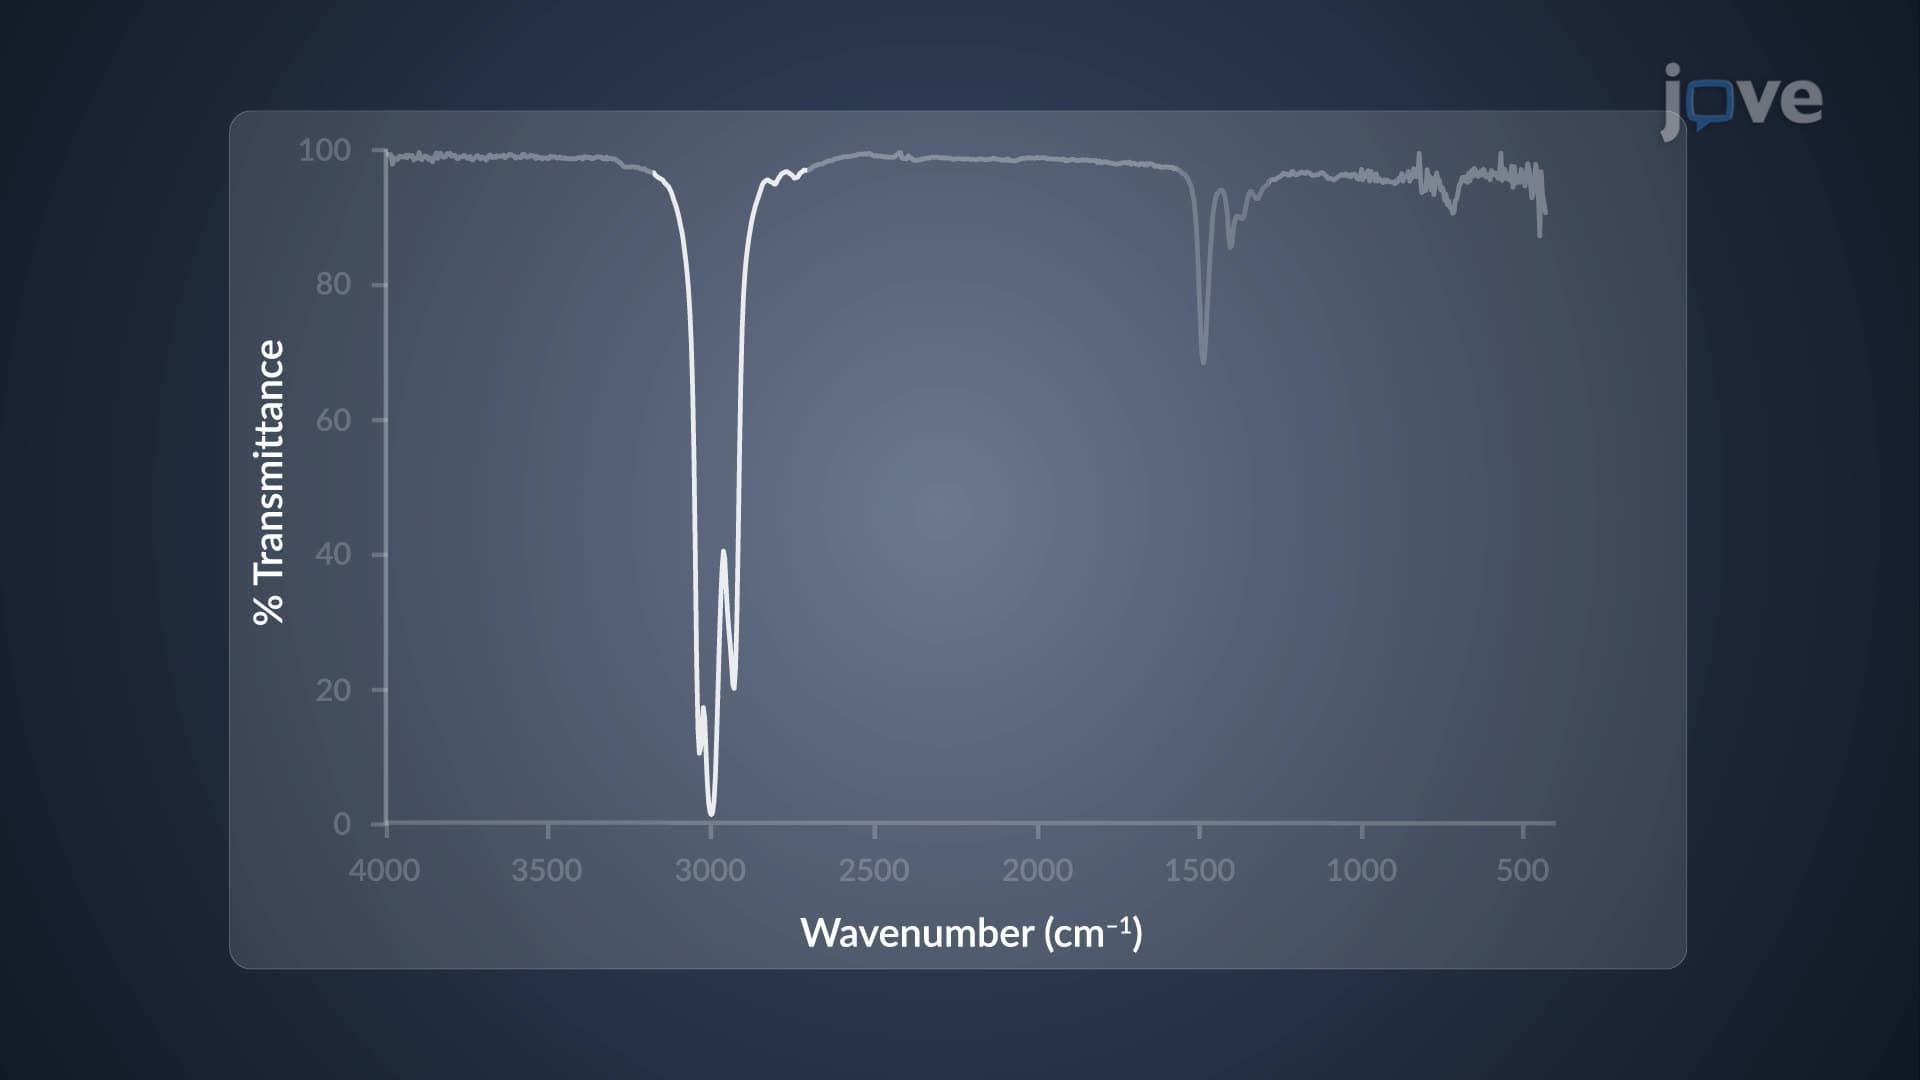
Ever wonder how forensic scientists at the FBI identify unknown drugs or how pharmaceutical companies ensure medication purity? IR spectrum explained reveals how molecules absorb specific light frequencies, creating unique "fingerprints" that identify chemical compounds. An IR spectrum maps molecular vibrations by plotting transmittance percentages against wavenumbers, with absorption bands appearing as downward peaks at characteristic frequencies. Understanding what an IR spectrum is becomes crucial for applications from quality control at Johnson & Johnson to environmental monitoring by the EPA. Watch the full video on JoVE Coach to master this concept with expert-led visuals and step-by-step explanations.
- Understand what is IR spectrum and how it represents molecular absorption patterns through transmittance versus wavenumber plots
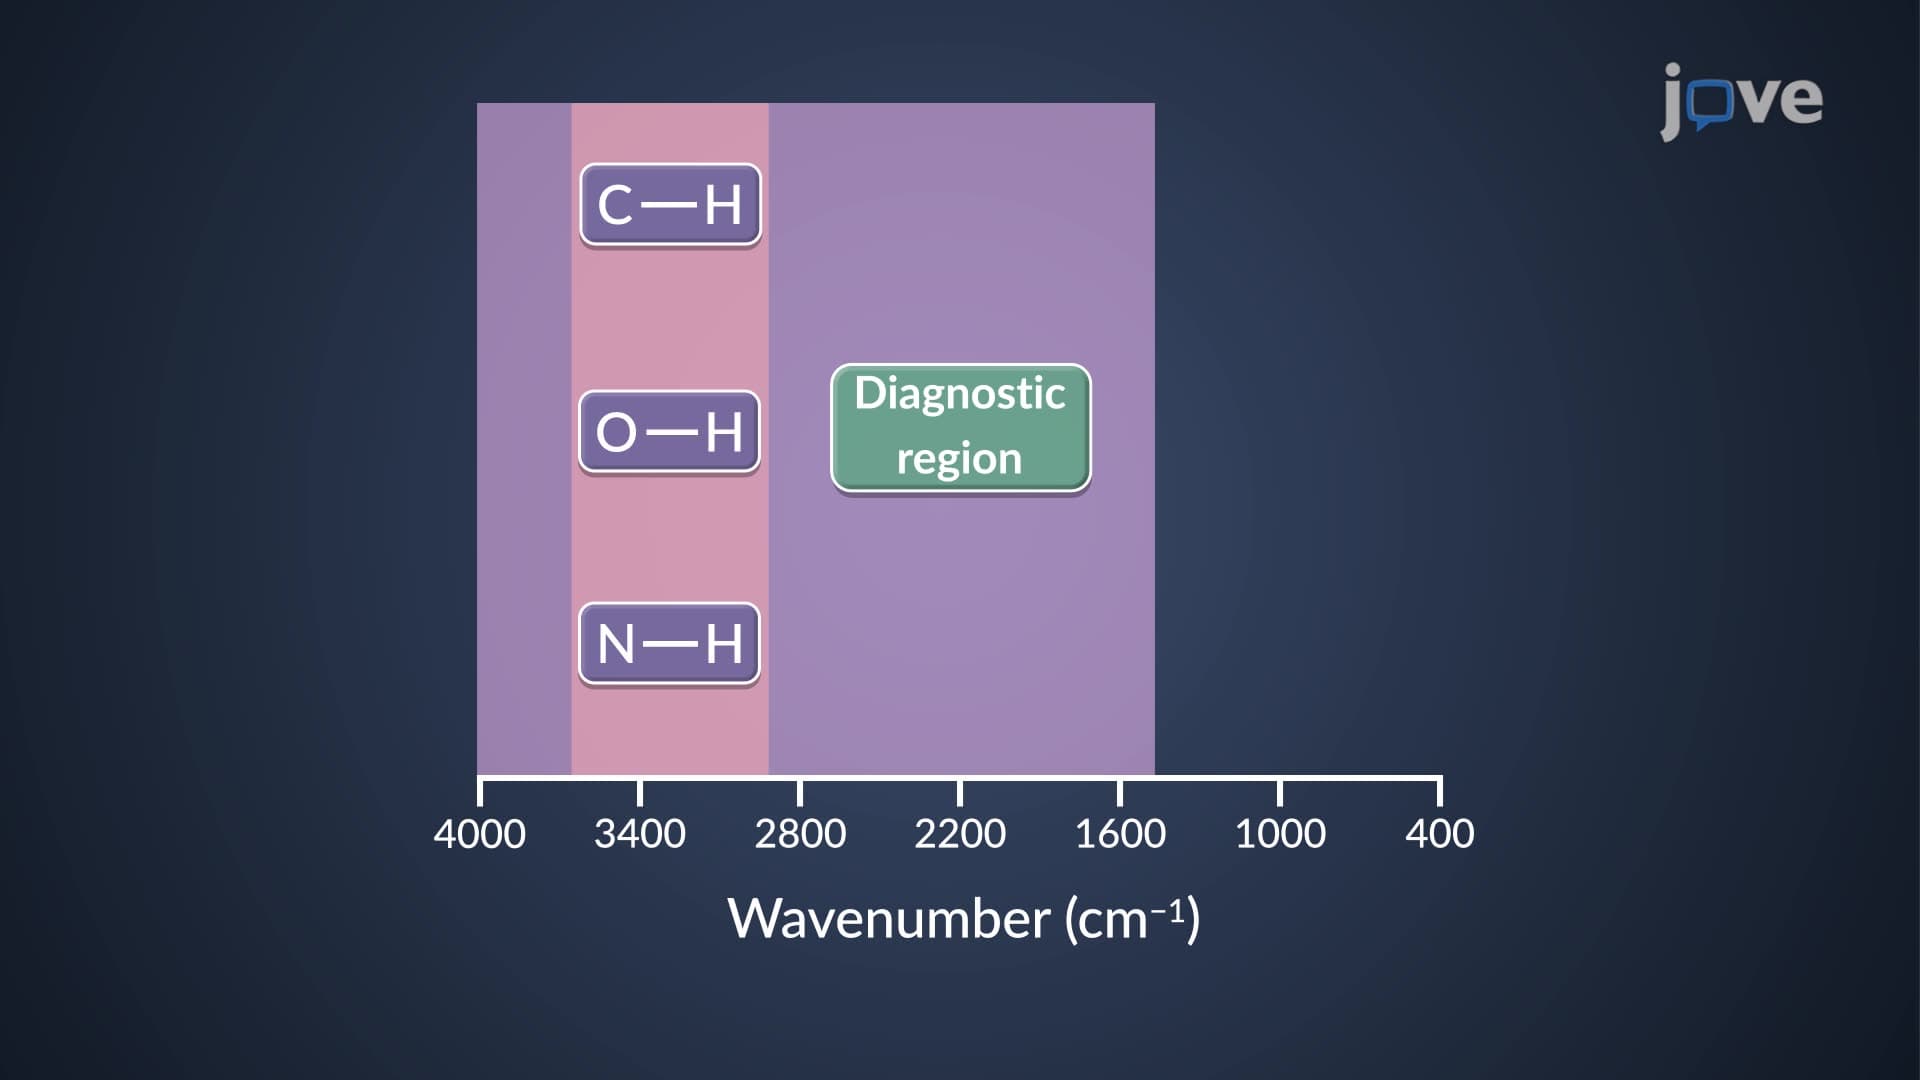
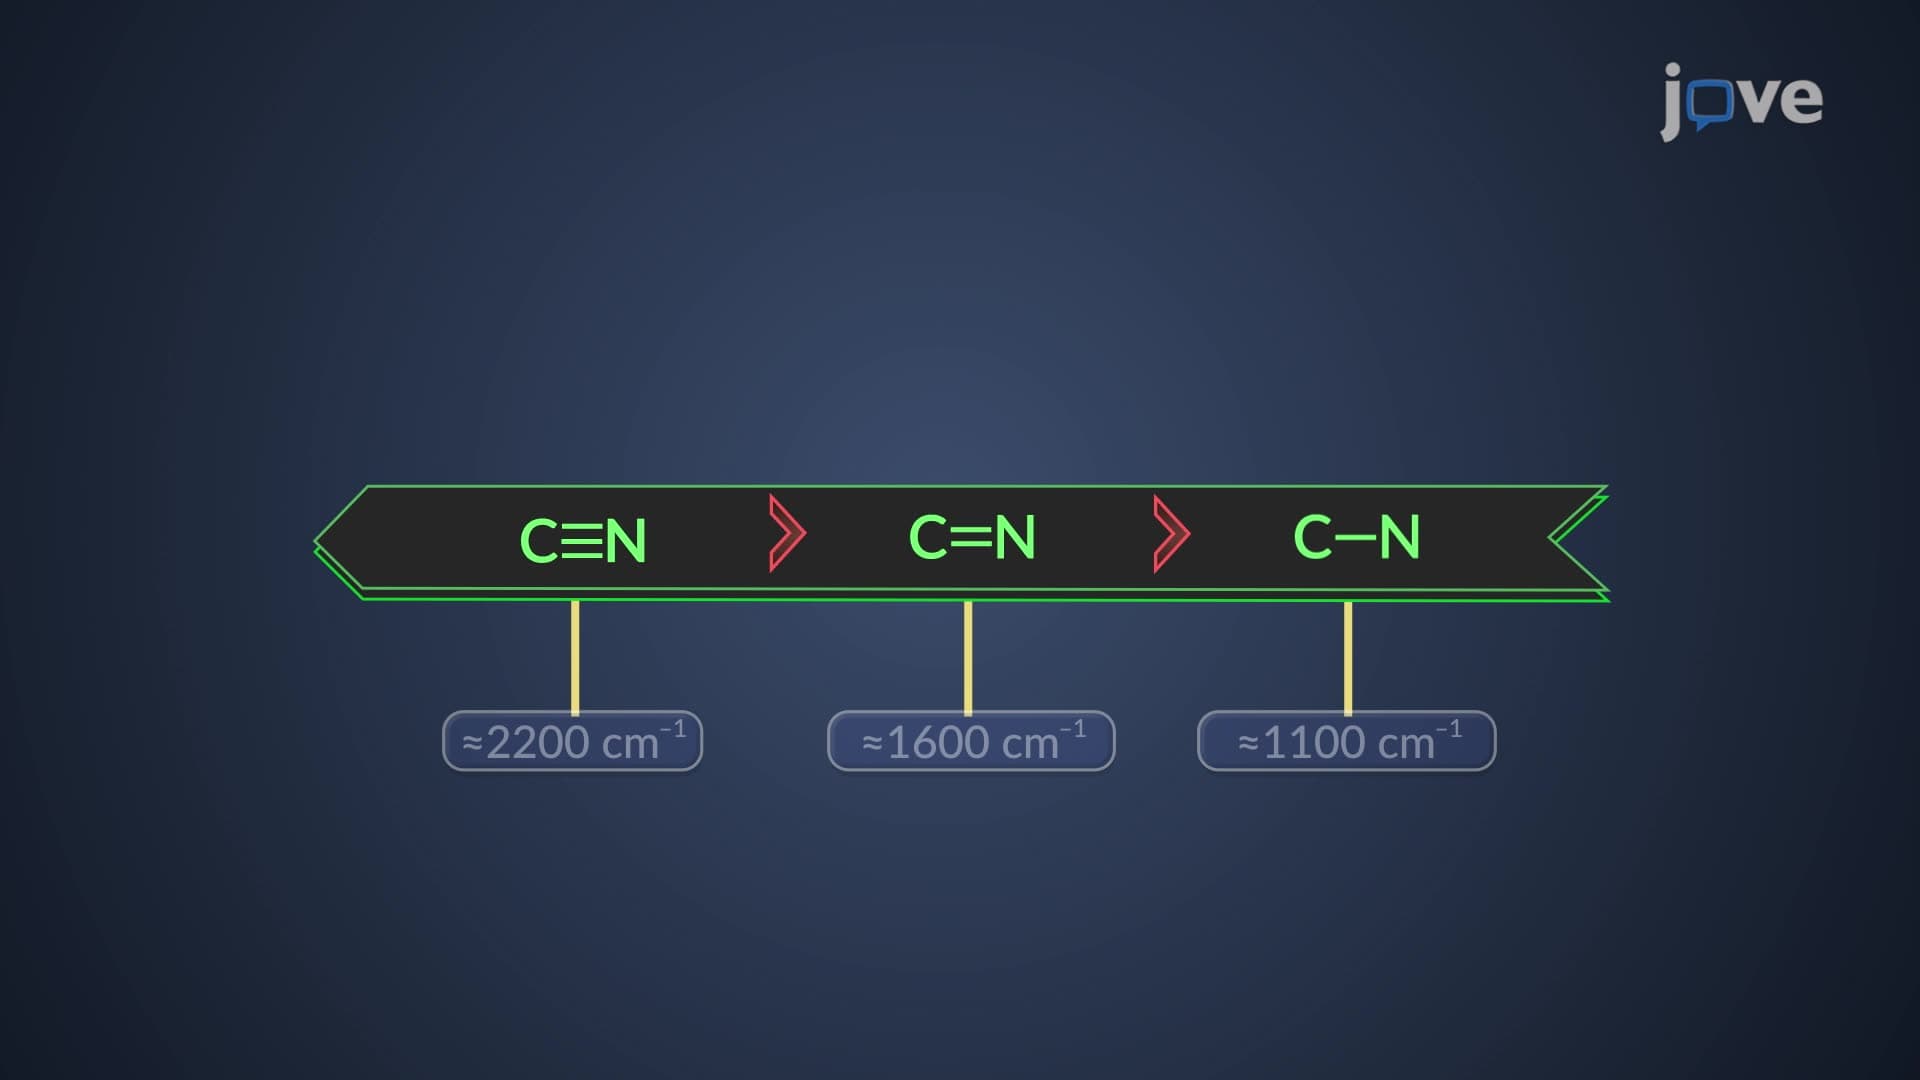
- Identify characteristic absorption bands for different functional groups in the diagnostic region above 1500 cm⁻¹
- Analyze the relationship between wavenumber values and energy levels, recognizing high-energy absorptions on the left side
- Compare molecular structures using fingerprint regions below 1500 cm⁻¹ where each compound shows unique patterns
- Evaluate transmittance percentages to determine absorption intensity and molecular behavior
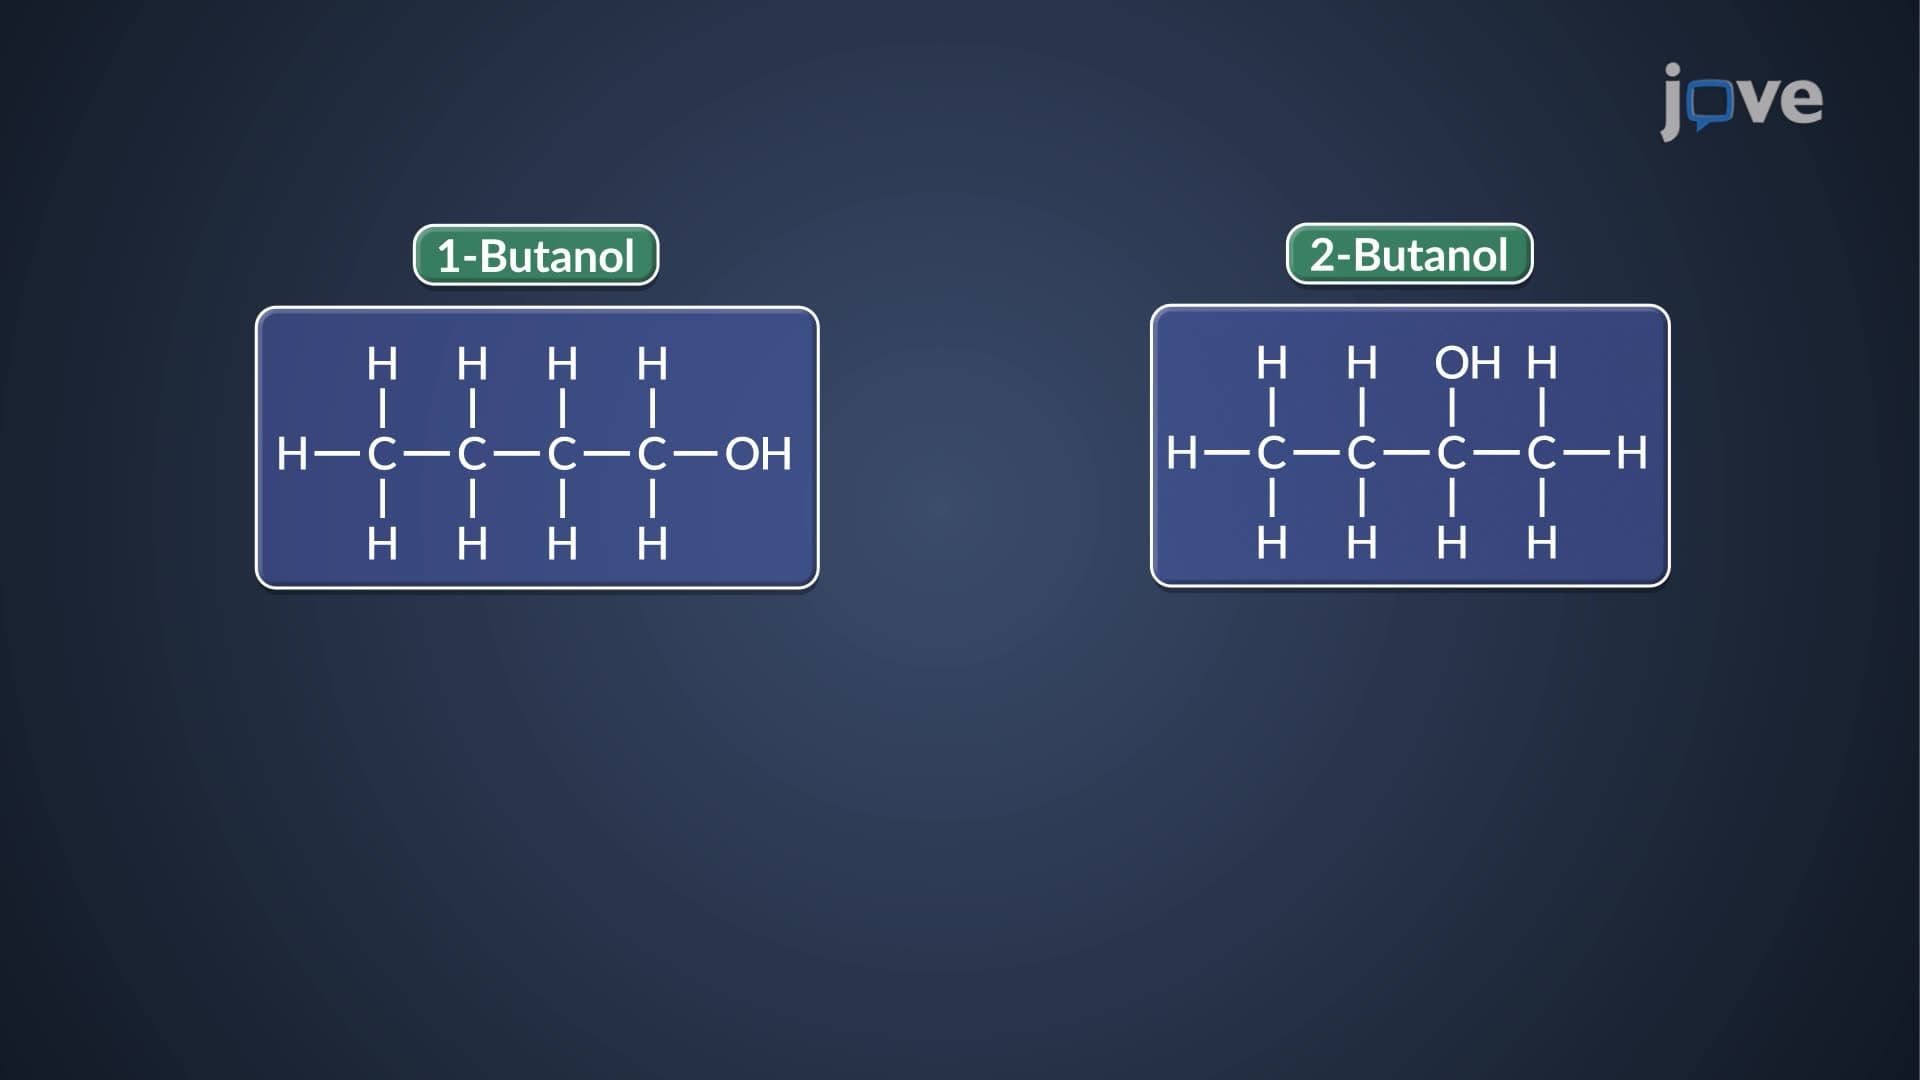
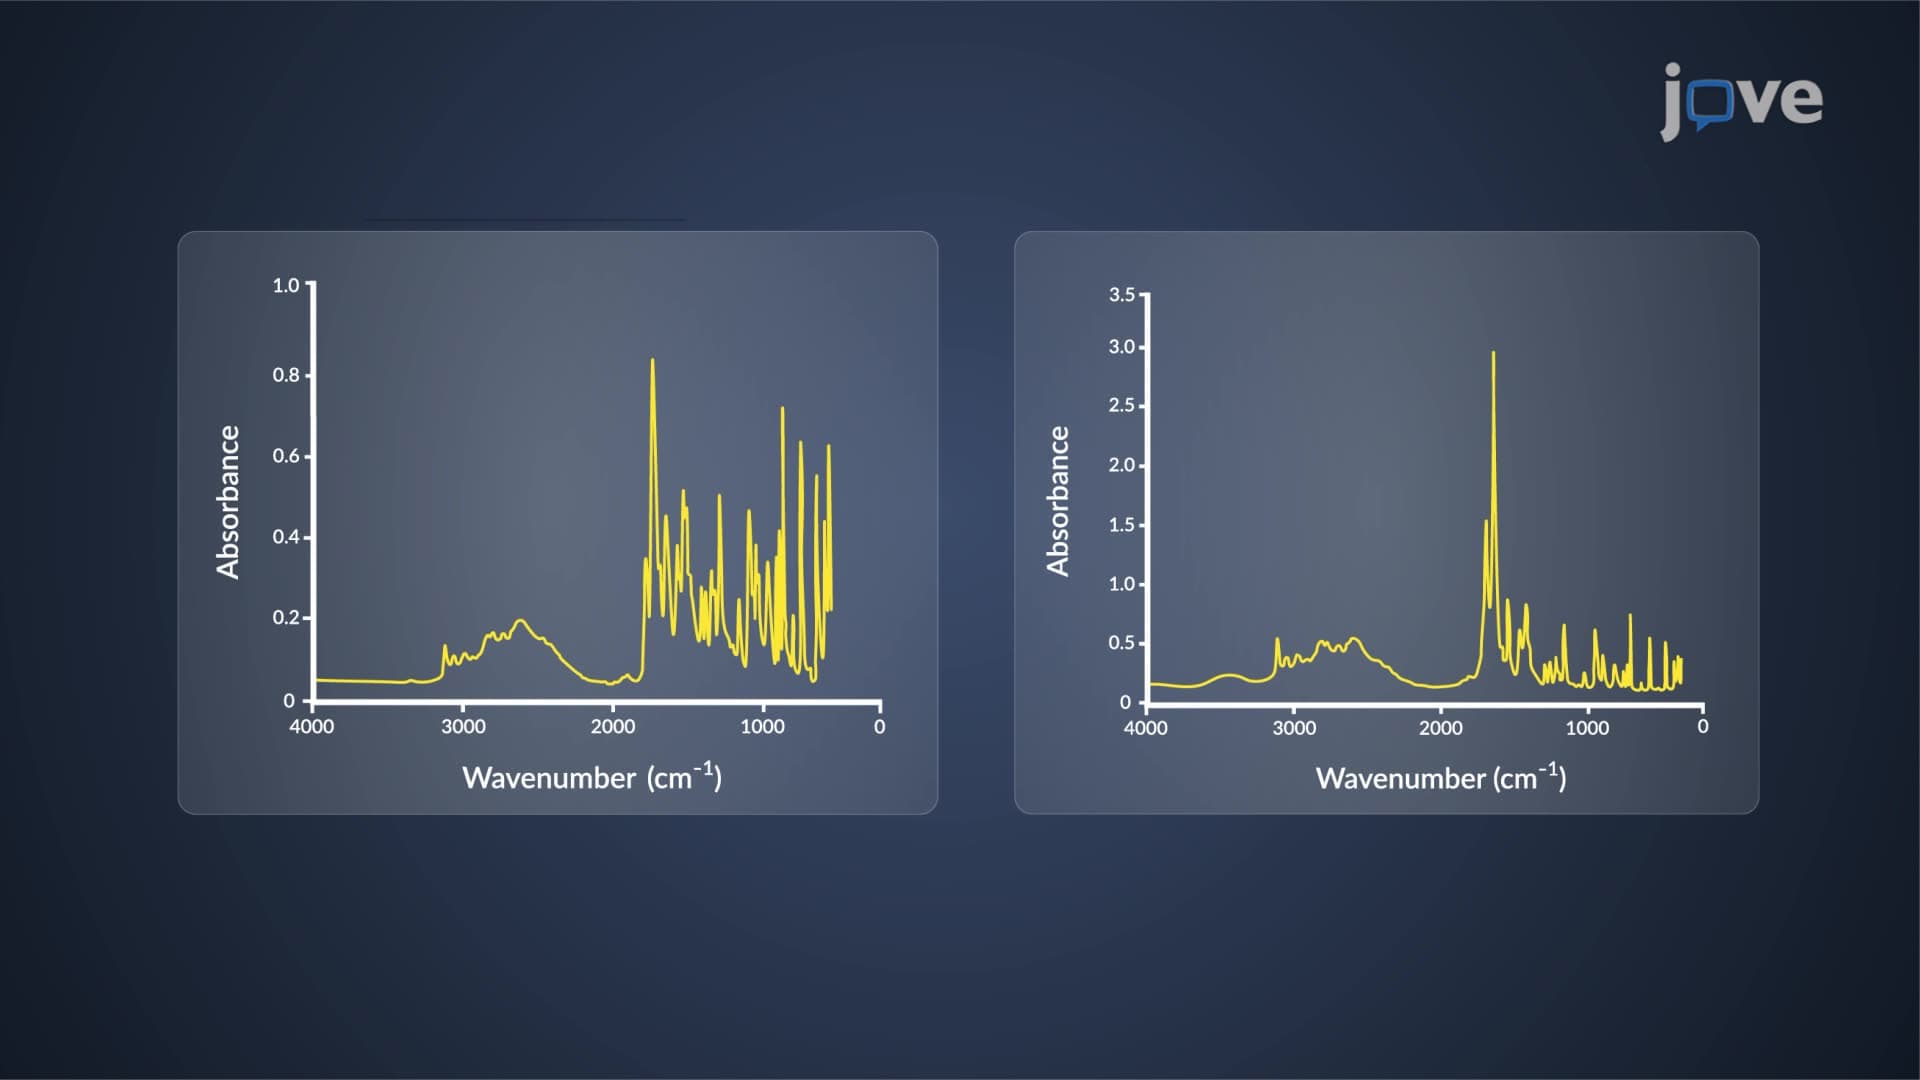
- Apply IR spectrum interpretation to distinguish between structural isomers like 1-butanol and 2-butanol
- Recognize common absorption frequencies such as C-H stretches around 3000 cm⁻¹ and C-C bends near 1465 cm⁻¹
- Explore how IR spectroscopy serves as a diagnostic tool in pharmaceutical, environmental, and forensic applications
Understanding What is IR Spectrum: The Molecular Fingerprint
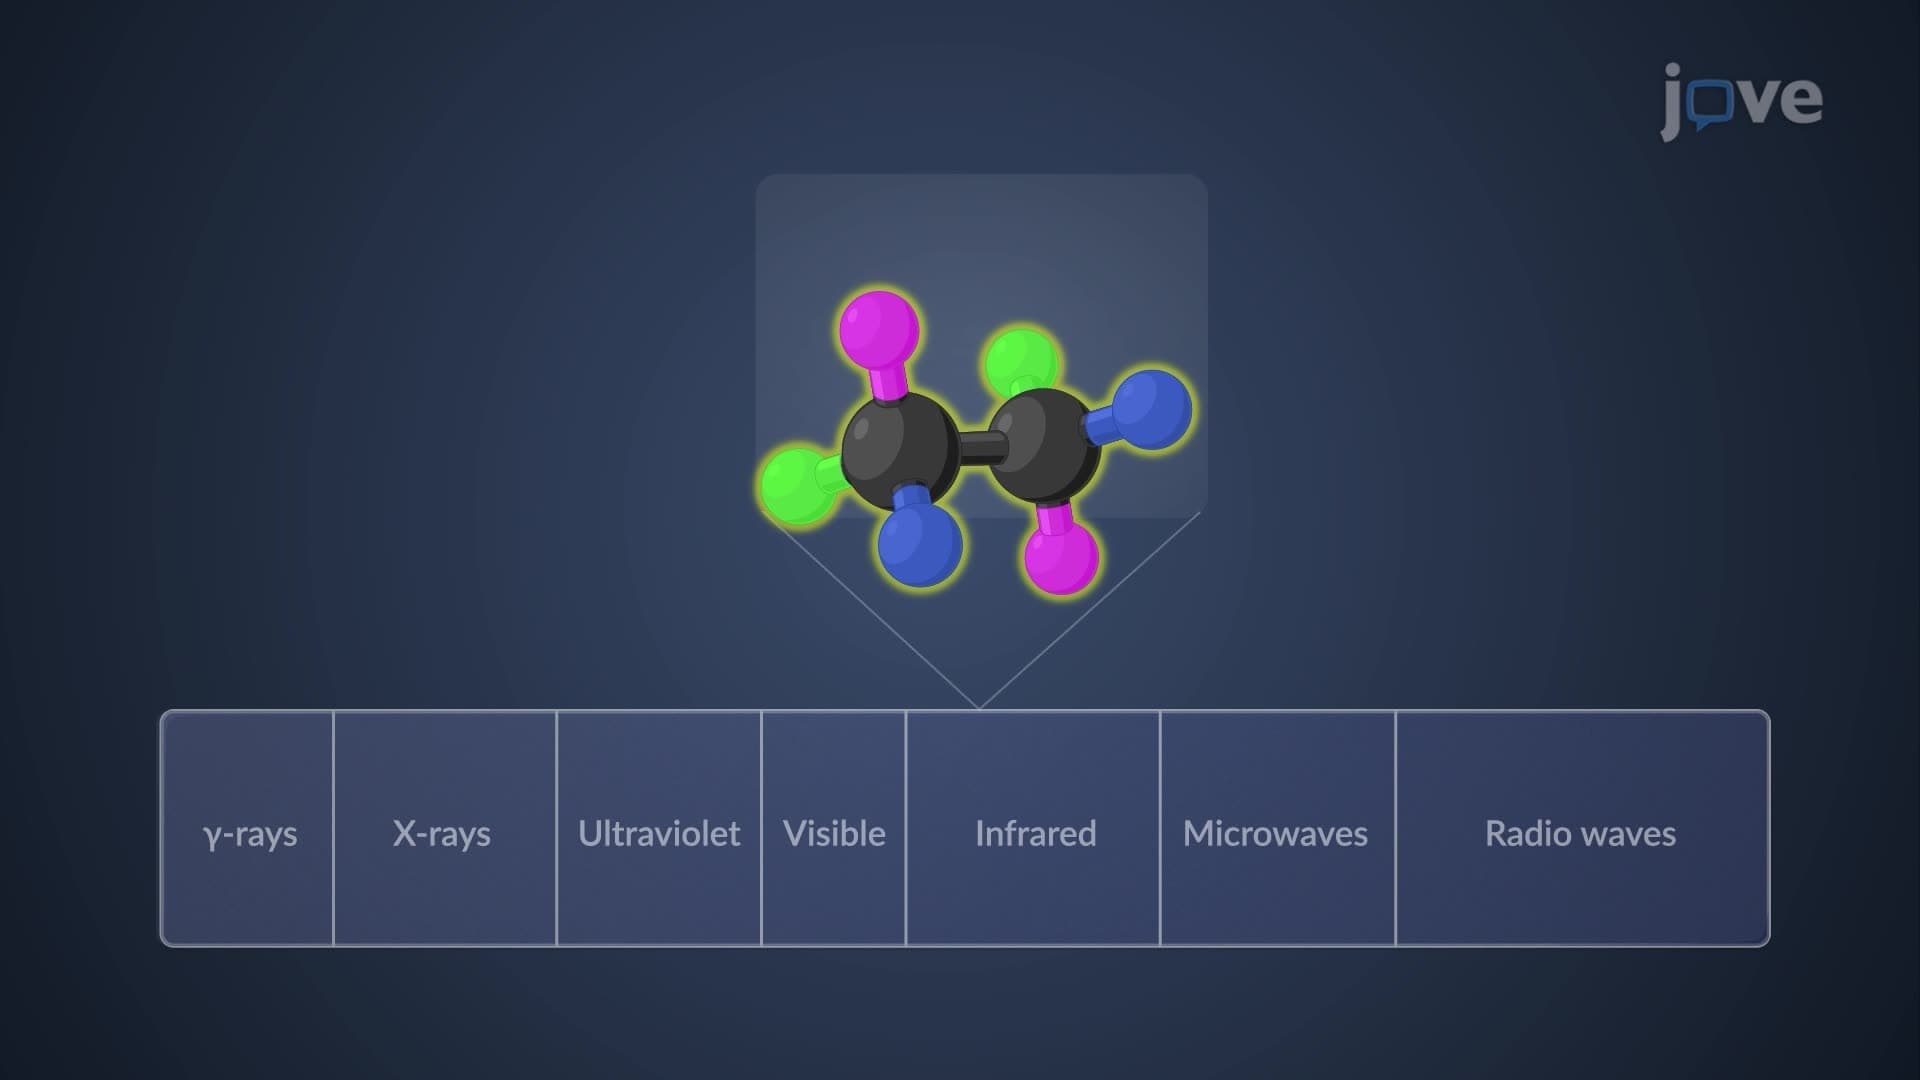
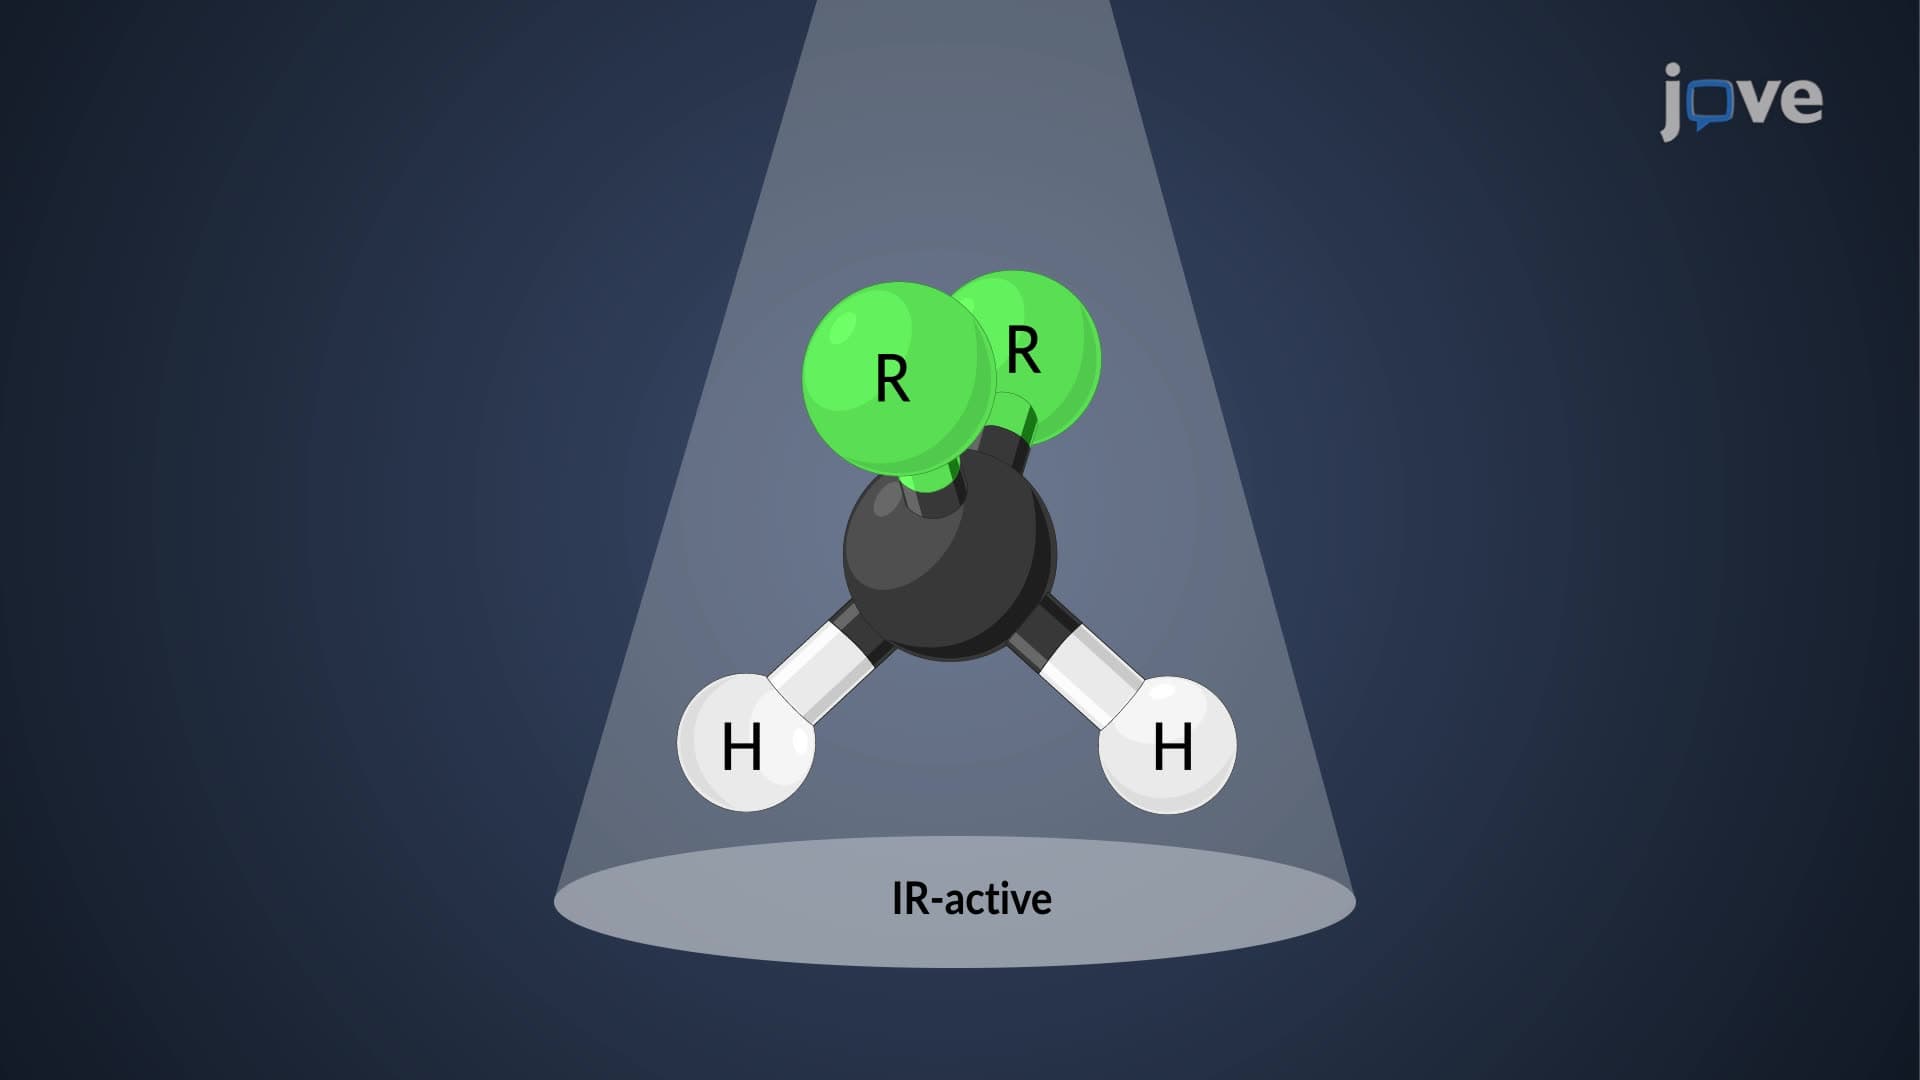
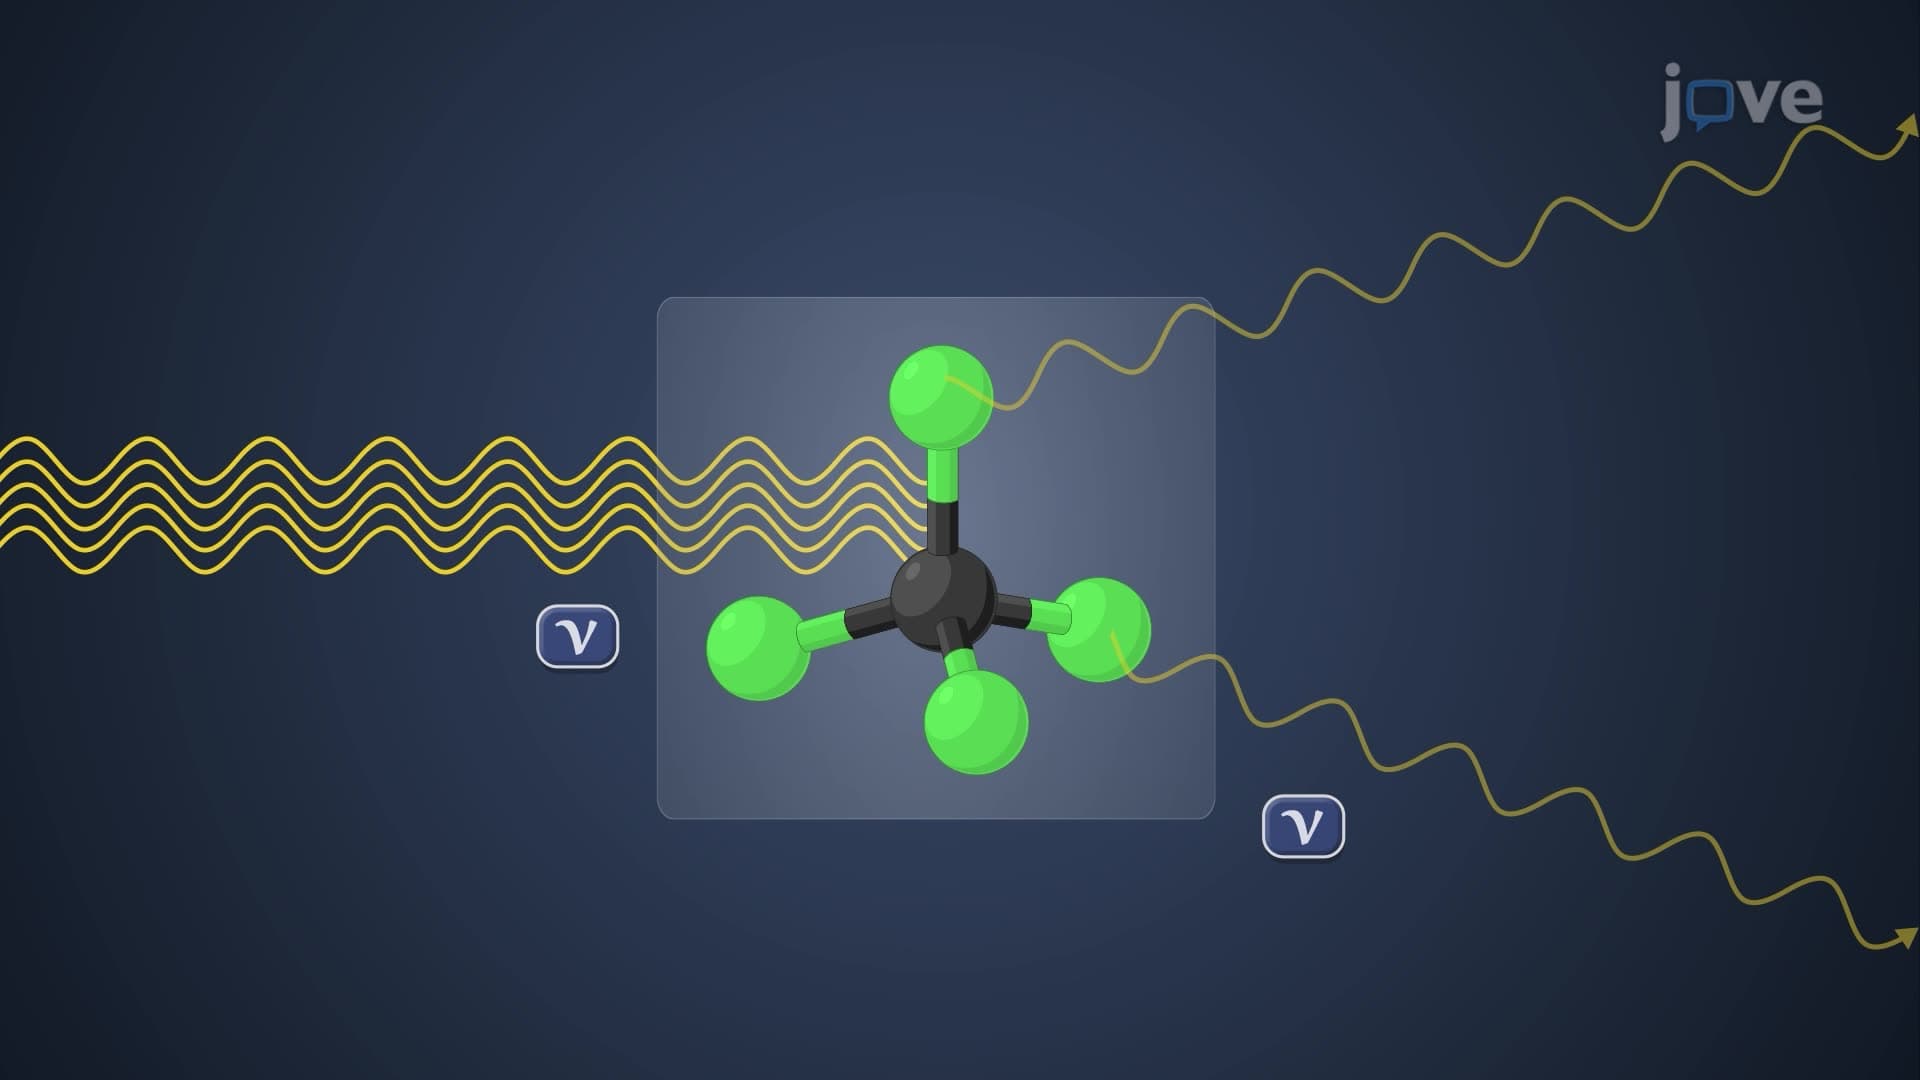
An IR spectrum functions as a molecular fingerprint, revealing how chemical bonds vibrate when exposed to infrared radiation. When molecules absorb IR energy, their bonds stretch, bend, and twist at specific frequencies, creating characteristic absorption patterns. This fundamental principle underlies countless applications from drug testing in US hospitals to quality assurance in American manufacturing facilities.
Interpreting Wavenumber IR Spectrum Measurements
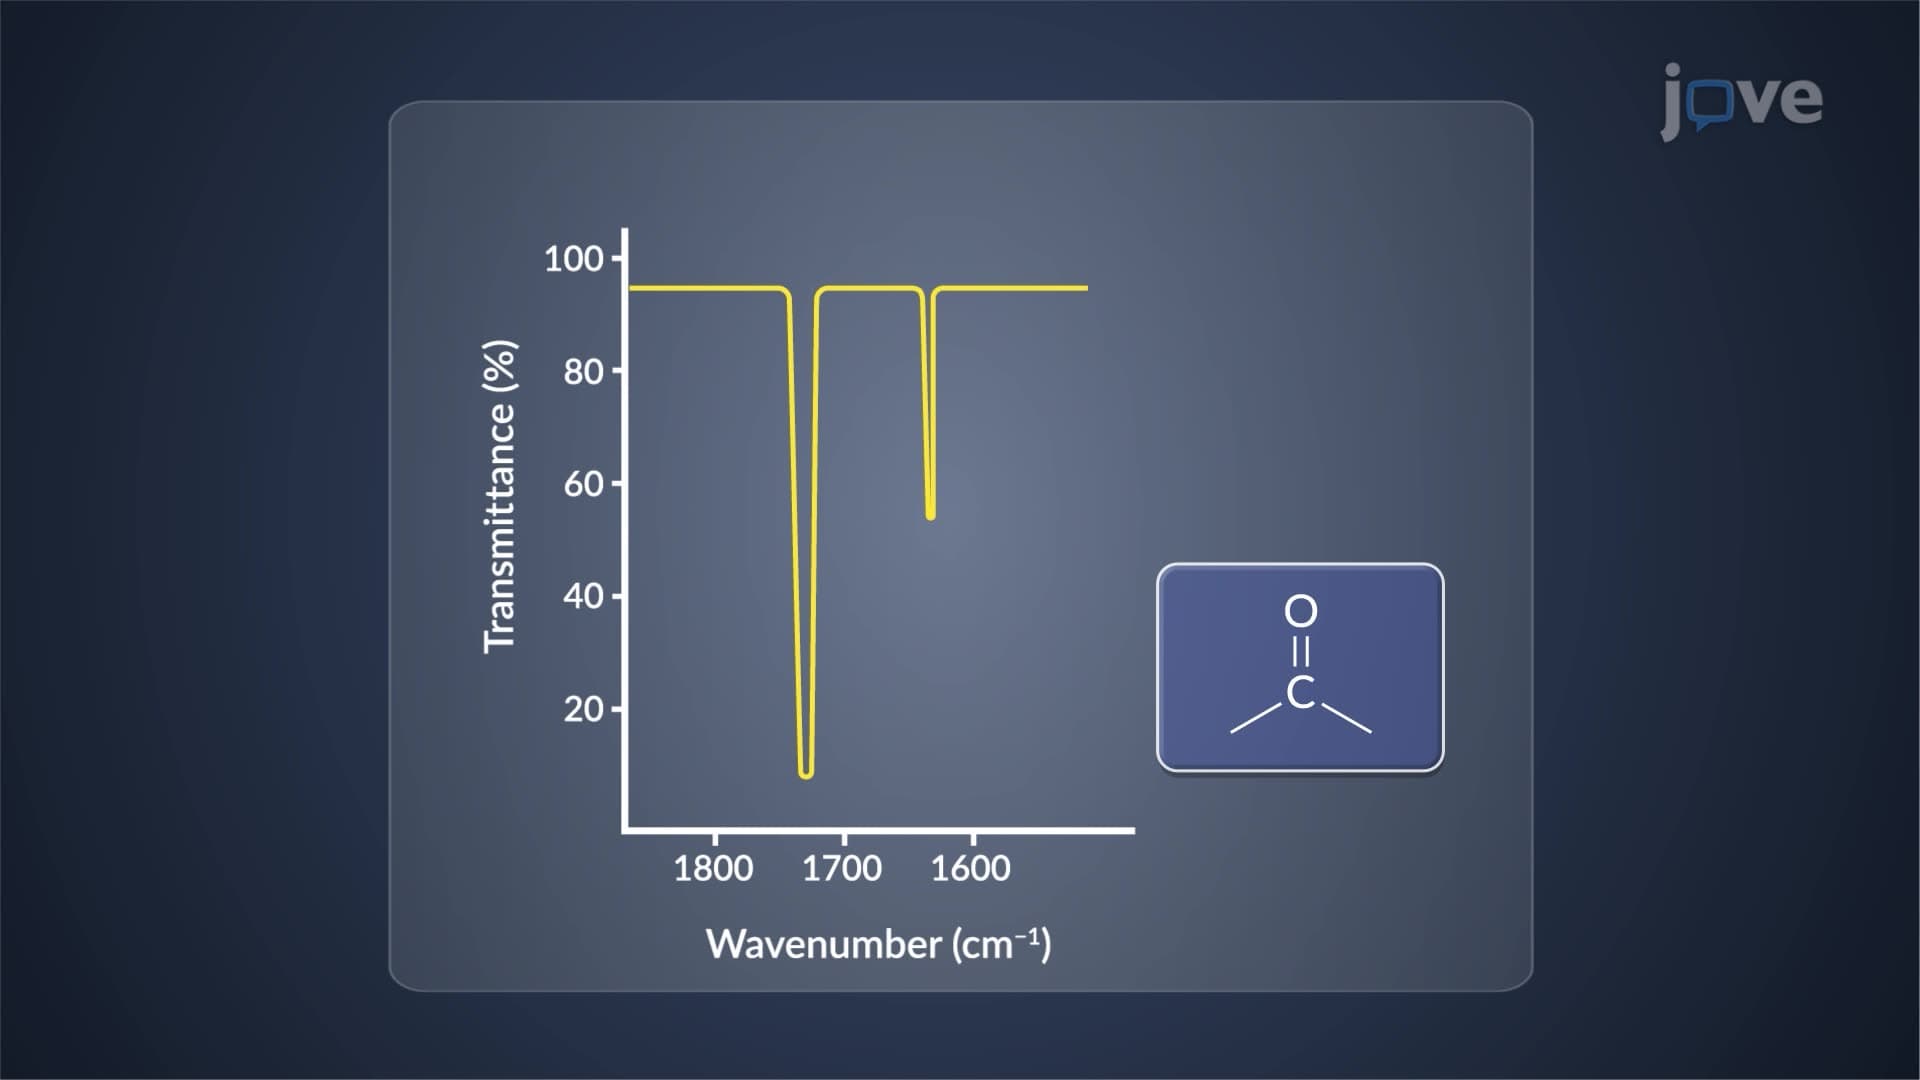
The x-axis of an IR spectrum displays wavenumbers (cm⁻¹), which directly correlate to energy levels. Higher wavenumbers (left side, 3000-4000 cm⁻¹) represent high-energy vibrations like O-H and N-H stretches, while lower wavenumbers (right side, below 1500 cm⁻¹) indicate lower-energy motions. Students preparing for AP Chemistry or college organic chemistry courses must memorize key ranges: C-H stretches appear around 2850-3000 cm⁻¹, C=O stretches near 1700 cm⁻¹, and C-C stretches around 1000-1300 cm⁻¹.
Transmittance IR Spectrum Analysis and Absorption Bands
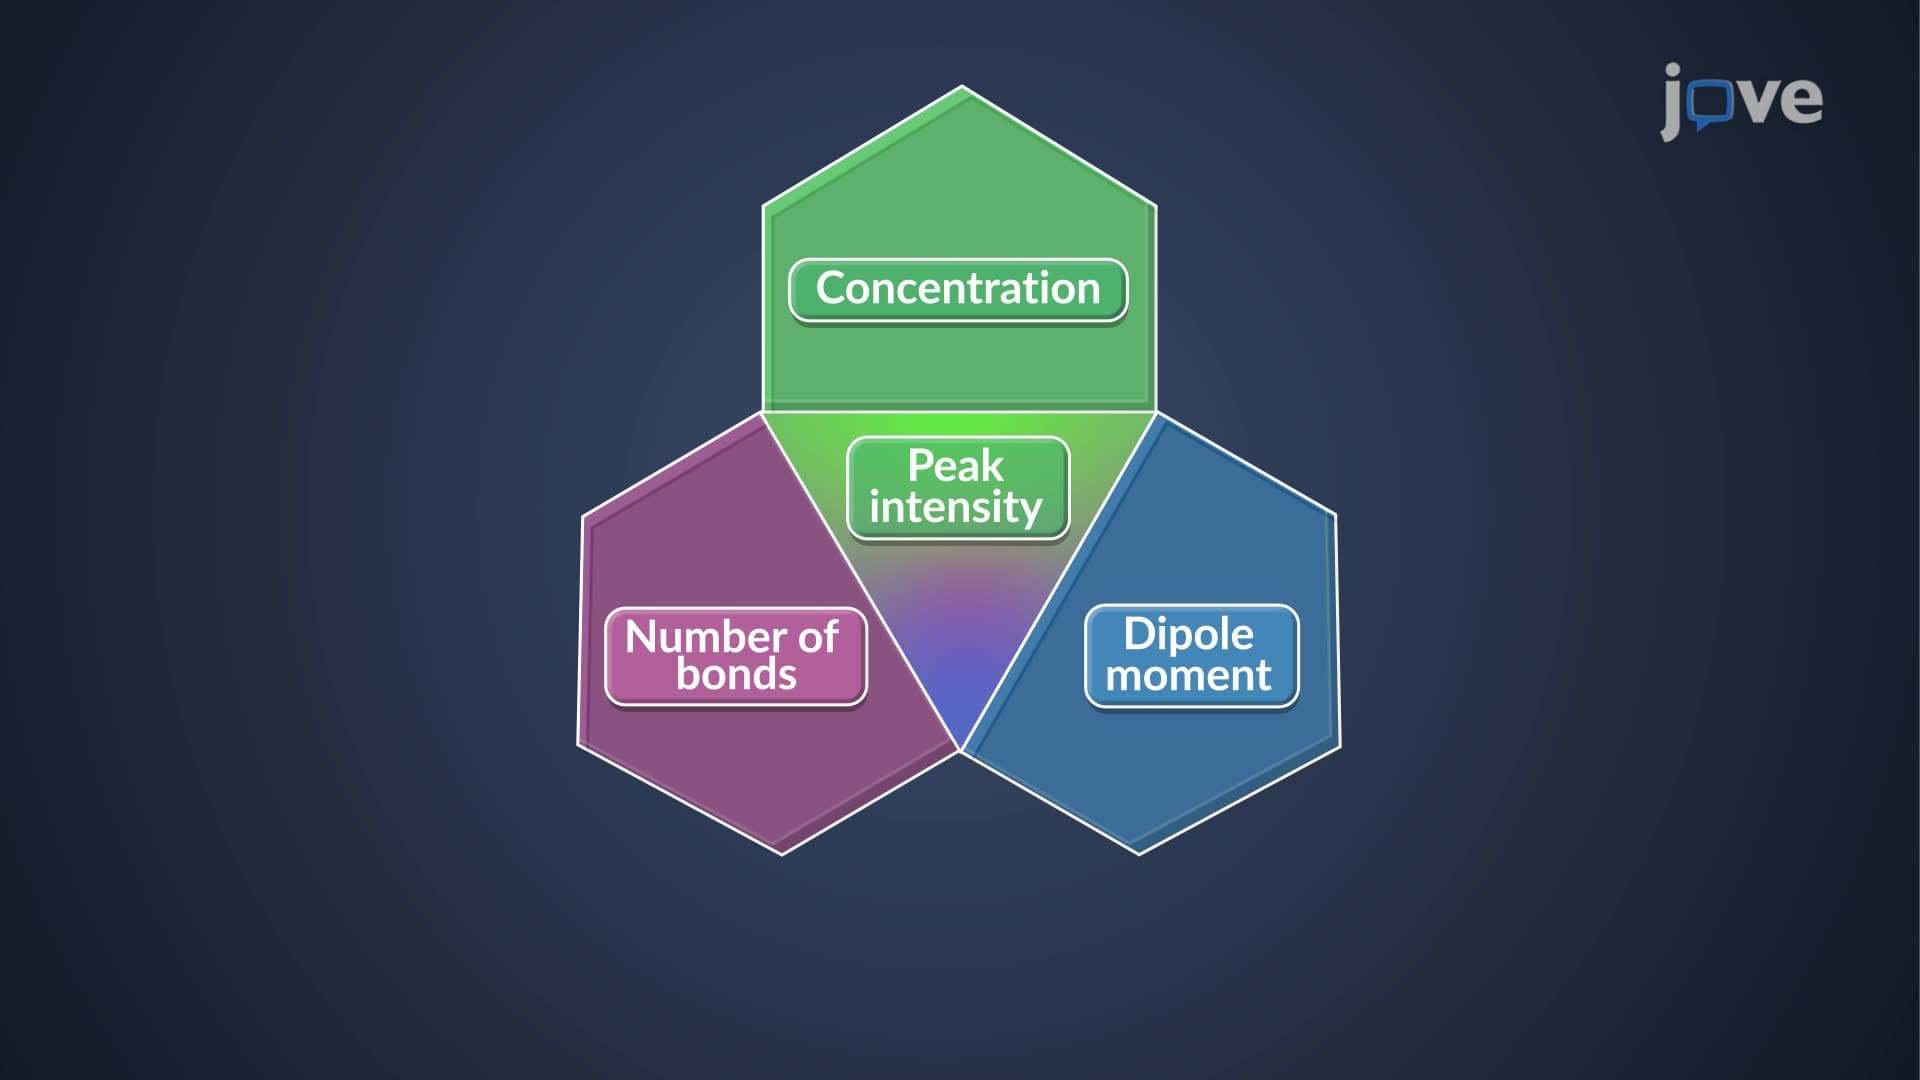
Transmittance measures how much IR light passes through a sample, expressed as percentages on the y-axis. Strong absorption bands appear as deep valleys (low transmittance), while weak absorptions show shallow dips. Understanding this relationship proves essential for MCAT preparation, where students must interpret spectra to identify unknown compounds or confirm molecular structures.
Functional Groups and Diagnostic Regions
IR absorption bands functional groups create predictable patterns in two key regions. The diagnostic region (1500-4000 cm⁻¹) contains characteristic peaks for major functional groups, making identification straightforward. For example, alcohols show broad O-H stretches around 3200-3600 cm⁻¹, while carbonyls produce sharp C=O peaks near 1700 cm⁻¹. The fingerprint region (below 1500 cm⁻¹) provides unique patterns for each molecule, allowing distinction between structural isomers that share identical functional groups but differ in connectivity.
Real-World Applications in US Industries
American pharmaceutical companies like Pfizer and Merck routinely use IR spectroscopy for drug identification and purity testing. Environmental agencies employ this technique to monitor air quality and identify pollutants. In academic settings, students encounter IR spectrum interpretation in organic chemistry labs, analytical chemistry courses, and standardized exams including the MCAT and advanced placement tests.
Frequently Asked Questions
An IR spectrum is a graph showing how molecules absorb infrared light at specific frequencies, creating unique "fingerprints" for chemical identification. It plots percentage transmittance (y-axis) against wavenumber (x-axis), with absorption bands appearing as downward peaks. This technique works because molecular bonds vibrate at characteristic frequencies, making it invaluable for structure determination and compound identification.
Focus on the diagnostic region (1500-4000 cm⁻¹) first to identify major functional groups using peak positions and shapes. Look for broad O-H stretches around 3200-3600 cm⁻¹, sharp C=O peaks near 1700 cm⁻¹, and C-H stretches around 2850-3000 cm⁻¹. Then examine the fingerprint region below 1500 cm⁻¹ for unique molecular patterns that distinguish between similar compounds.
Memorize these key ranges: O-H stretch (3200-3600 cm⁻¹, broad), N-H stretch (3300-3500 cm⁻¹), C-H stretch (2850-3000 cm⁻¹), C=O stretch (1700 cm⁻¹, sharp), and C=C stretch (1620-1680 cm⁻¹). These functional groups appear frequently in MCAT organic chemistry passages. Practice identifying these peaks in different molecular contexts to build recognition speed.
IR spectroscopy uniquely reveals molecular vibrations and functional group presence without destroying the sample. Unlike mass spectrometry (which fragments molecules) or NMR (which requires expensive equipment), IR provides rapid, non-destructive identification of chemical bonds. It's particularly excellent for distinguishing between functional group isomers and confirming the presence of specific bonds like carbonyls or hydroxyls.
The FBI and state crime labs use IR spectroscopy to identify unknown substances like drugs, explosives, and paint chips. For example, forensic chemists can distinguish between different types of cocaine or identify specific polymer compositions in hit-and-run cases. The technique provides courtroom-admissible evidence because each compound produces a unique spectral fingerprint that serves as definitive chemical identification.
IR spectrum interpretation is highly manageable with proper practice and memorization of key functional group ranges. Most high school AP Chemistry students successfully learn to identify major peaks and functional groups. Start with simple molecules containing one or two functional groups, then progress to more complex structures. The pattern recognition becomes intuitive with consistent practice.
Create flashcards linking functional groups to their characteristic wavenumber ranges and peak shapes. Practice with unknown spectra daily, starting with simple compounds and progressing to complex molecules. Use online databases like NIST to compare your interpretations with known spectra. Focus on speed and accuracy since exams typically provide limited time for spectral analysis questions.
Progress to NMR spectroscopy, which provides complementary structural information about carbon and hydrogen environments. Mass spectrometry offers molecular weight determination and fragmentation patterns. Combined with IR data, these techniques provide complete molecular structure determination, essential for advanced organic chemistry courses and professional laboratory work.
Related Micro-courses

17 Concepts

15 Concepts