Loading subject page…


2,228 views

Video Summary: What Is Plotting of Topographic Maps
Ever wondered how cartographers transform California's towering Sierra Nevada peaks into flat paper maps that hikers use to navigate safely? Methods of obtaining topography include sophisticated plotting techniques that convert three-dimensional terrain into precise two-dimensional representations. The plotting of topographic maps uses contour lines and elevation data to create accurate visualizations-essential tools used by the US Geological Survey for everything from urban planning to wildfire management. Watch the full video on JoVE Coach to master this concept with expert-led visuals and step-by-step explanations.
Methods of obtaining topography have evolved significantly, but the fundamental plotting process remains critical for creating accurate terrain representations. The plotting of topographic maps transforms complex three-dimensional landscapes into comprehensible two-dimensional formats that professionals and students can interpret effectively. This process begins with establishing a scaled grid system that corresponds to real-world coordinates, typically using the Universal Transverse Mercator (UTM) system preferred by US agencies.
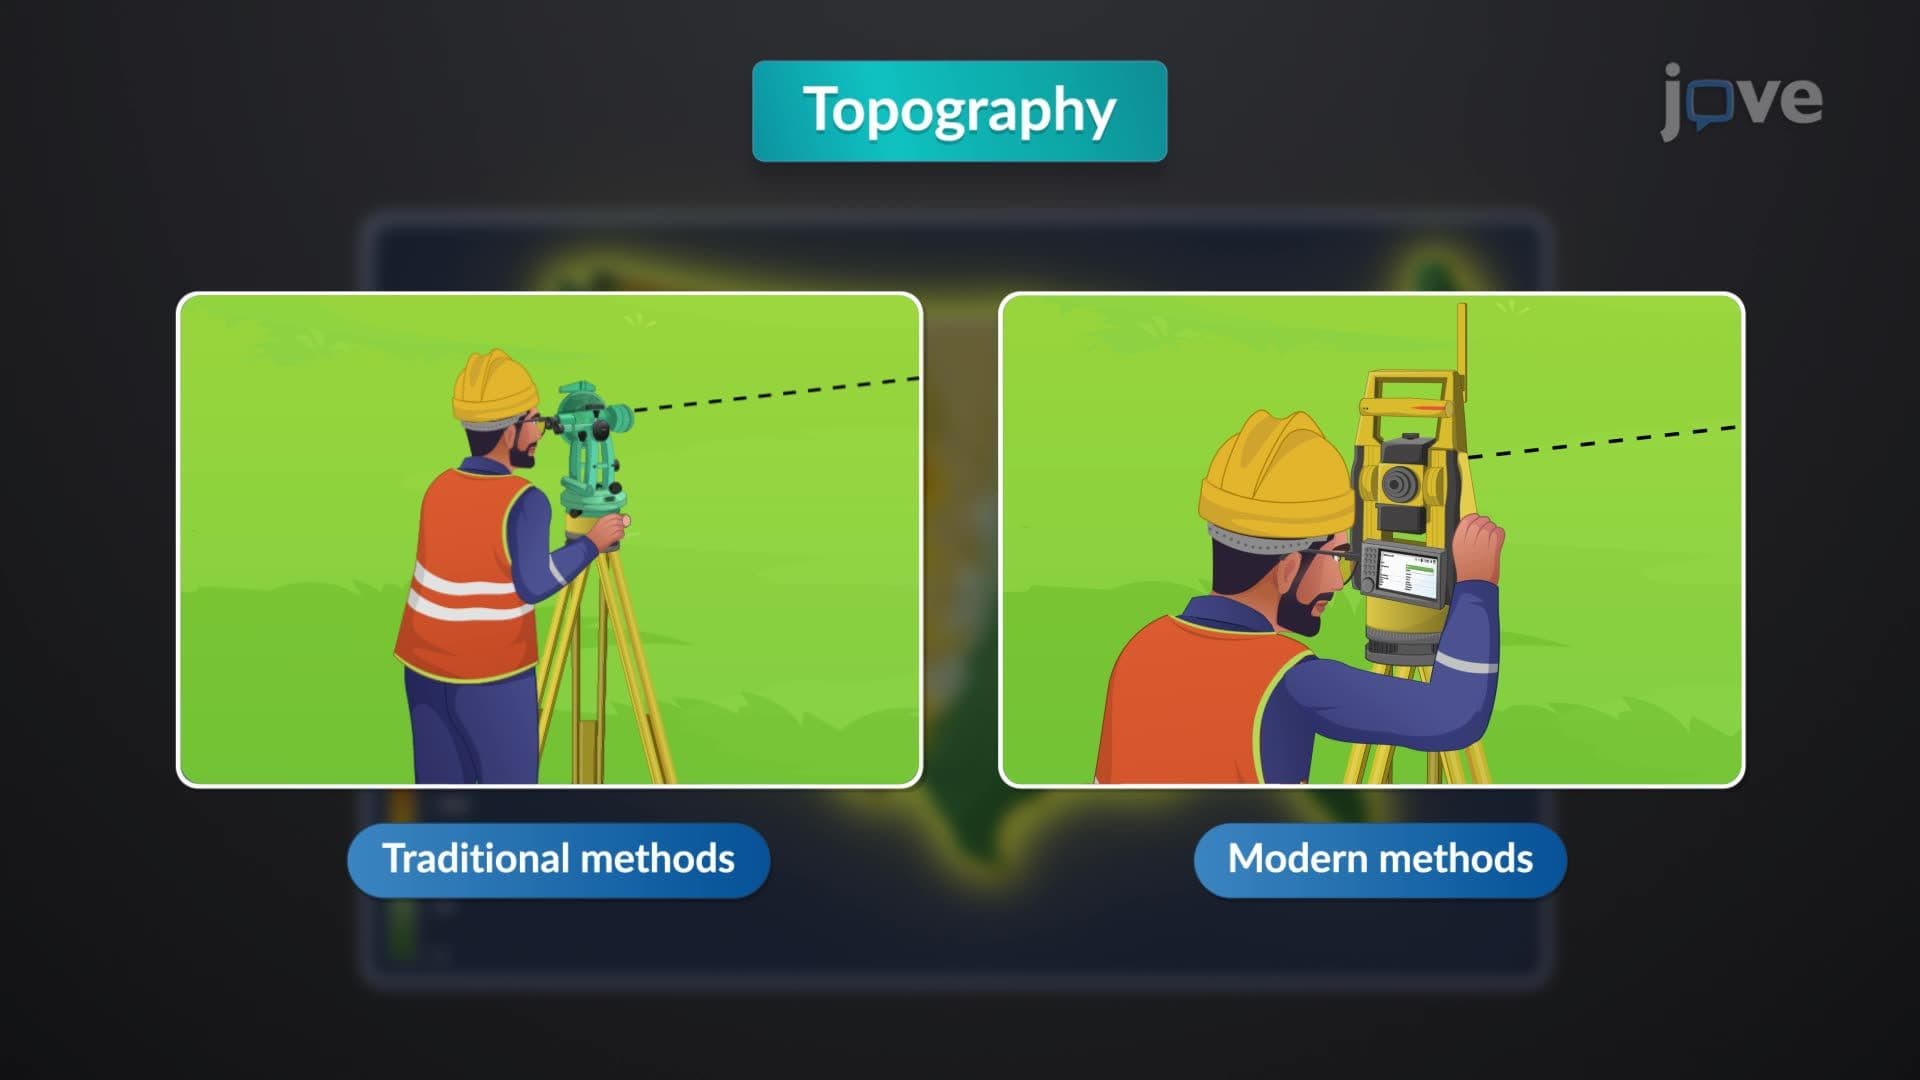
The foundation of topographic mapping lies in creating a precise coordinate system. Surveyors and cartographers establish grid intersections that correspond to specific geographic locations where elevation measurements have been taken. In the United States, the National Geodetic Survey provides standardized benchmarks that serve as reference points for these measurements. Students learning types of methods of obtaining topography should understand that modern techniques include GPS surveying, LiDAR scanning, and traditional theodolite measurements.
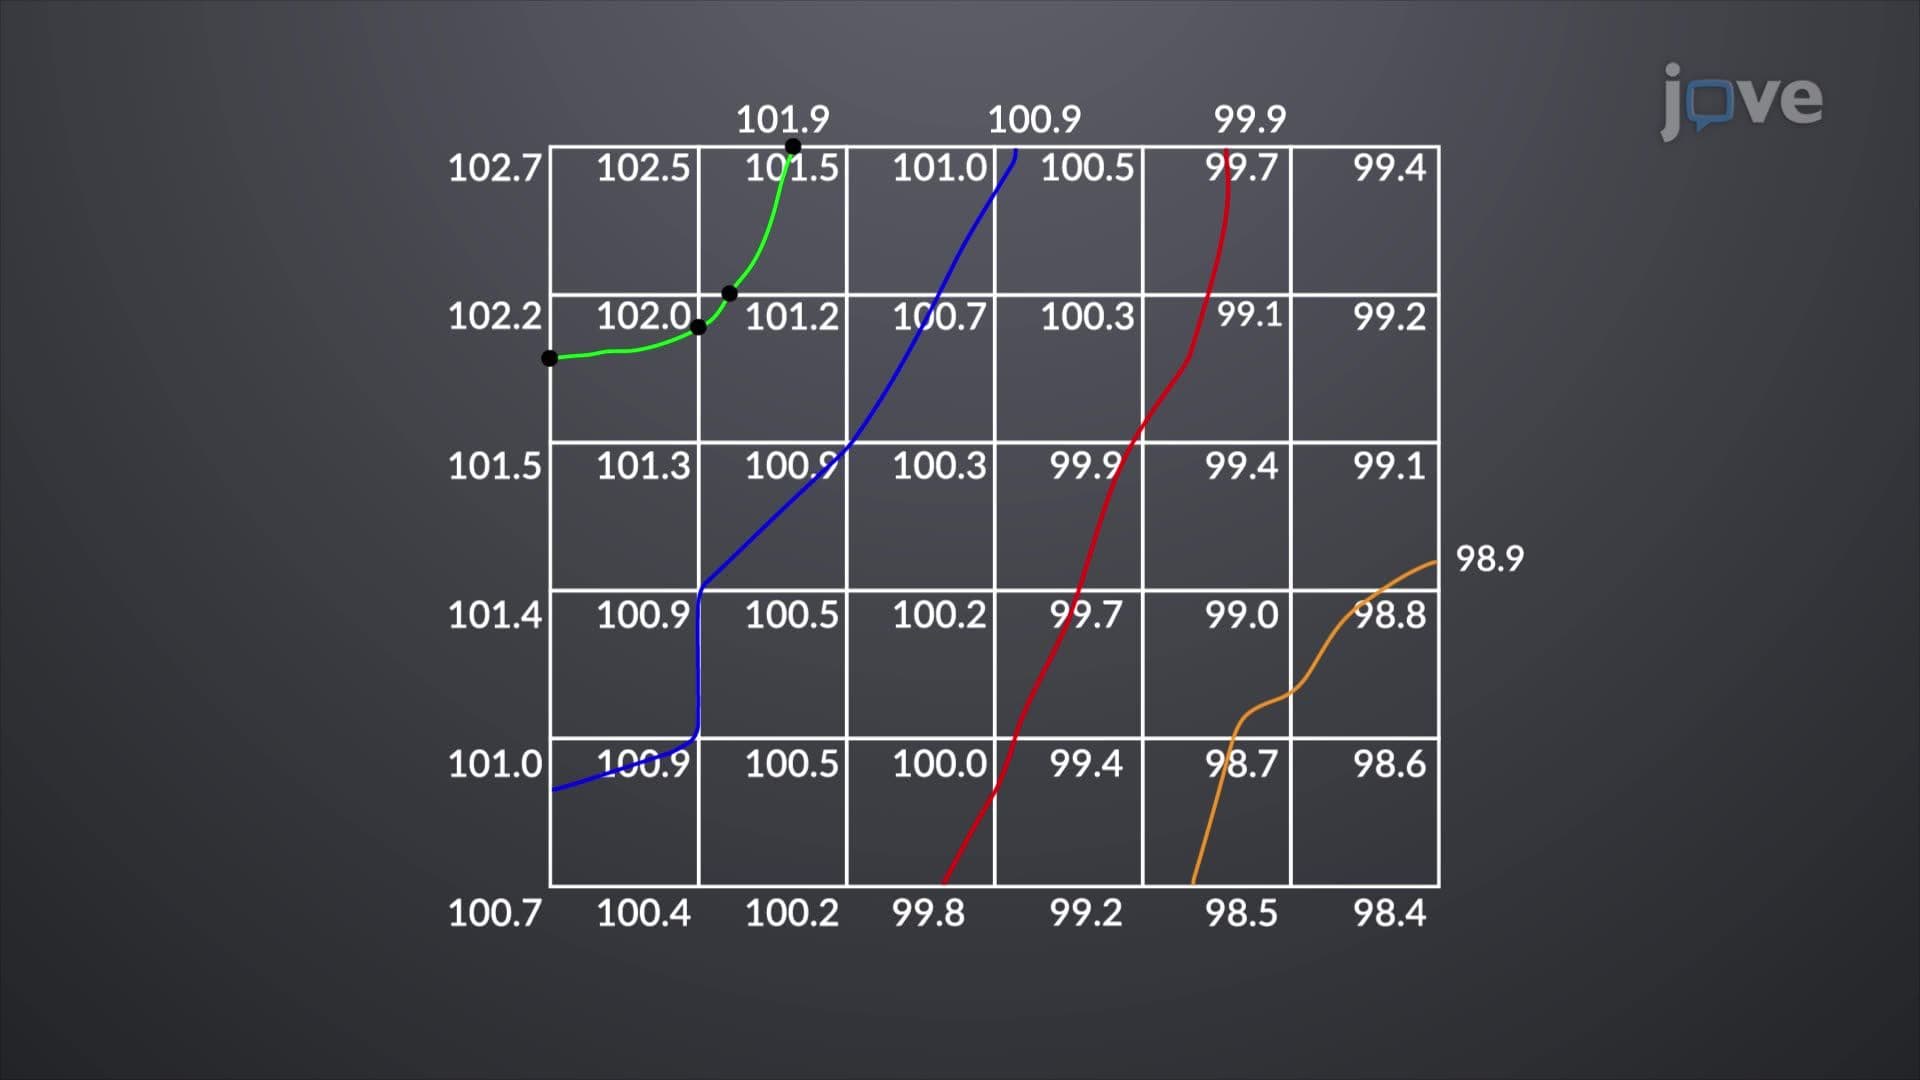
Each elevation data point gets plotted at its corresponding grid intersection, creating a network of known heights across the mapped area. This systematic approach ensures that the resulting topographic map maintains geographic accuracy essential for applications ranging from AP Environmental Science projects to professional engineering surveys.
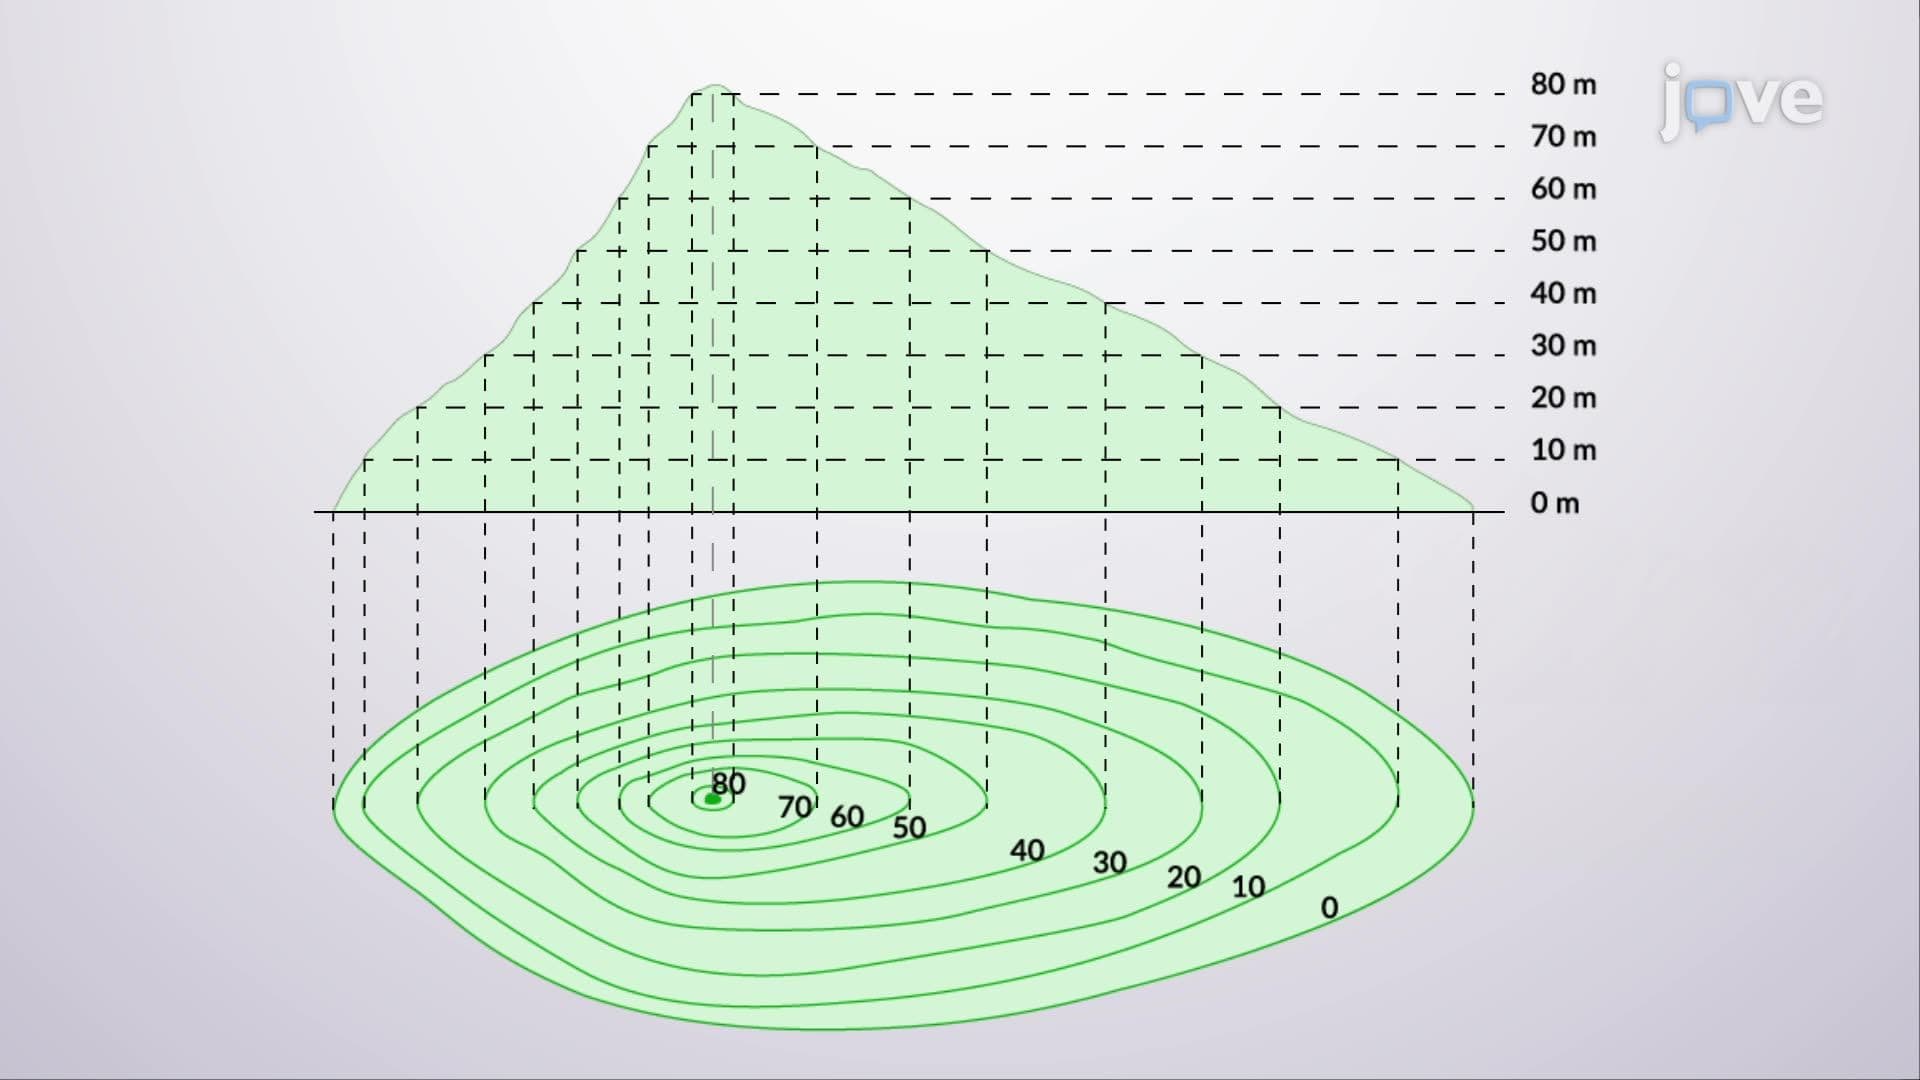
The most critical aspect of topographic plotting involves creating contour lines-imaginary lines connecting points of equal elevation. The methods of obtaining topography overview emphasizes that contour intervals must remain consistent throughout the entire map. For instance, if using 10-foot intervals, every contour line represents elevations that are multiples of 10 feet above sea level.
Interpolation becomes essential when determining where contour lines cross between surveyed points with different elevations. If one point measures 150 feet and an adjacent point measures 170 feet, the 160-foot contour line would cross proportionally between them. This mathematical precision ensures that topographic maps accurately represent terrain slopes and elevation changes.
Professional topographic mapping requires rigorous quality control measures. Contour lines must never intersect (except in rare overhanging cliff situations), and they must form closed loops around peaks and depressions. Students preparing for college-level geography or earth science exams should understand that these principles appear frequently in AP Human Geography and introductory geology courses.
Modern applications of topographic plotting extend far beyond traditional surveying. The Federal Emergency Management Agency (FEMA) uses detailed topographic maps for flood zone determination, while the US Forest Service relies on them for wildfire management planning. Understanding methods of obtaining topography concept prepares students for careers in environmental consulting, urban planning, and geospatial analysis.
Related Micro-courses