Loading concepts…


21 Concepts
14 Concepts
11 Concepts
11 Concepts
16 Concepts
8 Concepts
18 Concepts
12 Concepts
6 Concepts
12 Concepts
6 Concepts
5 Concepts
6 Concepts
9 Concepts
8 Concepts
8 Concepts
7 Concepts
9 Concepts
10 Concepts
8 Concepts
13 Concepts
5 Concepts
11 Concepts
10 Concepts
7 Concepts
6 Concepts
9 Concepts
10 Concepts
6 Concepts
9 Concepts
 9 Concepts
 1.9K Views
 Popular topics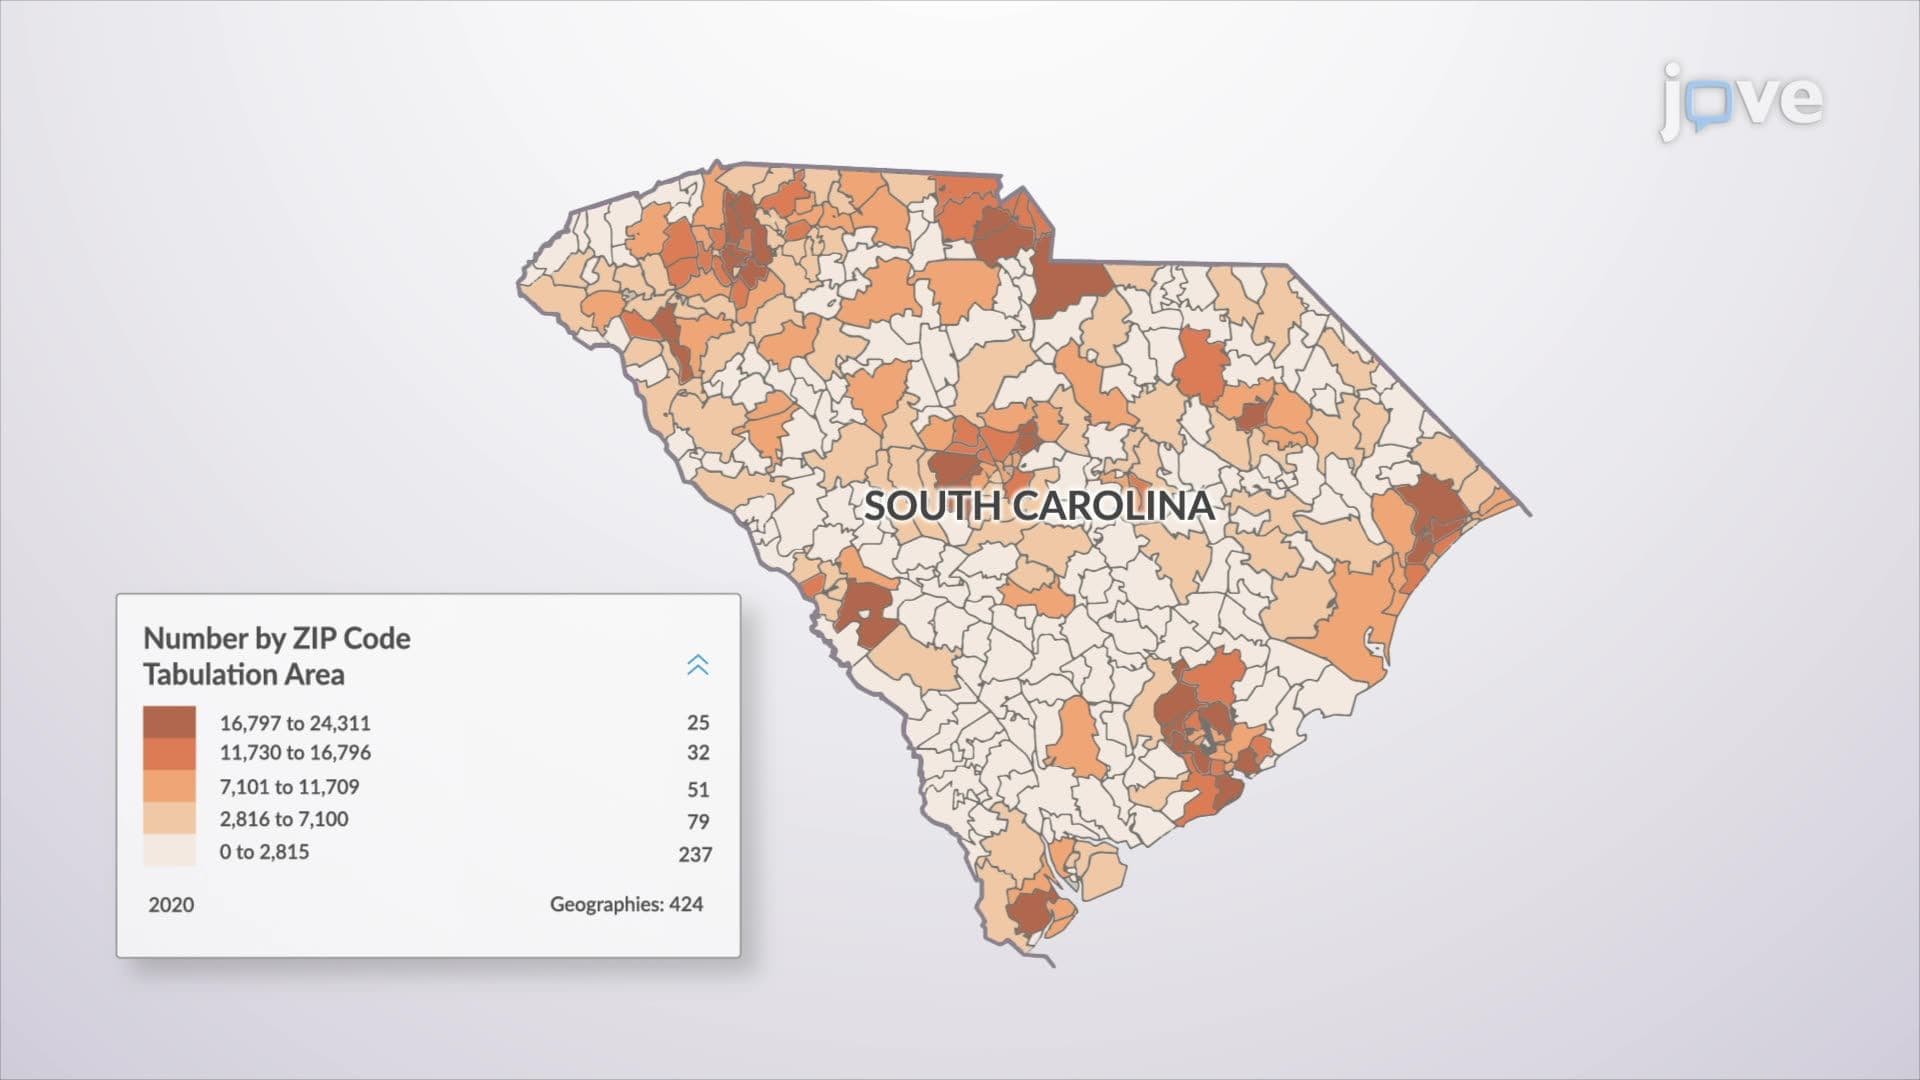
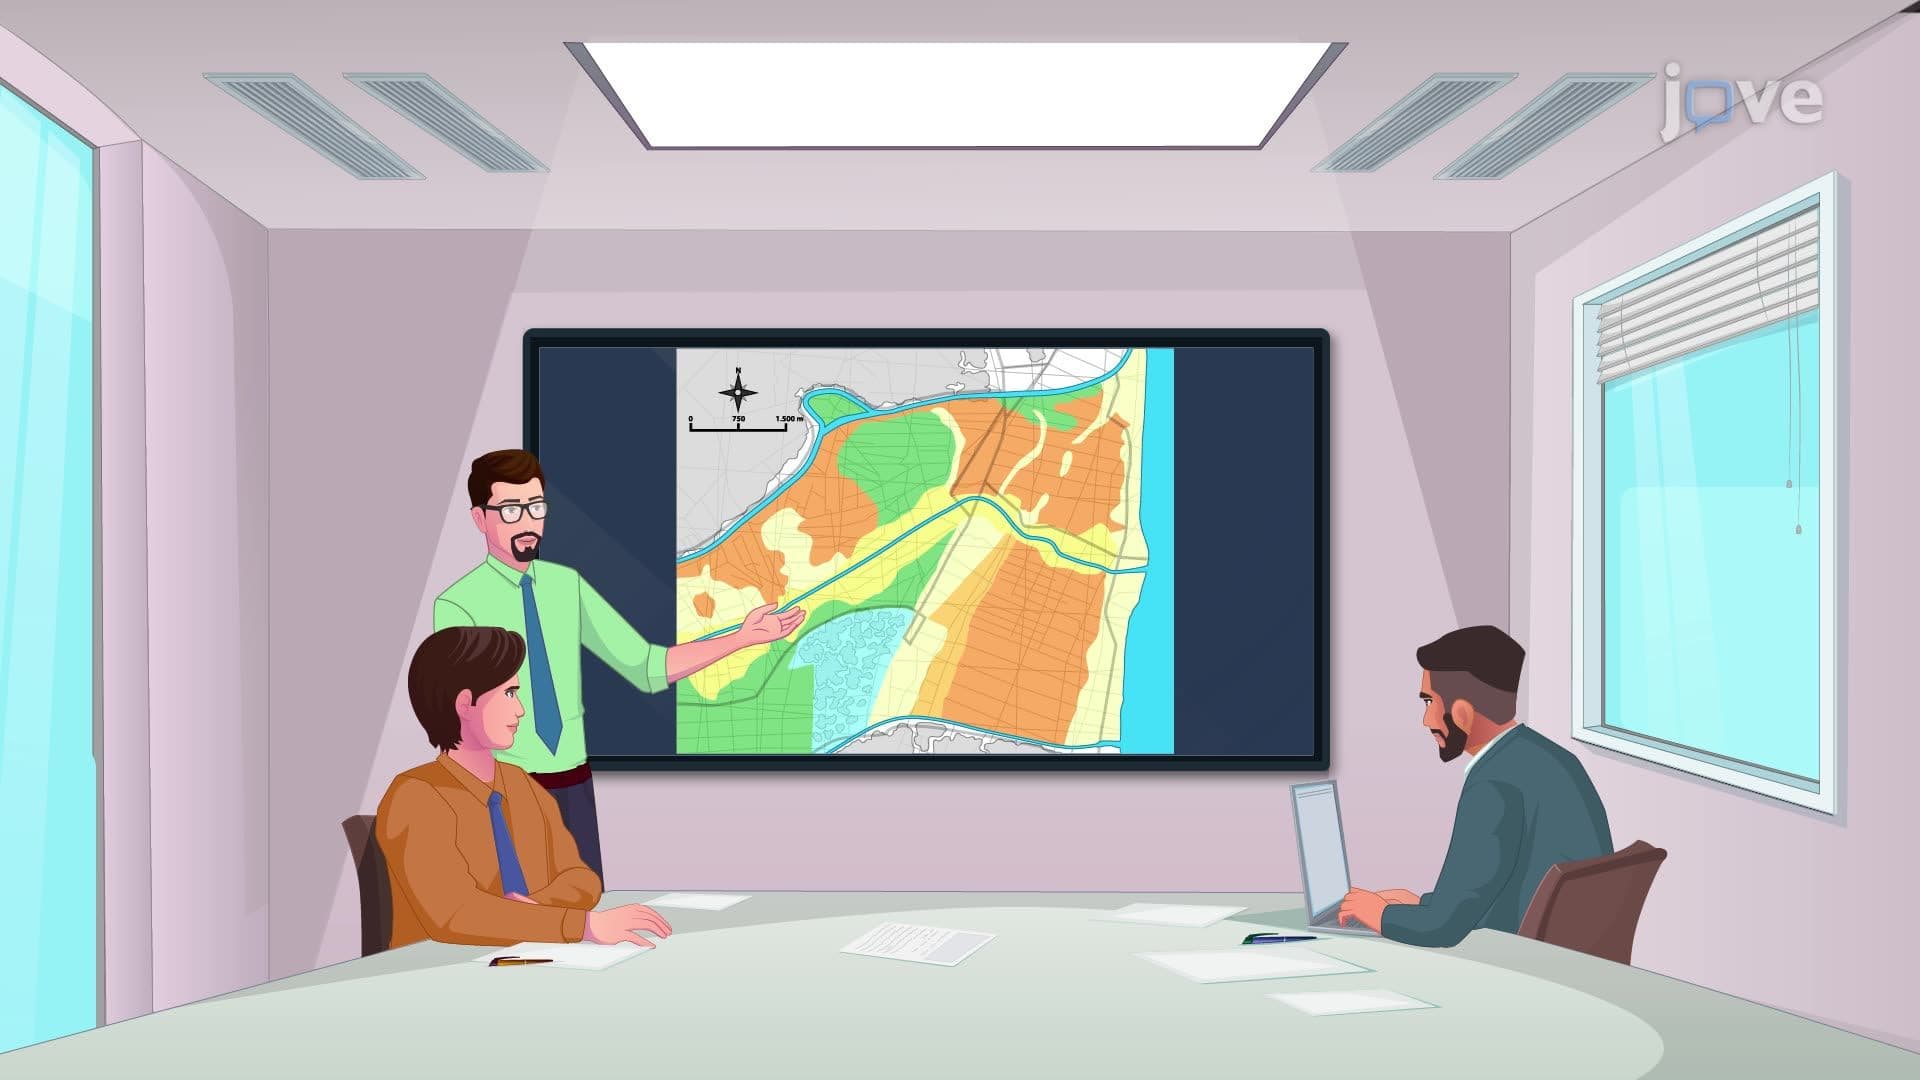


Geographic Information Systems (GIS) are computer-based tools that store, analyze, and visualize spatial data to solve real-world problems. From urban planning in cities like Boston to disaster response during California wildfires, GIS mapping software transforms raw geographic data into actionable insights. This comprehensive introduction to geographic information systems covers everything from basic data management to advanced spatial analysis, preparing students to understand how GIS revolutionizes decision-making across multiple disciplines with JoVE Coach.
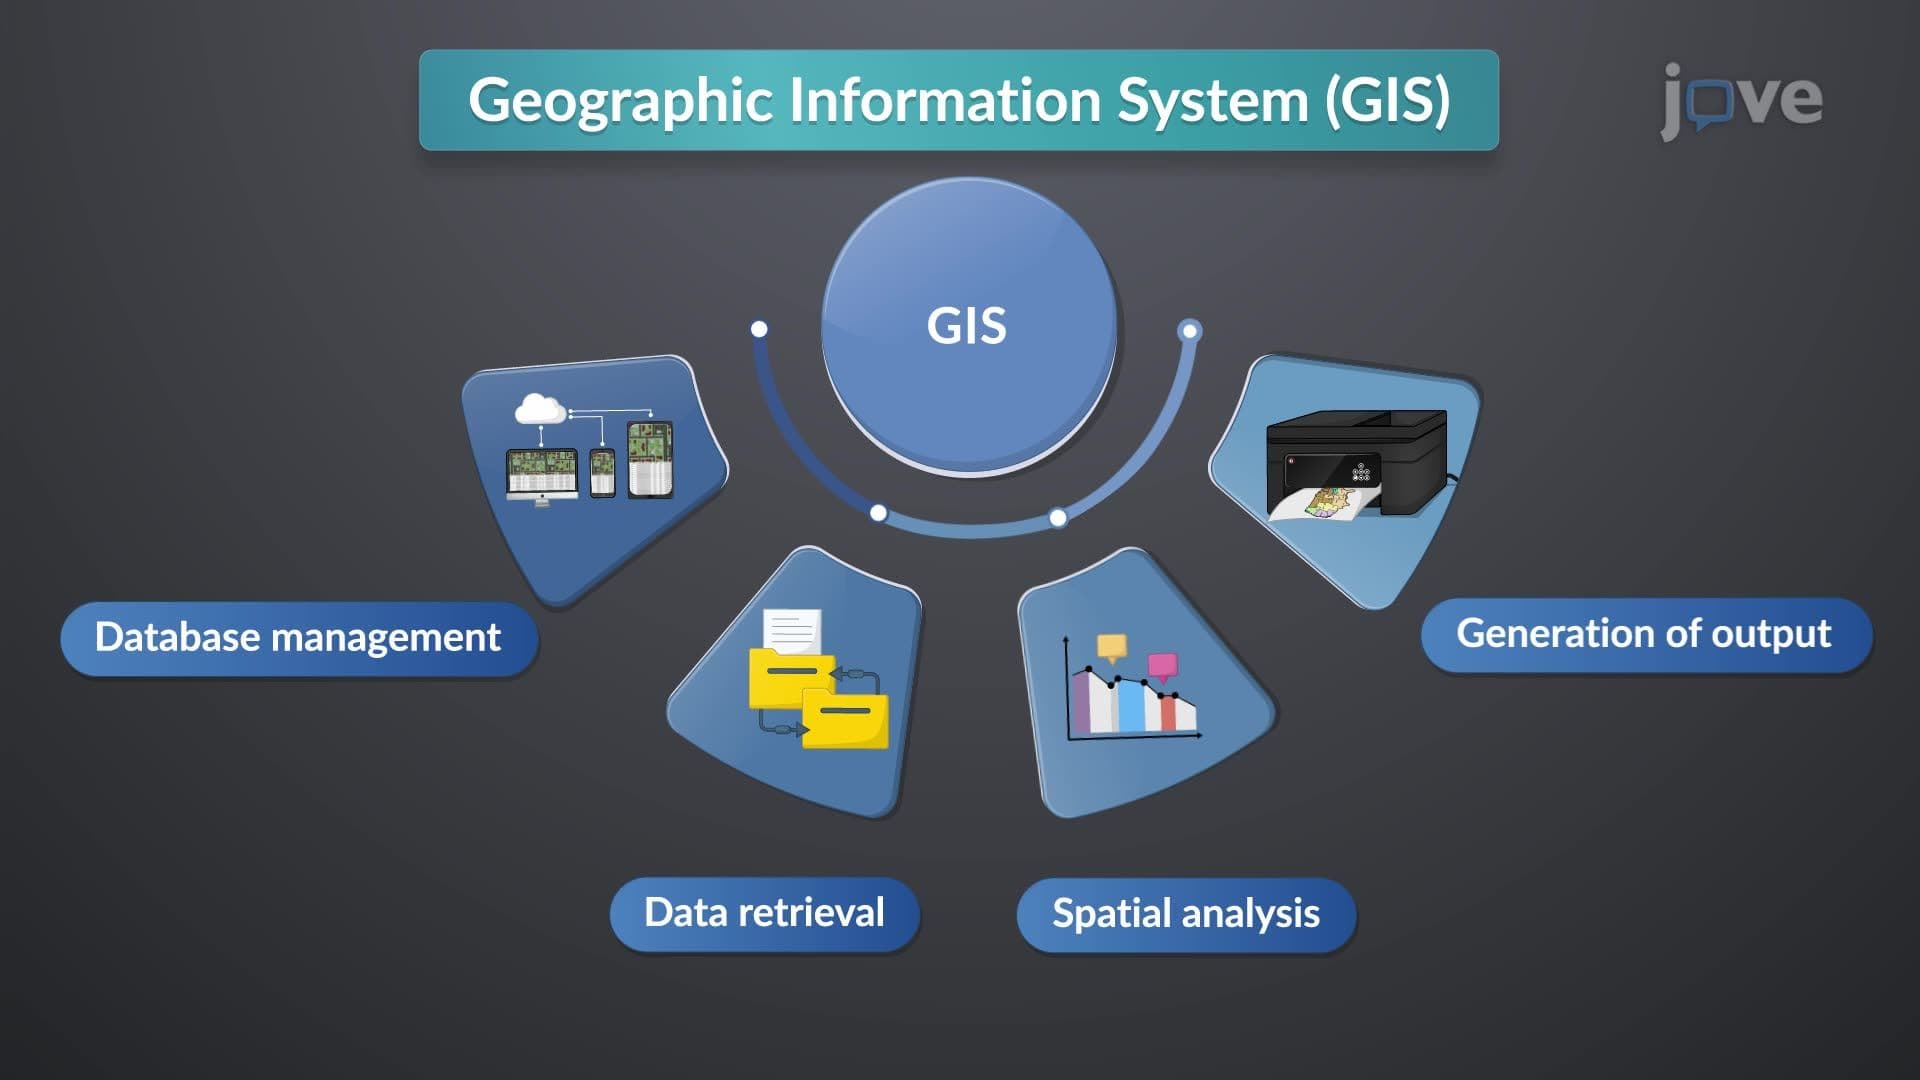
1. GIS Fundamentals and System Components Geographic Information Systems integrate cartography, database management, and remote sensing technologies to create powerful analytical tools. Modern GIS mapping software like ArcGIS and QGIS provides user-friendly interfaces for managing spatial databases, performing complex queries, and generating professional maps. The system architecture includes data input, storage, analysis, and output components that work together to transform raw geographic information into meaningful visualizations. Understanding these fundamentals is crucial for anyone working with spatial data in fields ranging from real estate development in Texas to environmental monitoring in Yellowstone National Park.
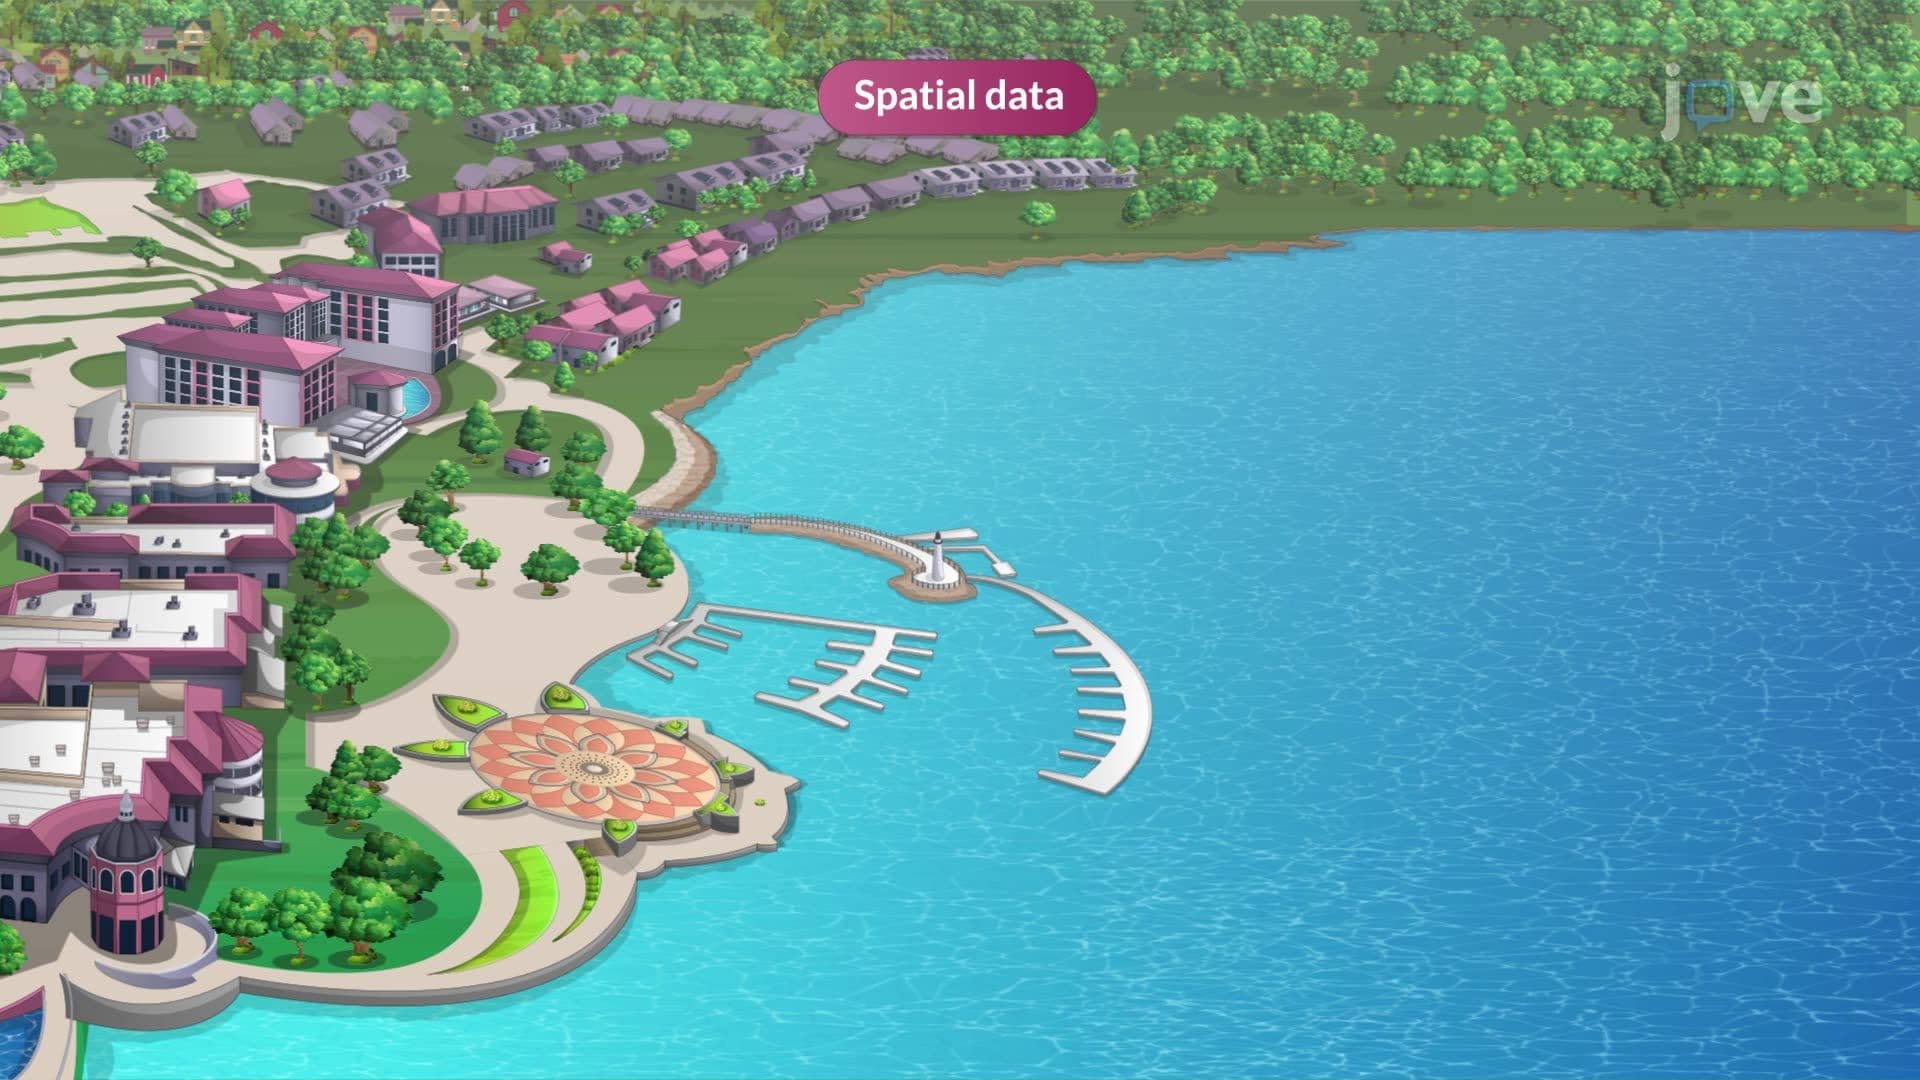
2. Spatial and Attribute Data Management GIS operates with two primary data types: spatial data defining geographic locations using coordinates, and attribute data providing descriptive information about those locations. For example, a hospital location in Chicago would have spatial data (latitude/longitude coordinates) and attribute data (number of beds, specialties, emergency services). Effective data management involves organizing, storing, and retrieving this information efficiently. Students learn how proper data structure enables complex spatial queries, such as finding all hospitals within 10 miles of a highway accident or identifying census tracts with population densities exceeding 1,000 people per square mile.
3. Raster and Vector Data Models GIS layers utilize two fundamental data models for representing geographic features. The raster model divides areas into grid cells, making it ideal for continuous data like temperature maps of the continental United States or elevation models of the Rocky Mountains. The vector model uses points, lines, and polygons to represent discrete features-points for cities like Denver, lines for Interstate highways, and polygons for state boundaries or national parks. Understanding when to apply each model is essential for effective geospatial analysis, as vector data excels in precise measurements while raster data handles complex spatial relationships and continuous phenomena.
4. Thematic Layering and Data Integration Thematic layering revolutionizes how we analyze complex geographic problems by organizing information into distinct, stackable layers. Instead of spending months gathering property records, soil surveys, and zoning maps from different agencies, GIS users can overlay digital layers instantly. For instance, planning a new school in suburban Atlanta involves layering population density, existing schools, transportation networks, and environmental constraints. Each layer maintains its unique attributes while contributing to comprehensive analysis. This approach transforms planning timelines from months to hours while improving decision accuracy through simultaneous visualization of multiple data themes.
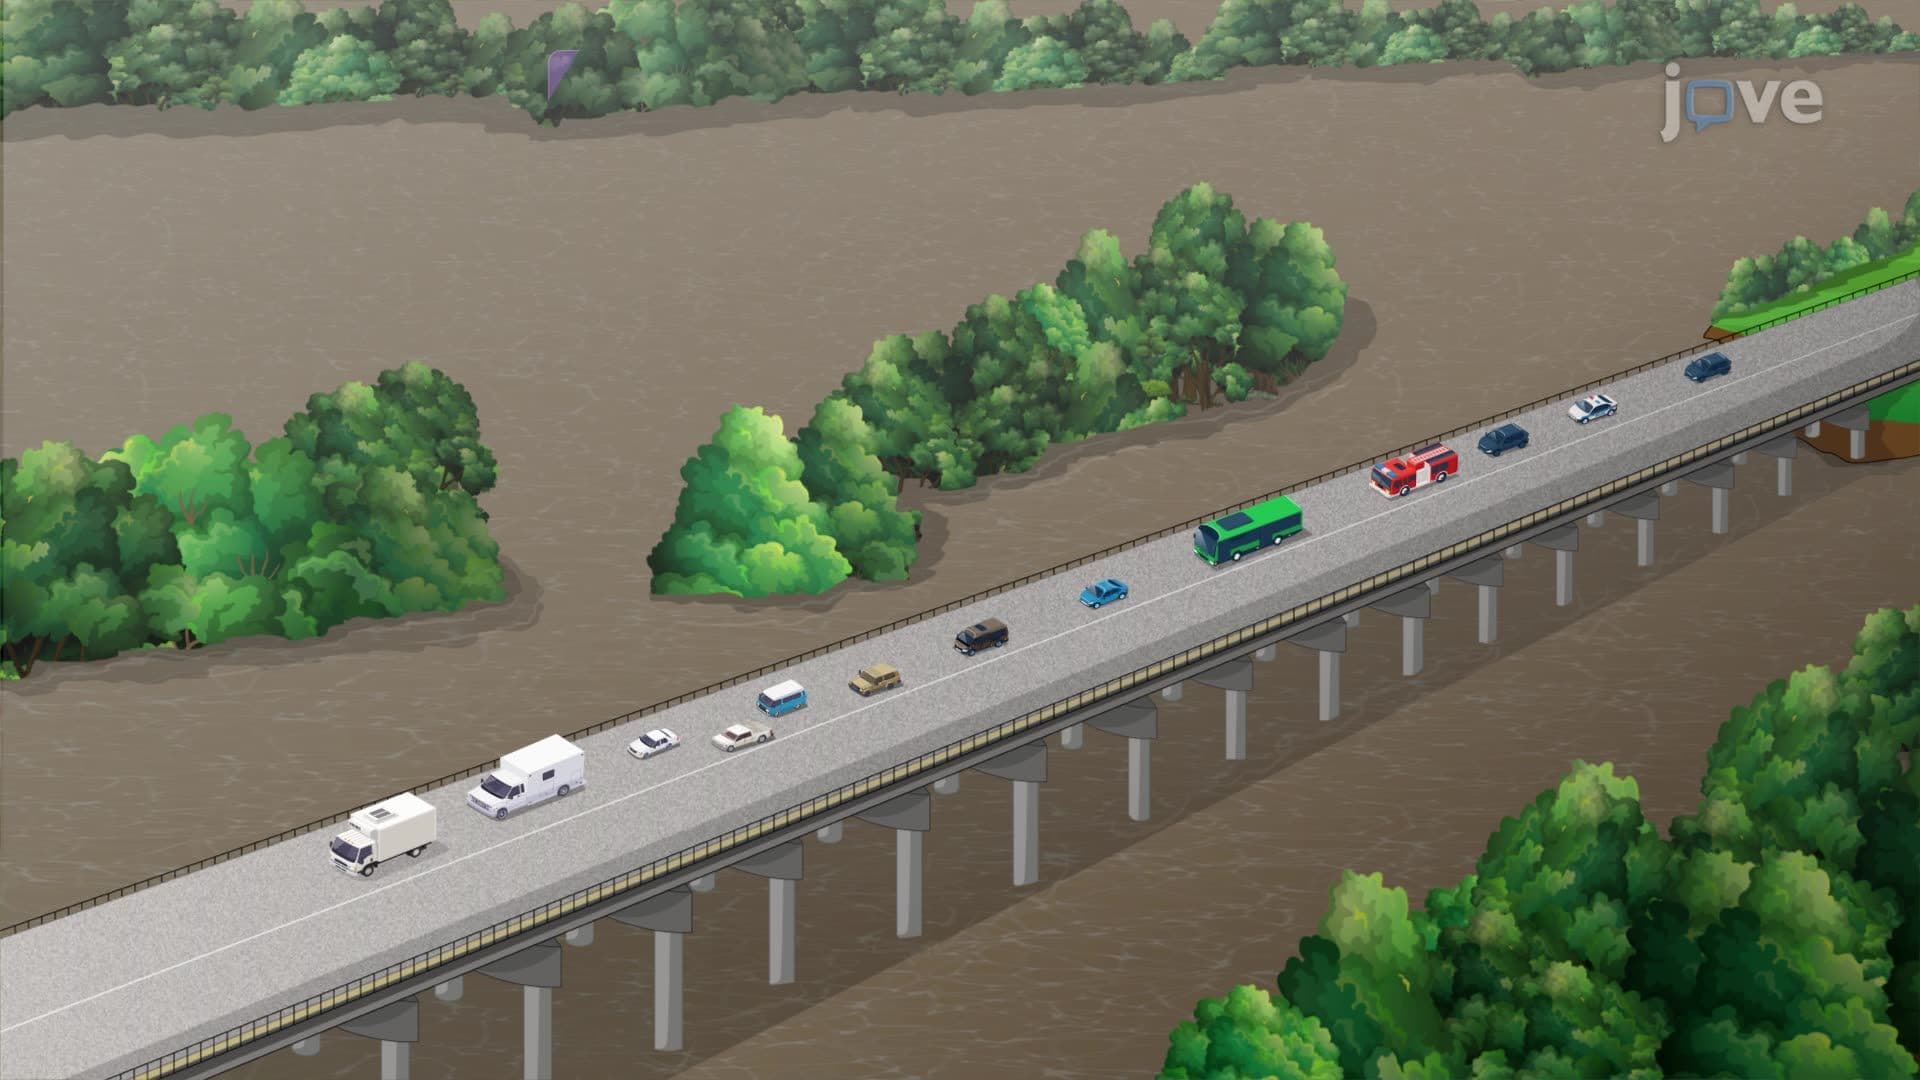
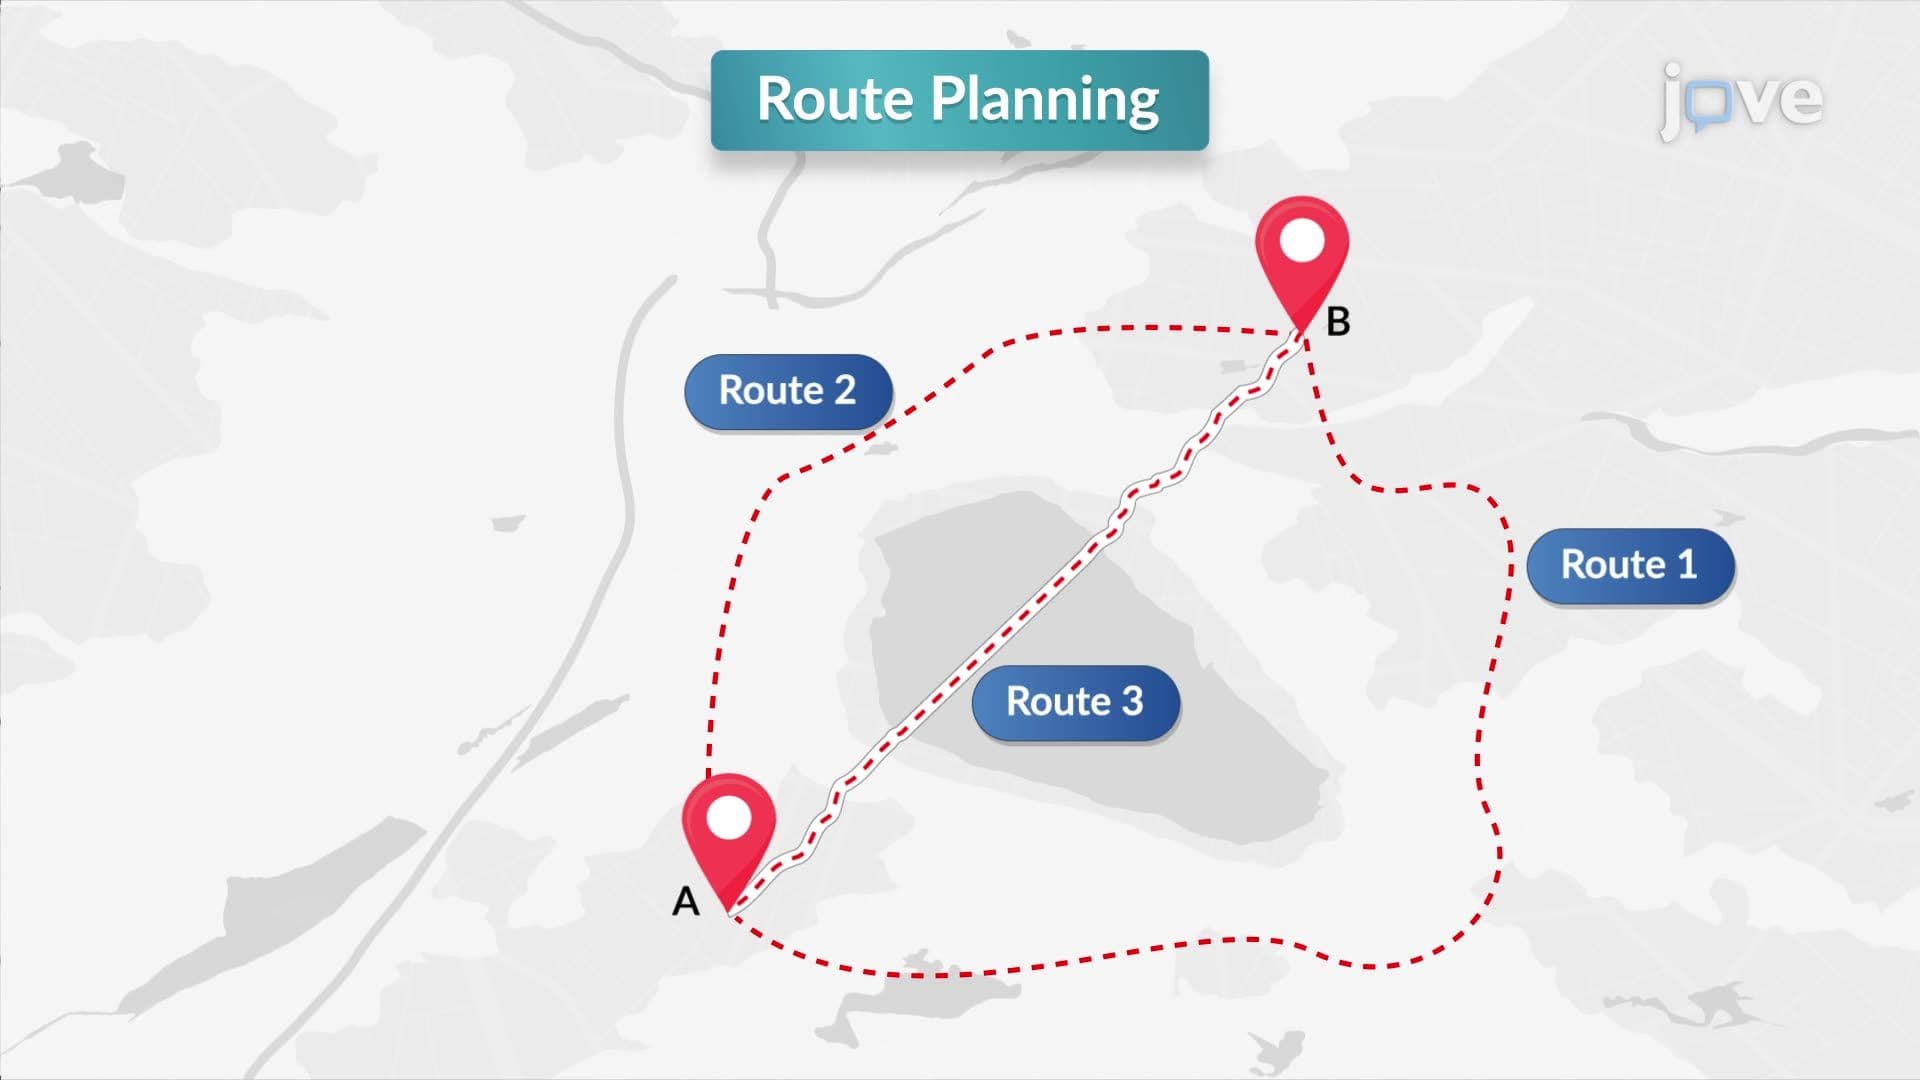
5. Spatial Analysis Techniques and Applications Advanced spatial analysis transforms basic mapping into powerful problem-solving tools. Buffering creates zones around features-such as identifying all residences within 500 feet of a proposed highway expansion in Ohio. Overlaying combines multiple layers to assess impacts, like determining which agricultural areas would be affected by a new reservoir in Iowa. Statistical spatial analysis reveals patterns and relationships, helping epidemiologists track disease clusters or retailers identify optimal store locations. The least-cost path method calculates efficient routes considering multiple constraints, essential for emergency vehicle routing during Hurricane evacuations along the Gulf Coast or planning hiking trails in National Forests.
6. Coordinate Systems and Map Projections Accurate spatial representation requires understanding coordinate systems and map projections that translate Earth's curved surface onto flat maps. Latitude and longitude provide global positioning, while specialized systems like State Plane Coordinates offer high precision for local projects. Different projections serve specific purposes: Mercator preserves direction for ocean navigation, while Albers Equal Area accurately represents the contiguous United States for national mapping projects. Universal Transverse Mercator (UTM) zones provide precise local mapping for engineering projects. Choosing appropriate coordinate systems ensures accurate measurements whether surveying property boundaries in Florida or mapping wilderness areas in Alaska, preventing costly errors in construction and planning projects.