Loading video…


 9 Concepts
 1.9K views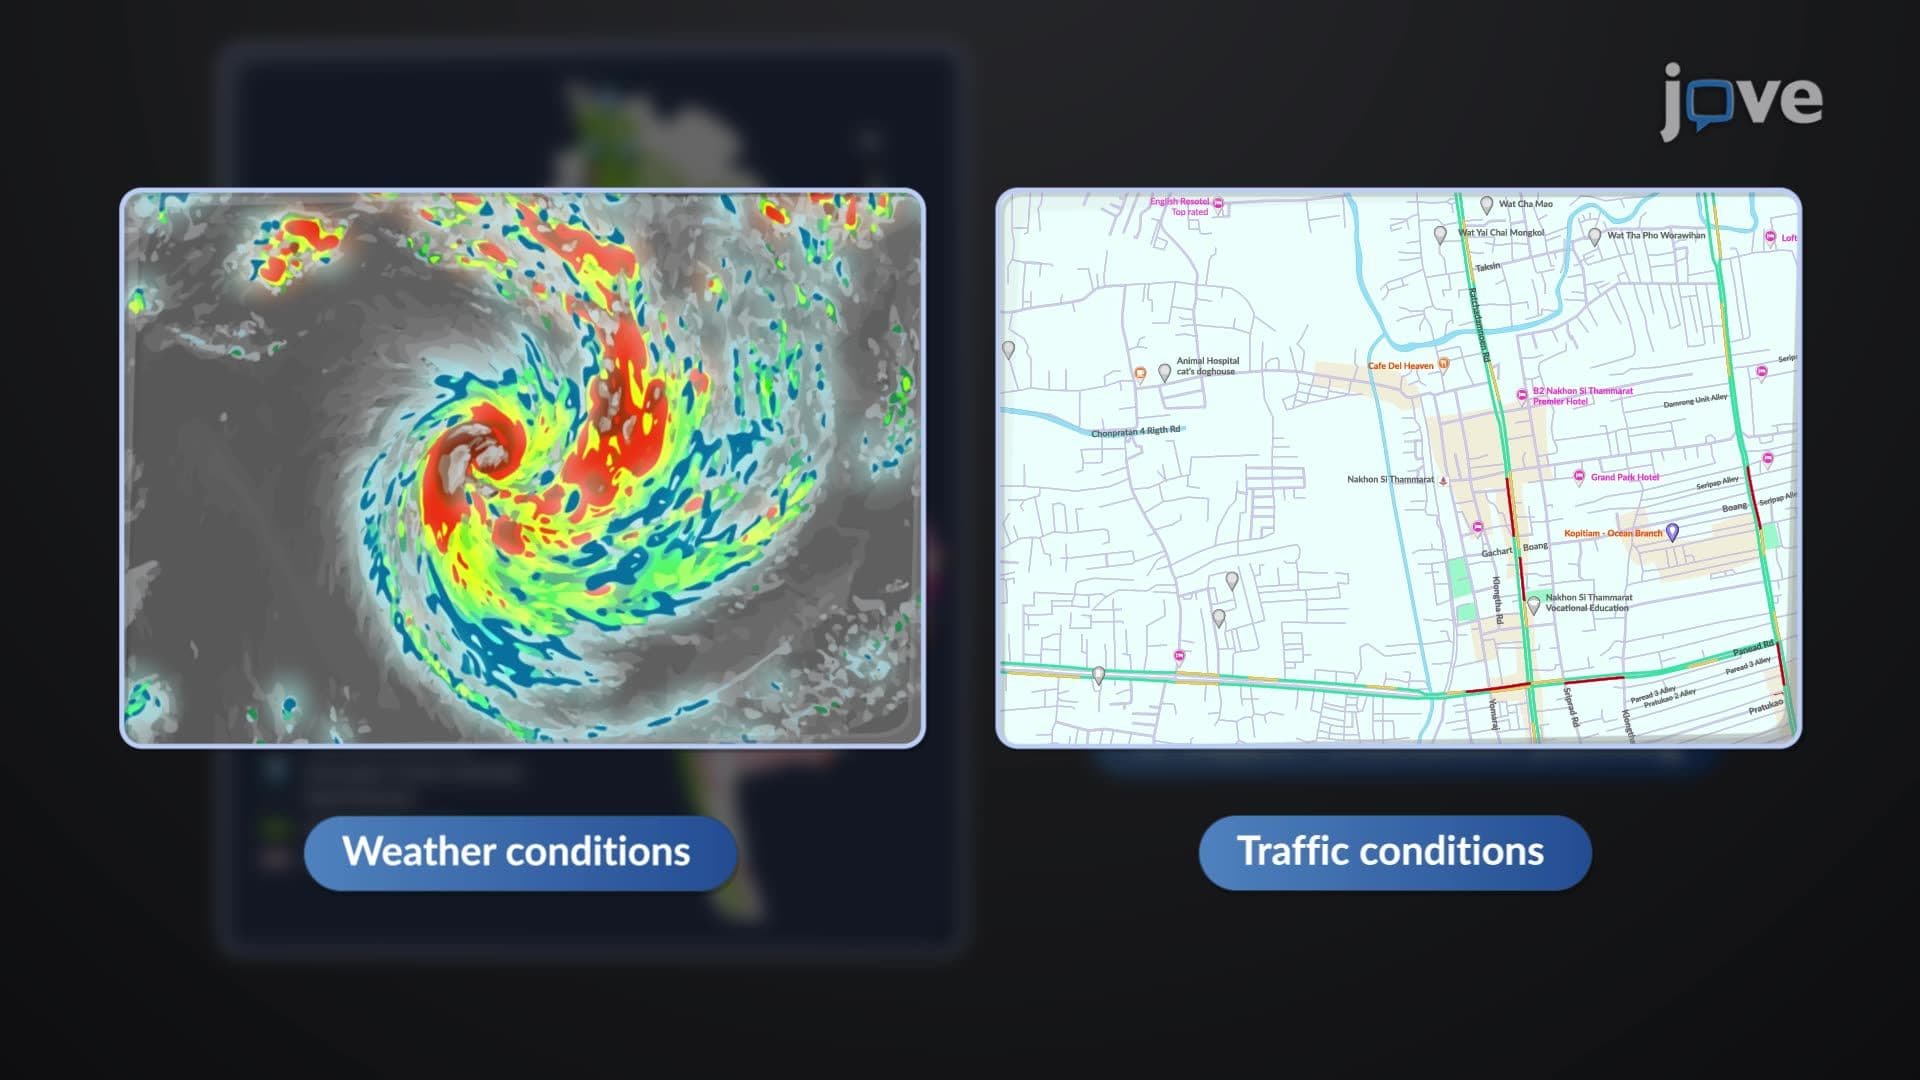

Video Summary: Applications of Gis Disaster Management Explained
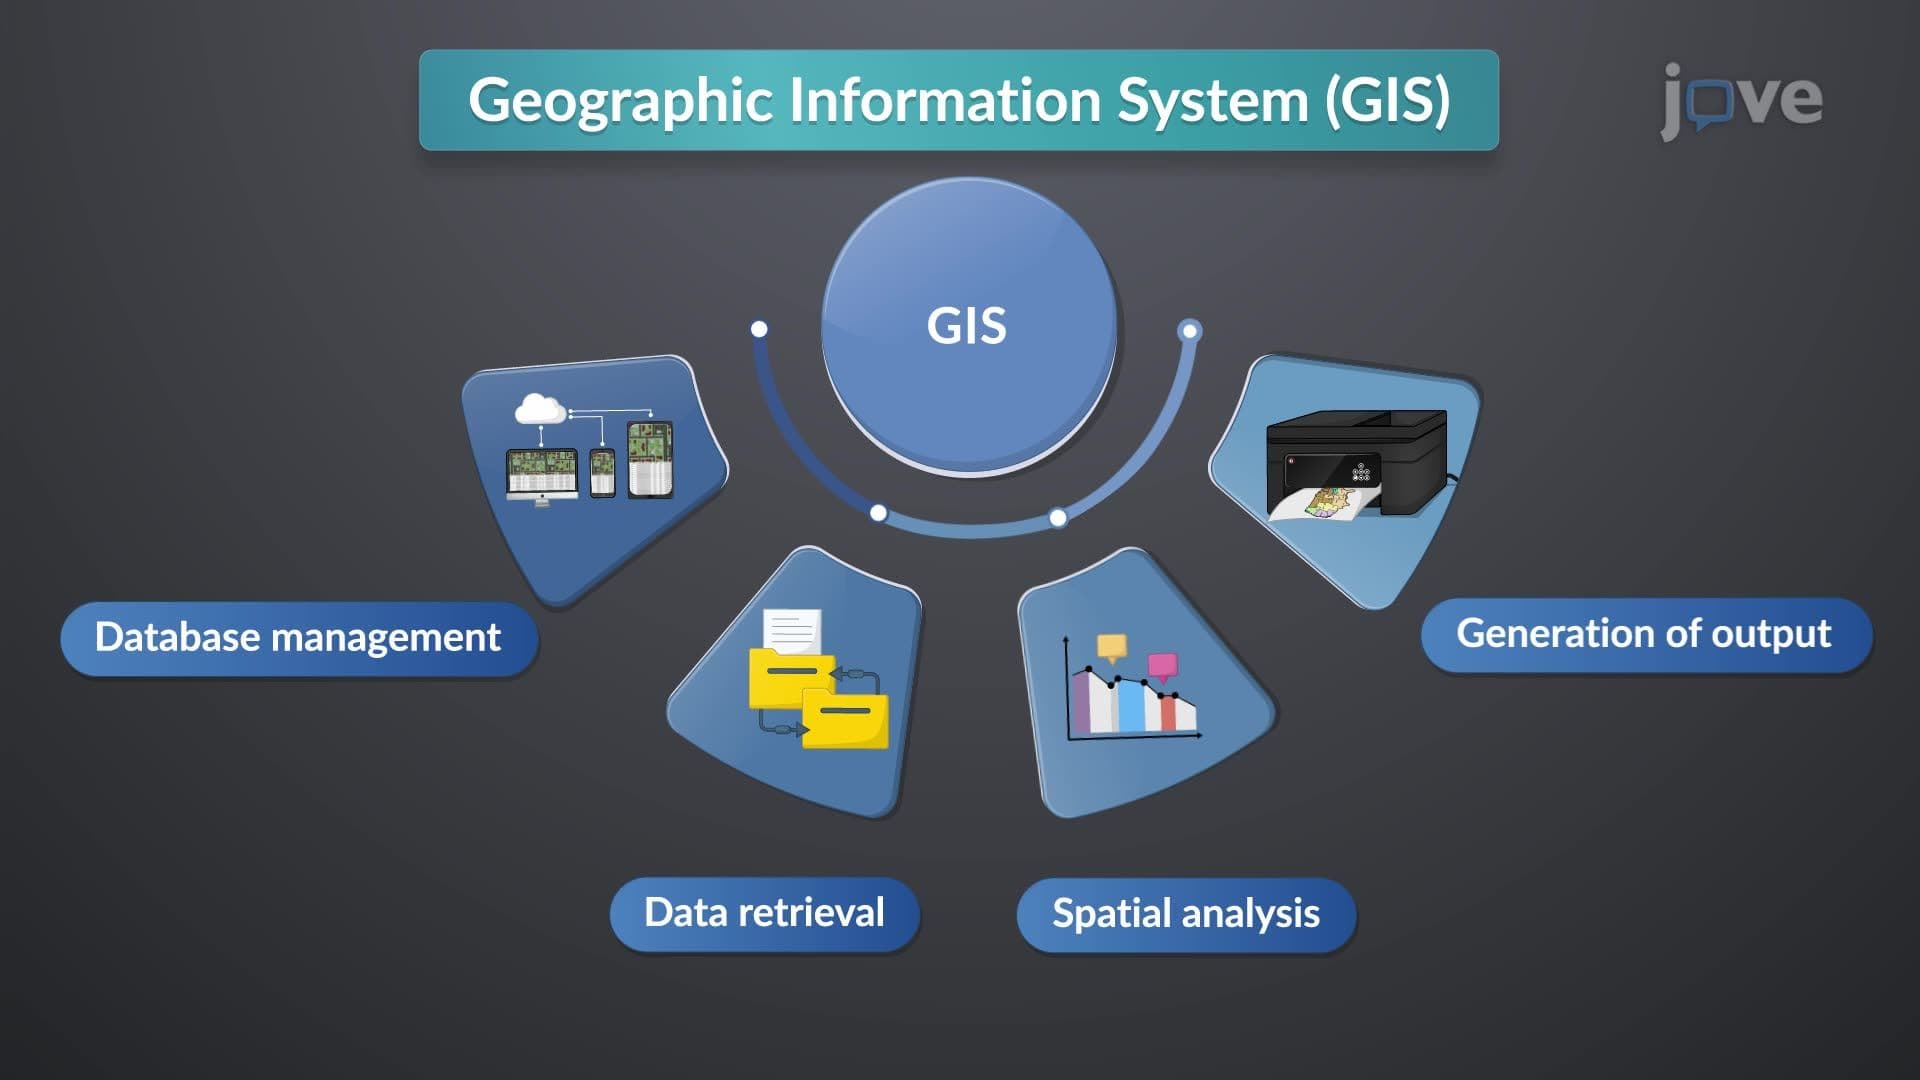
When Hurricane Katrina devastated New Orleans in 2005, emergency responders relied heavily on design example alignment road line systems to coordinate rescue operations across flooded neighborhoods. Geographic Information Systems (GIS) transform disaster management by layering critical spatial data-from flood zones to evacuation routes-enabling emergency teams to make life-saving decisions in real-time. Applications of GIS Disaster Management Explained demonstrates how FEMA and local agencies use these powerful mapping technologies during natural disasters like the recent California wildfires and Texas flooding events. Watch the full video on JoVE Coach to master this concept with expert-led visuals and step-by-step explanations.
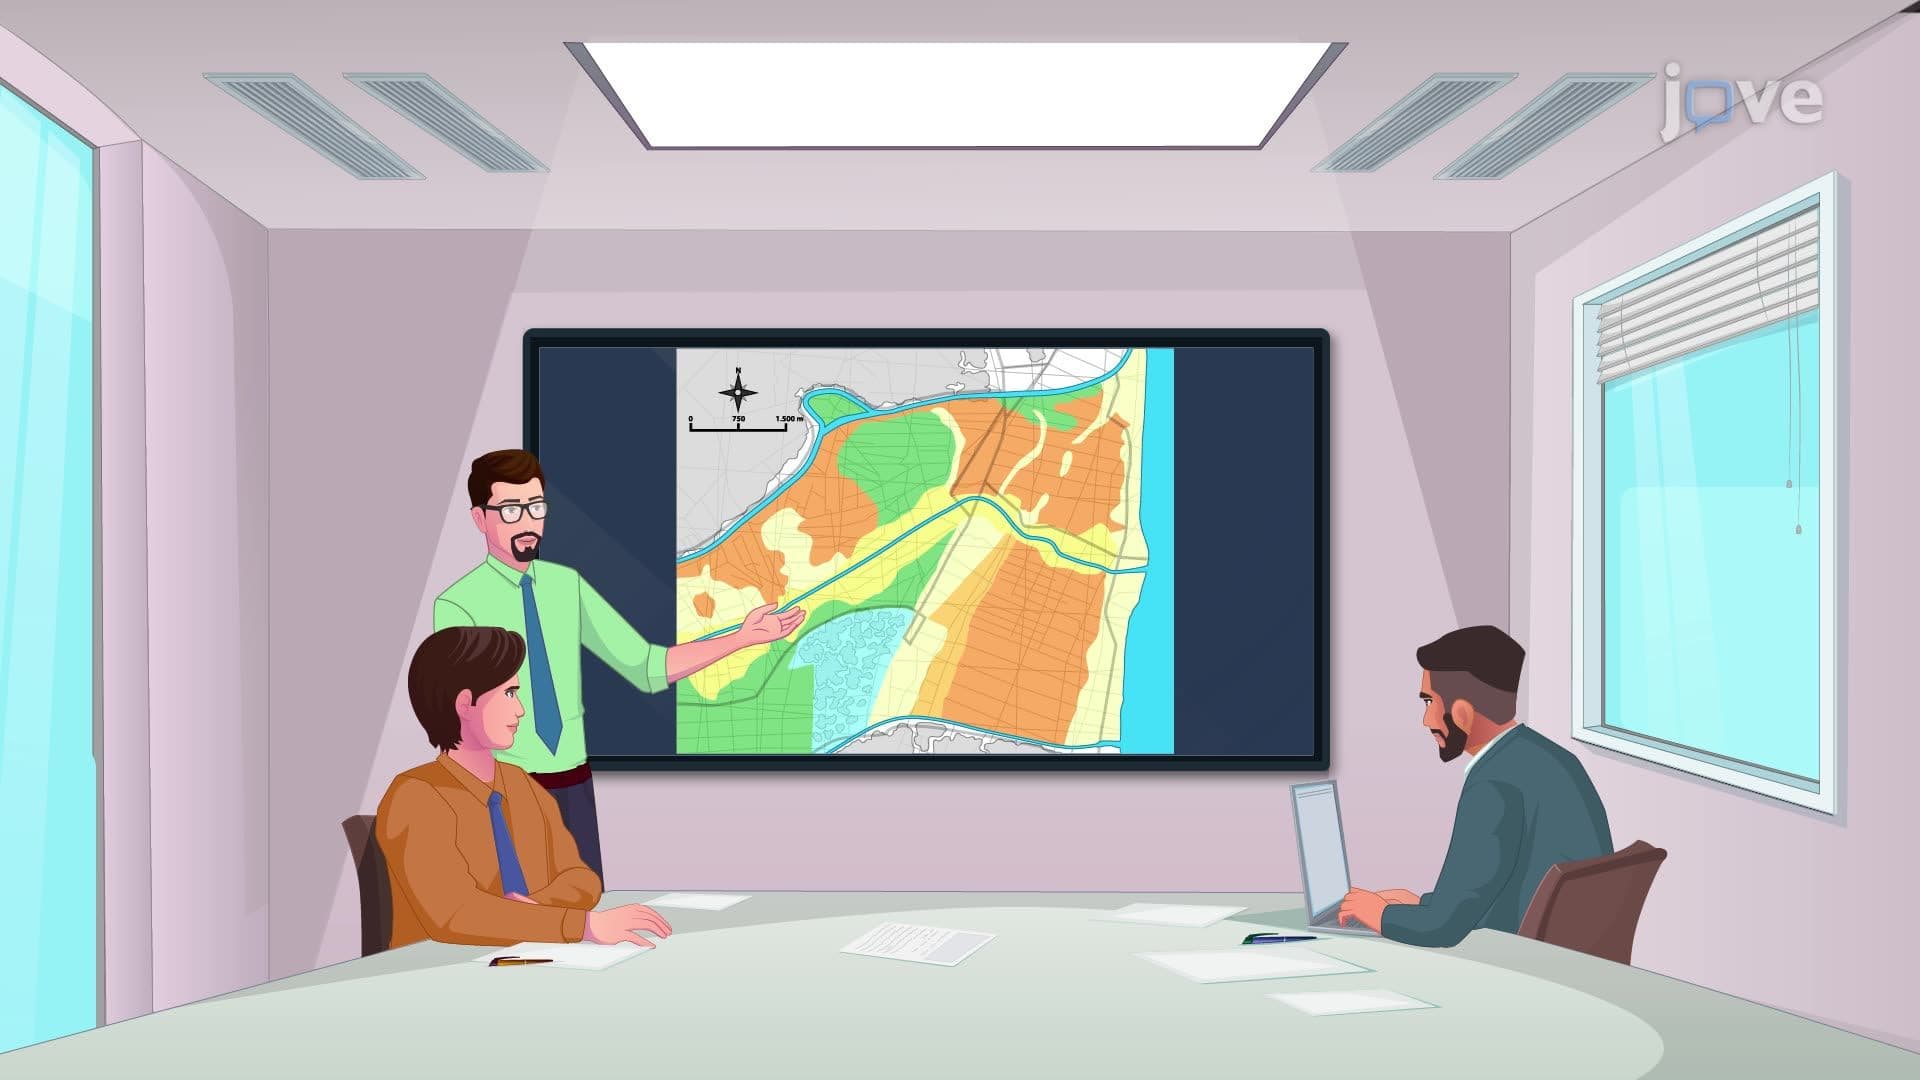
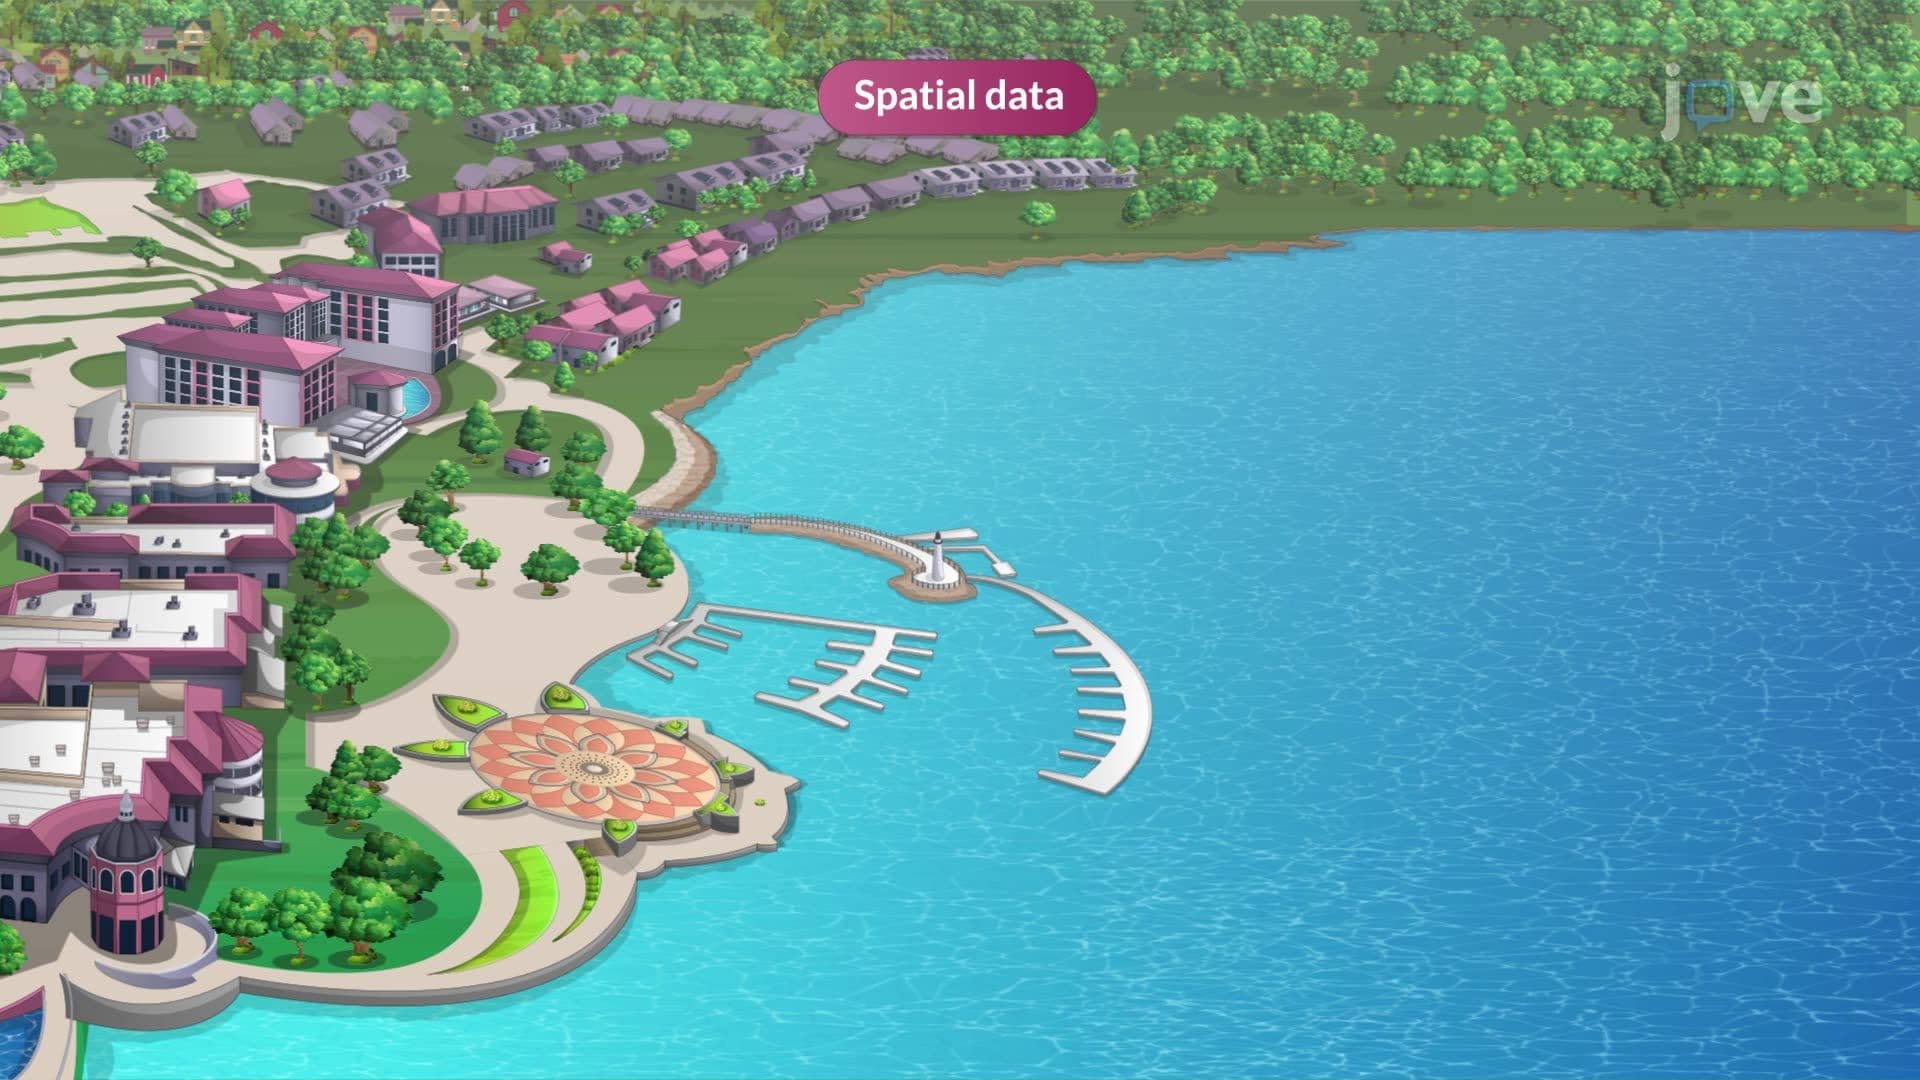
Geographic Information Systems revolutionize emergency management by transforming raw spatial data into actionable intelligence. The design example alignment road line concept demonstrates how multiple data layers work together-imagine overlaying a transparent map of flood zones onto population density data, then adding another layer showing hospital locations. This multi-layered approach enables emergency managers to visualize complex relationships that would be impossible to detect through traditional methods.
GIS excels in identifying vulnerable areas before disasters strike. The design example alignment road line tutorial process begins with analyzing historical weather patterns, elevation models, and proximity to water sources. For instance, FEMA's flood maps combine 100-year flood data with current development patterns to identify high-risk zones across coastal Florida. Students preparing for AP Environmental Science exams should understand how Digital Elevation Models (DEMs) predict water flow patterns during storm surge events.
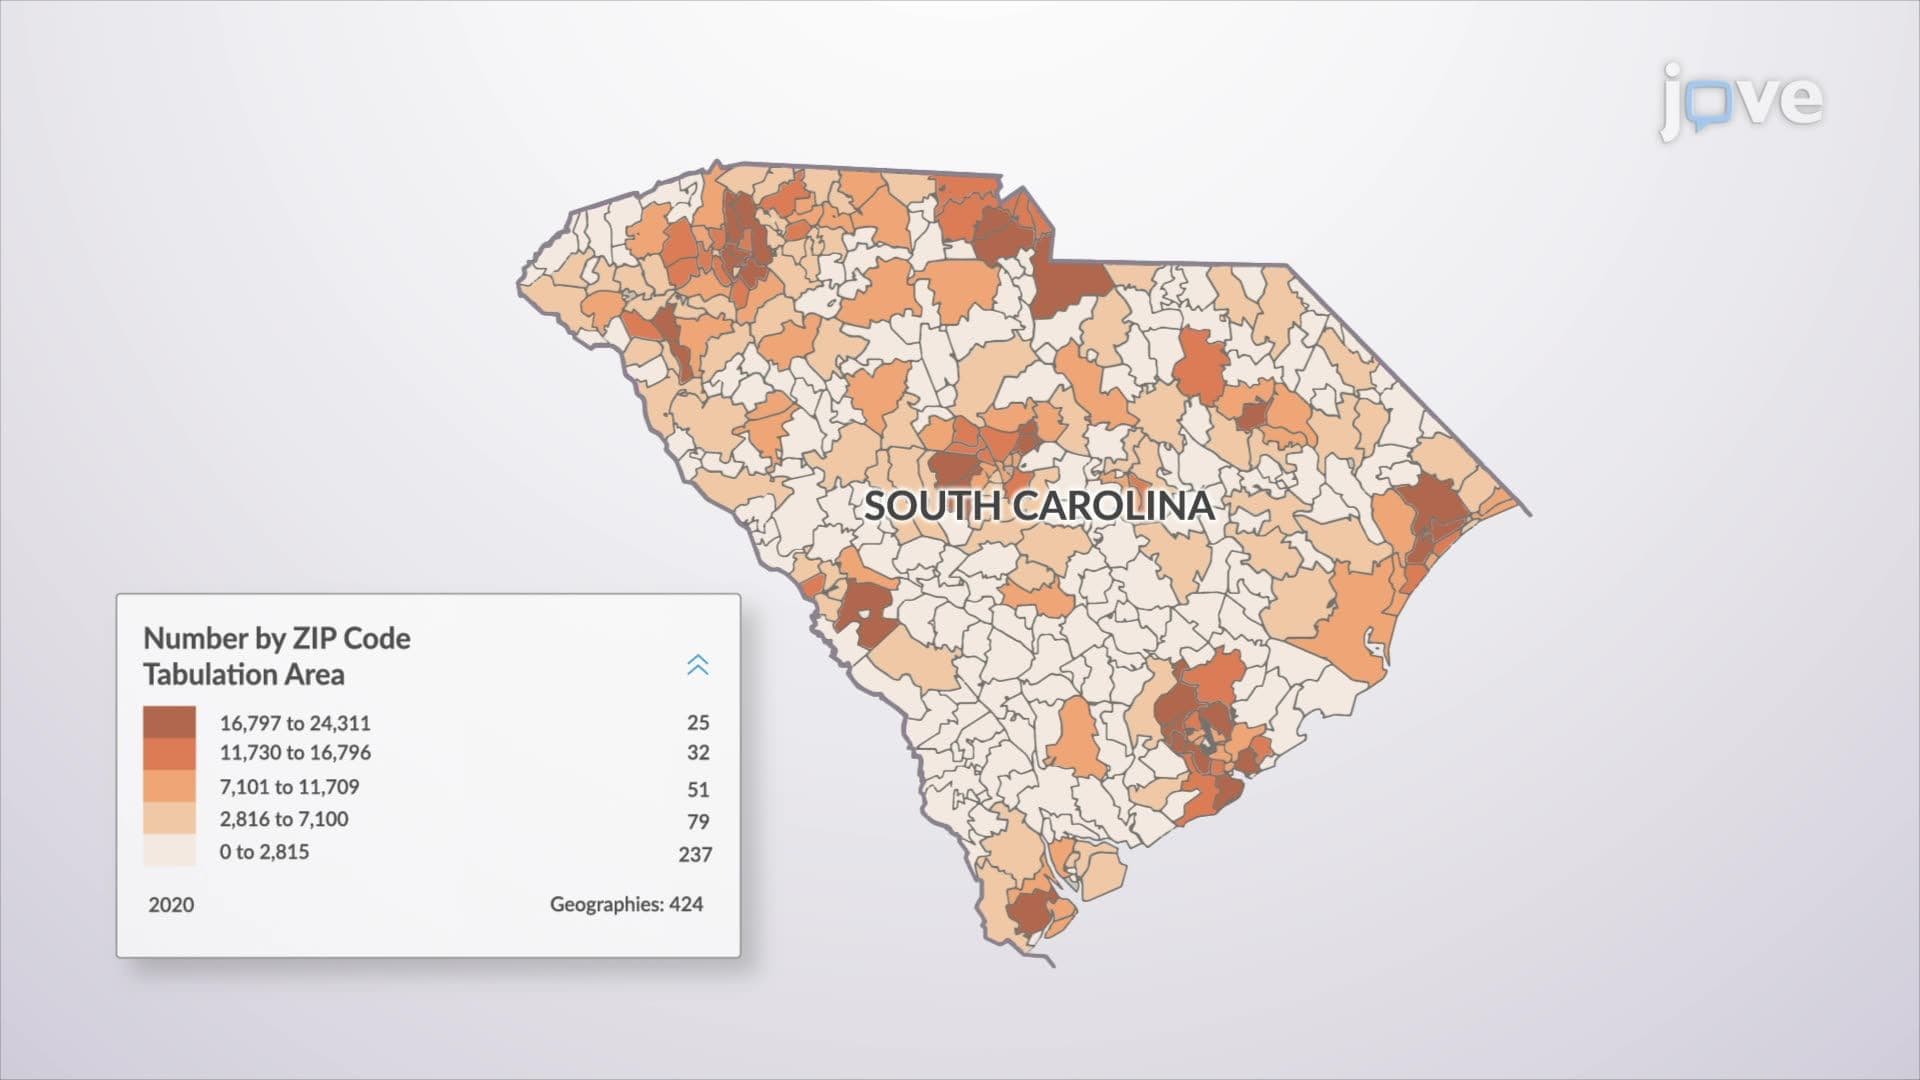
The system integrates census data to identify vulnerable populations-elderly residents, individuals with disabilities, and low-income communities who may need additional evacuation assistance. This demographic overlay helps emergency planners allocate resources equitably and develop targeted communication strategies.
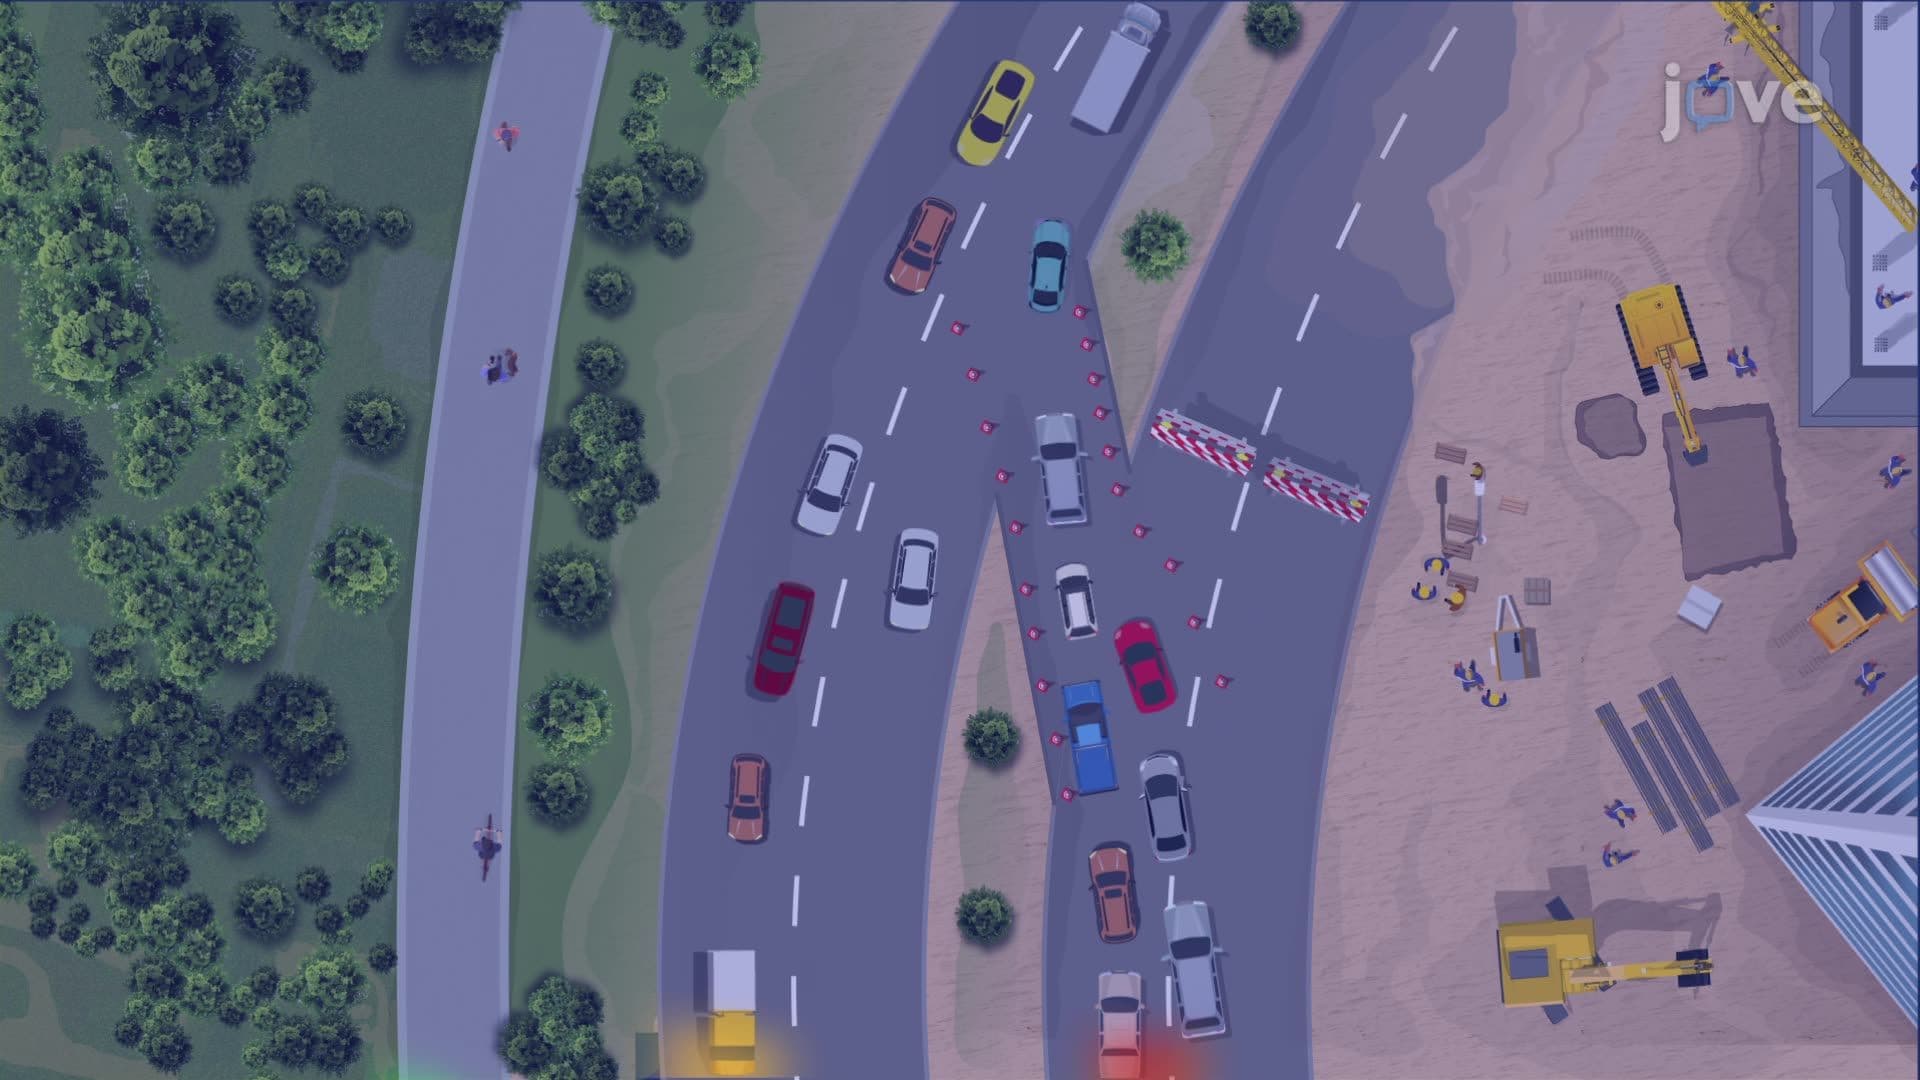
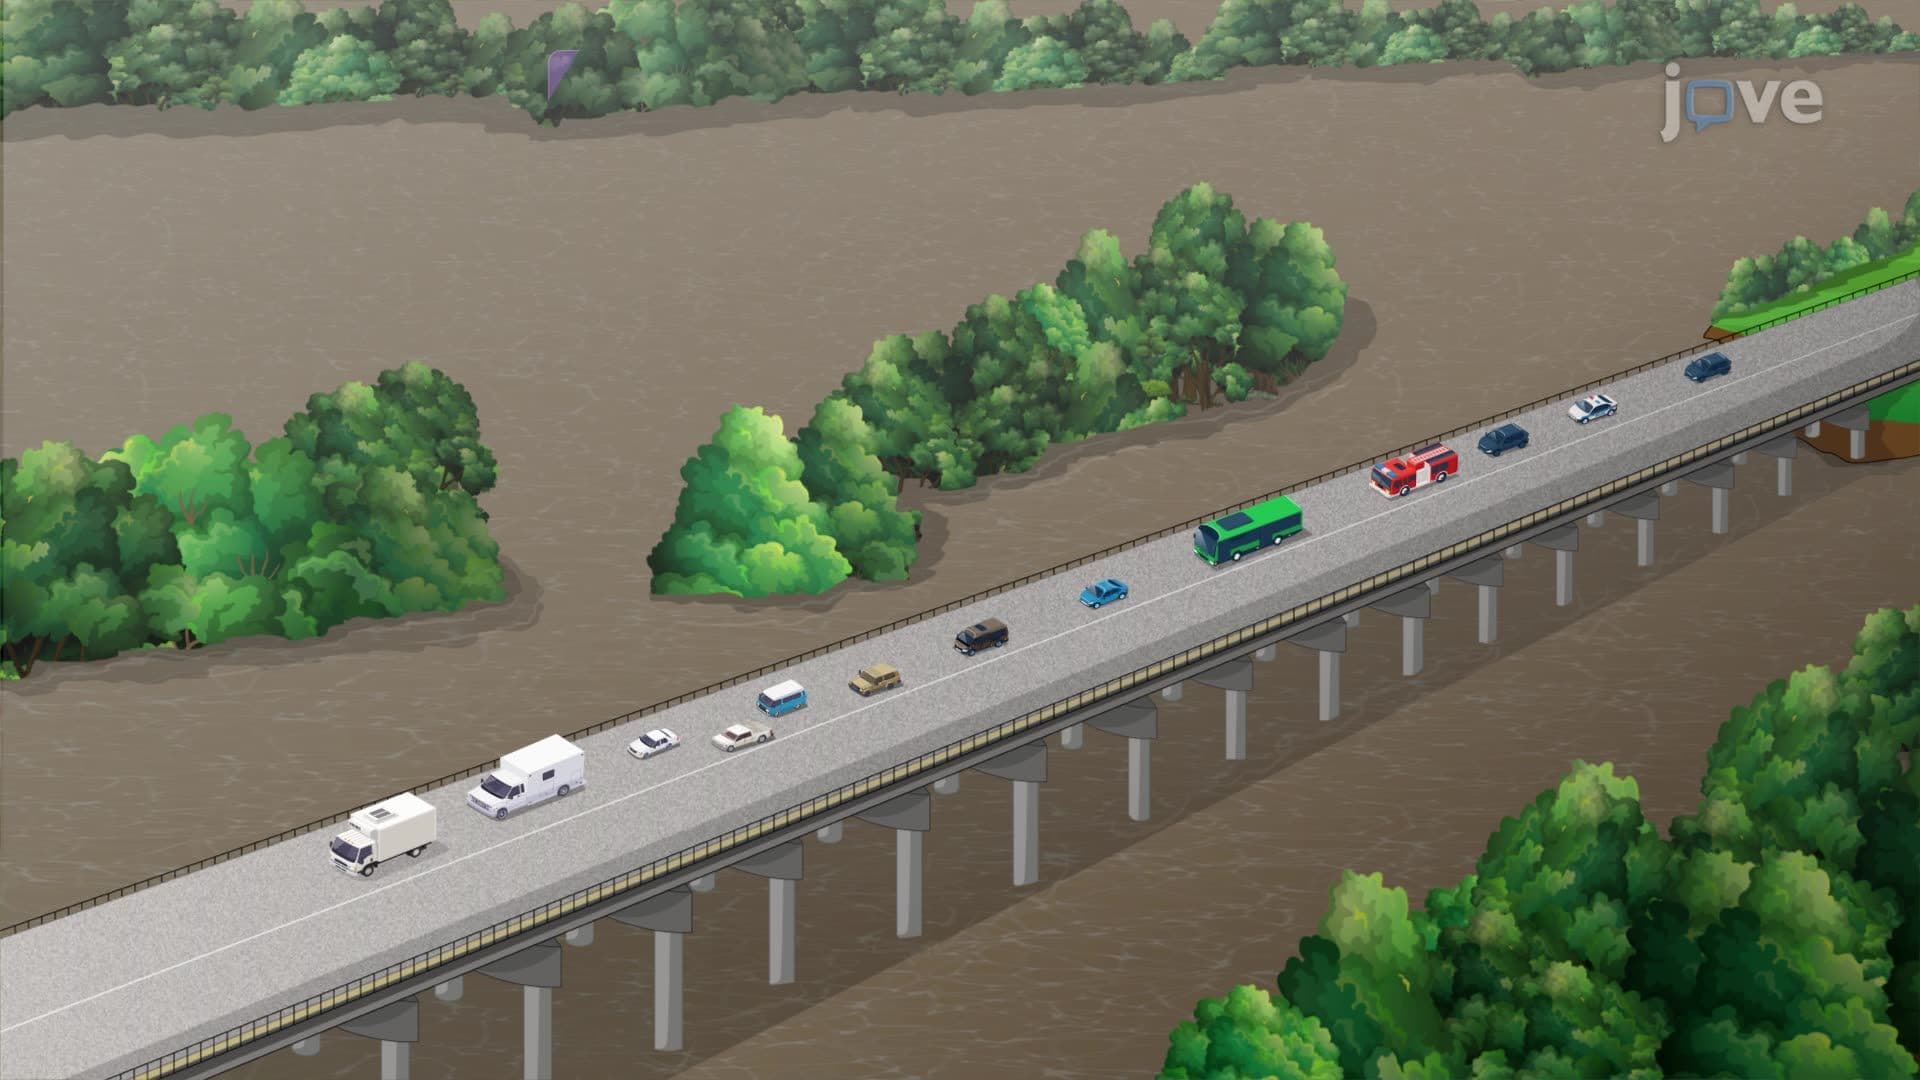
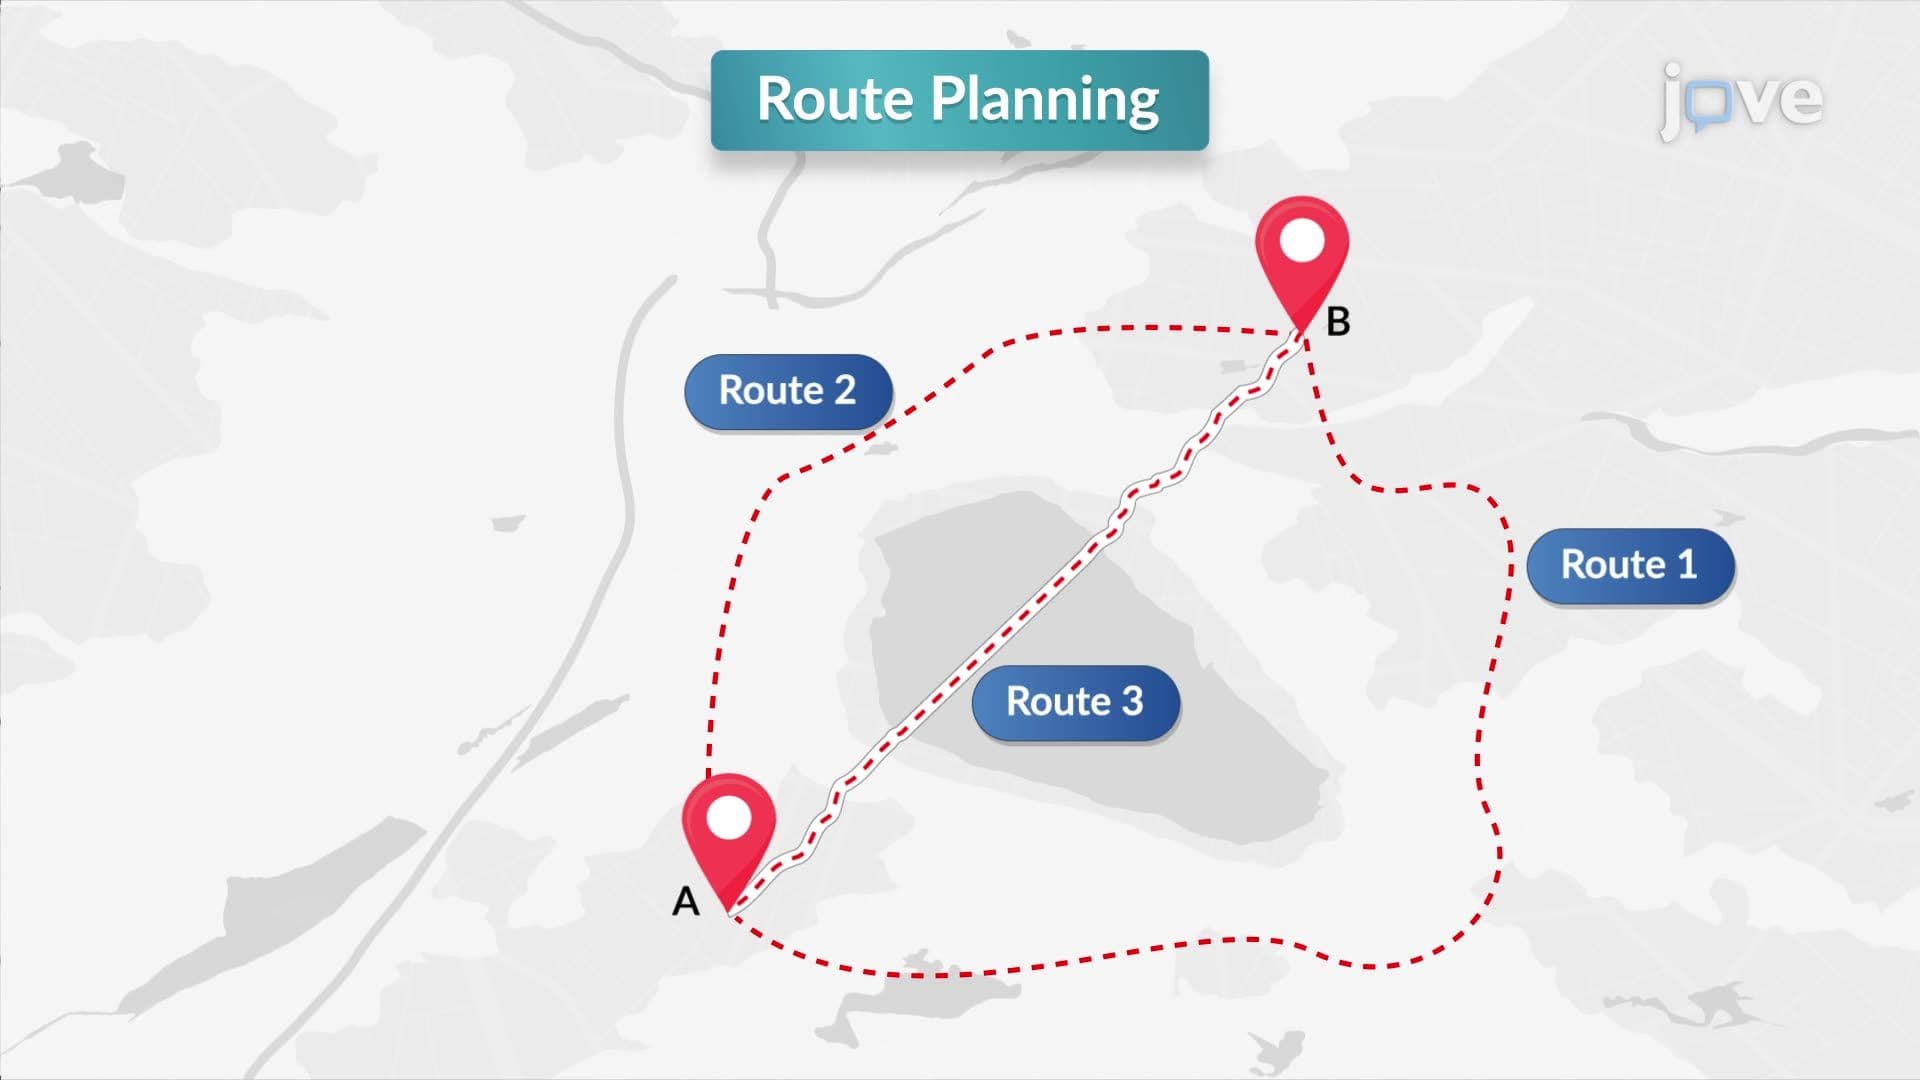
During active disasters, understanding how design example alignment road line works becomes critical for coordinating response efforts. Emergency Operations Centers use live data feeds from weather stations, traffic sensors, and social media reports to update evacuation routes dynamically. When Hurricane Harvey flooded Houston in 2017, GIS systems helped redirect rescue boats to areas with the highest concentration of stranded residents.
The design example alignment road line overview includes creating thematic maps that display current conditions-road closures appear in red, active rescue operations in blue, and available shelters in green. These visual tools enable incident commanders to make rapid decisions about resource deployment and public safety messaging.
After disasters subside, GIS supports long-term recovery planning through damage assessment mapping. The design example alignment road line study guide emphasizes how satellite imagery before and after events reveals infrastructure damage patterns. Insurance companies and government agencies use this spatial analysis to prioritize rebuilding efforts and improve future resilience.
College students studying urban planning or emergency management should recognize how GIS influences policy decisions-from updating building codes in flood-prone areas to relocating critical facilities outside high-risk zones.
Related Micro-courses