Loading video…


 9 Concepts
 1.9K views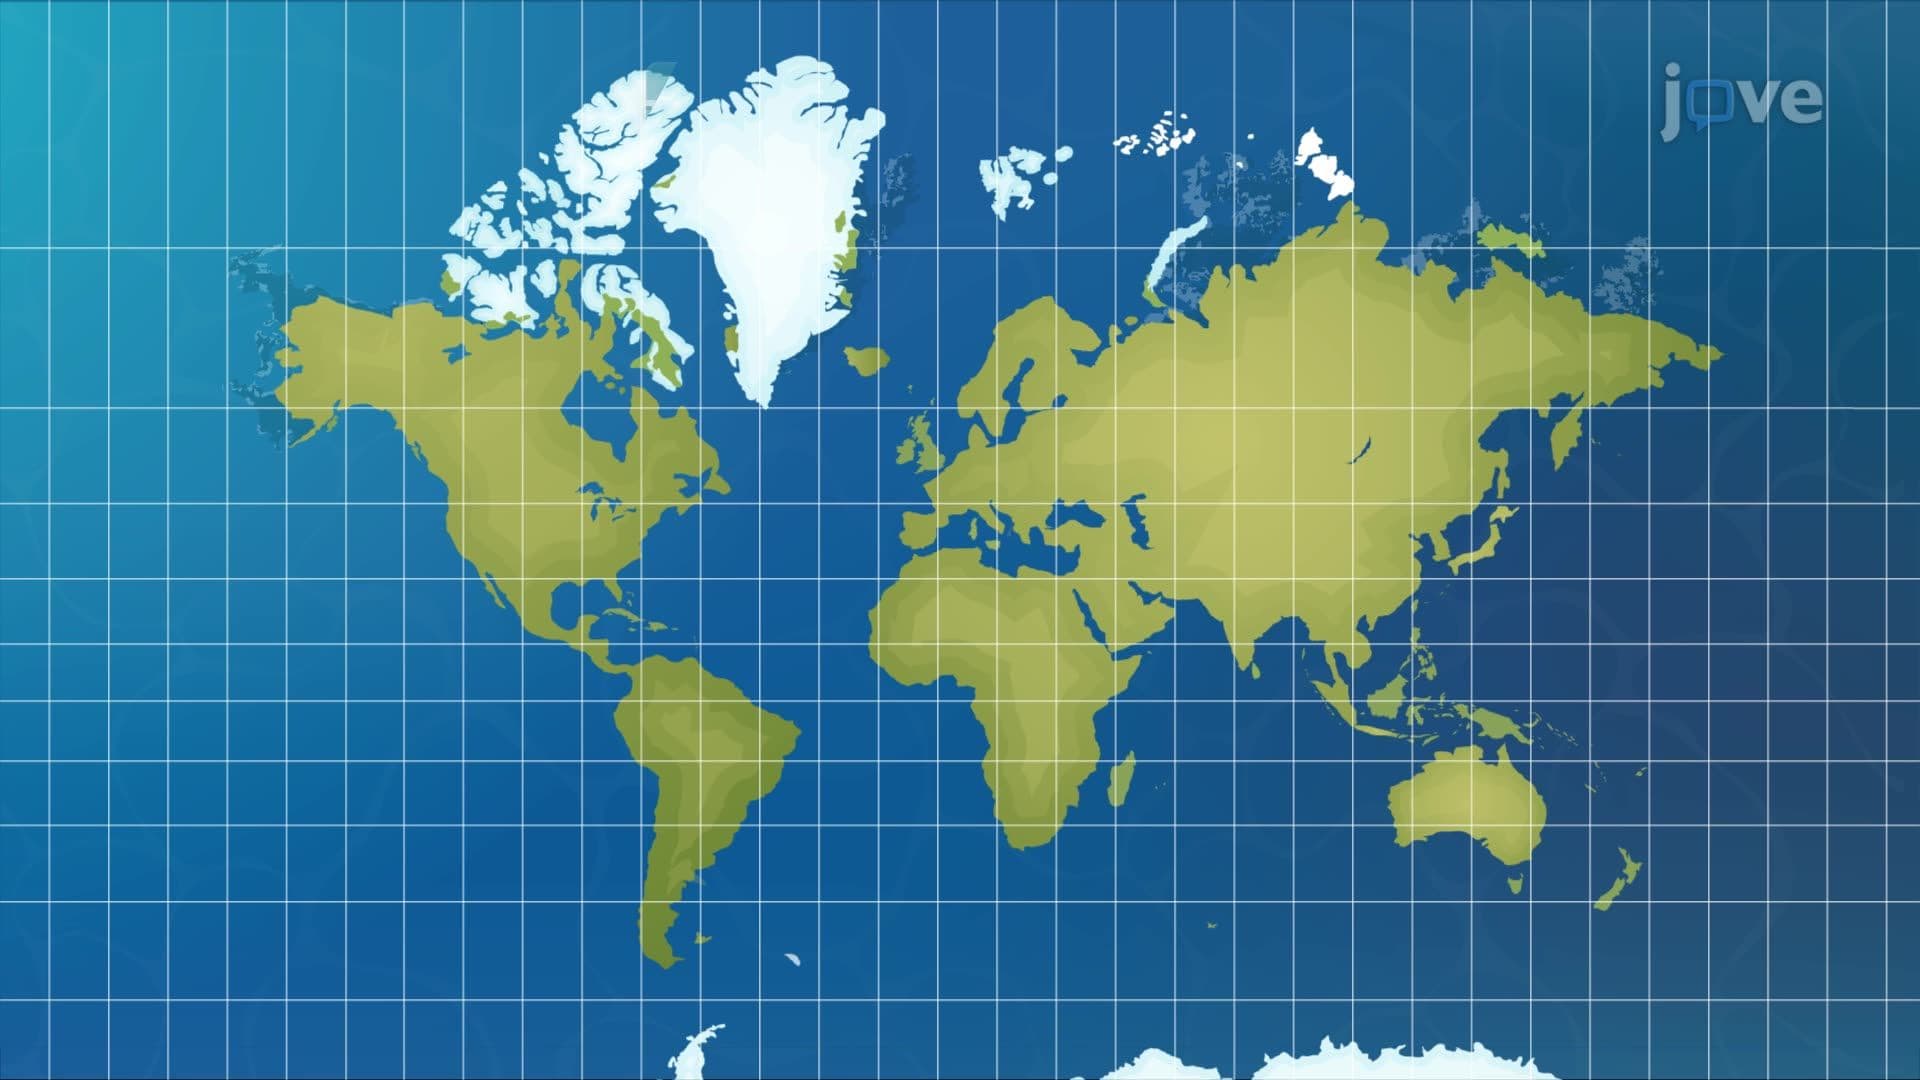

Video Summary: What Is Coordinates and Map Projections
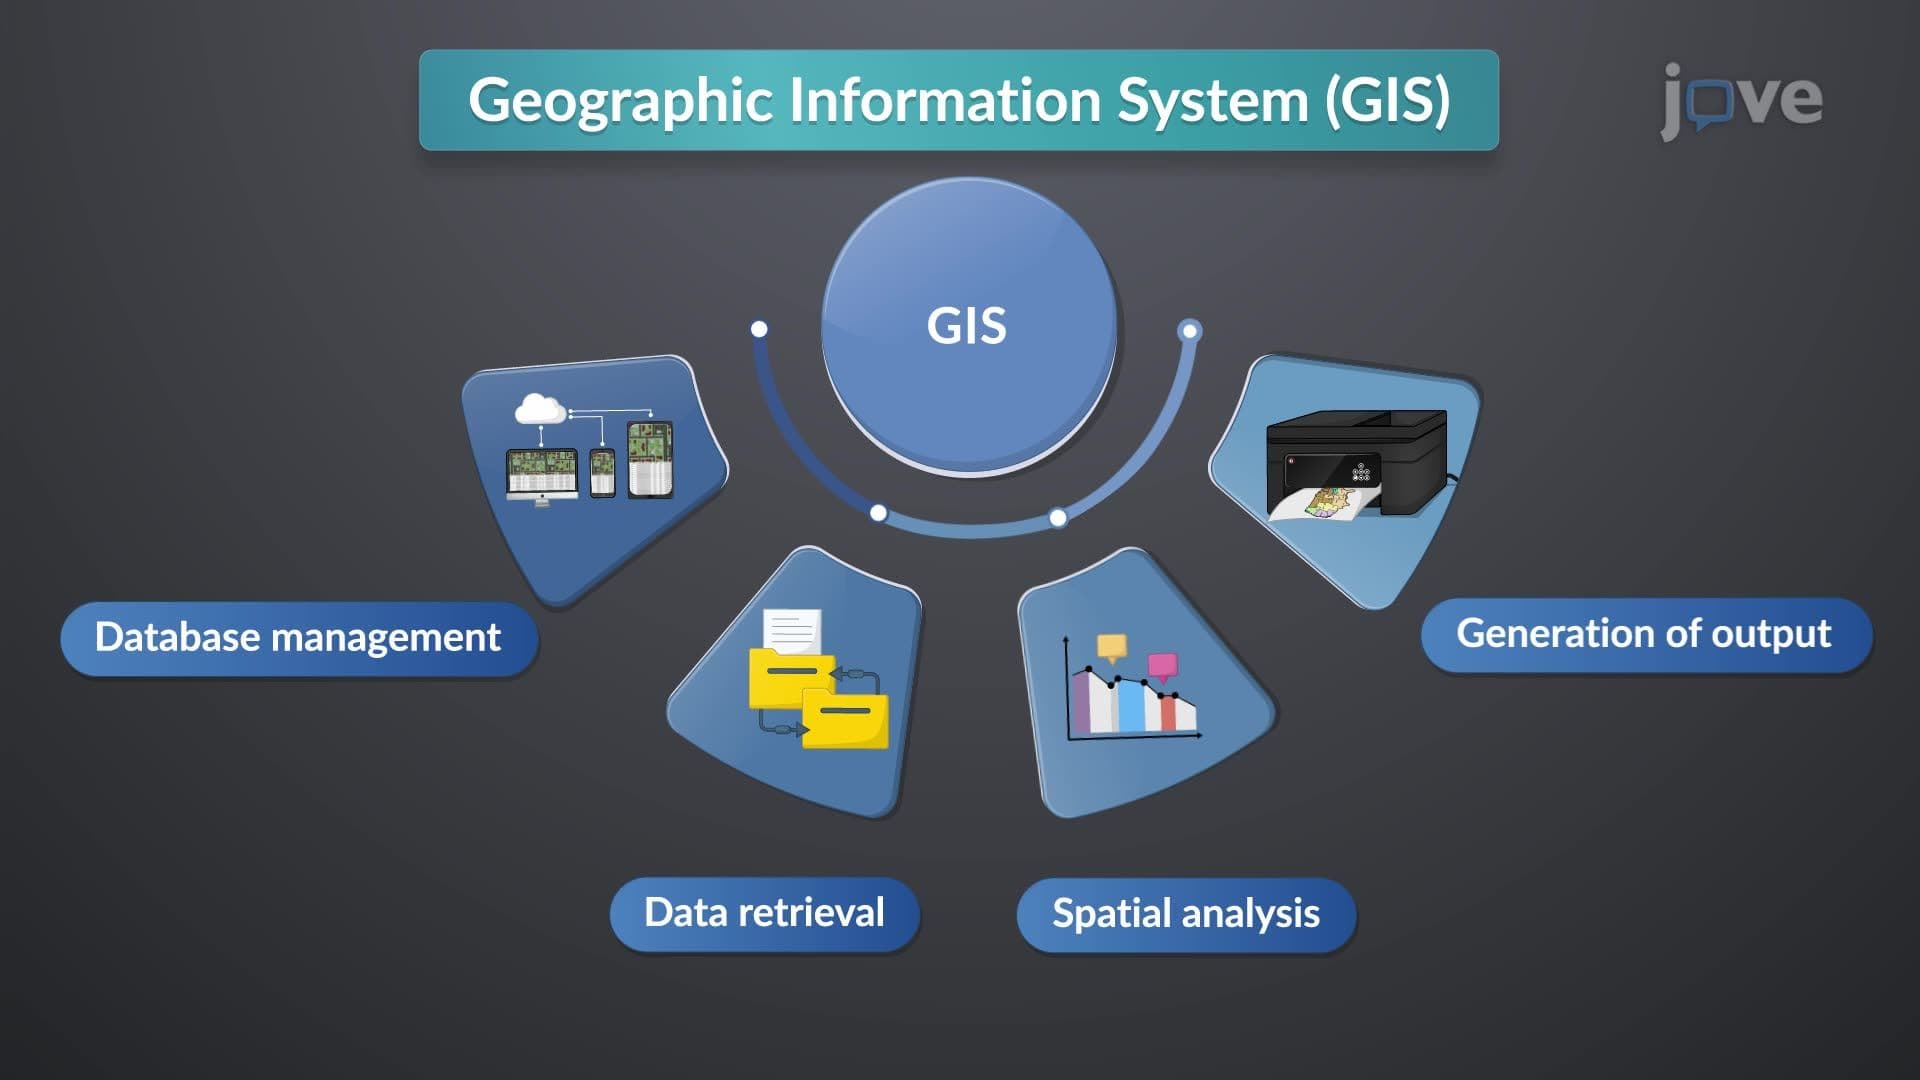
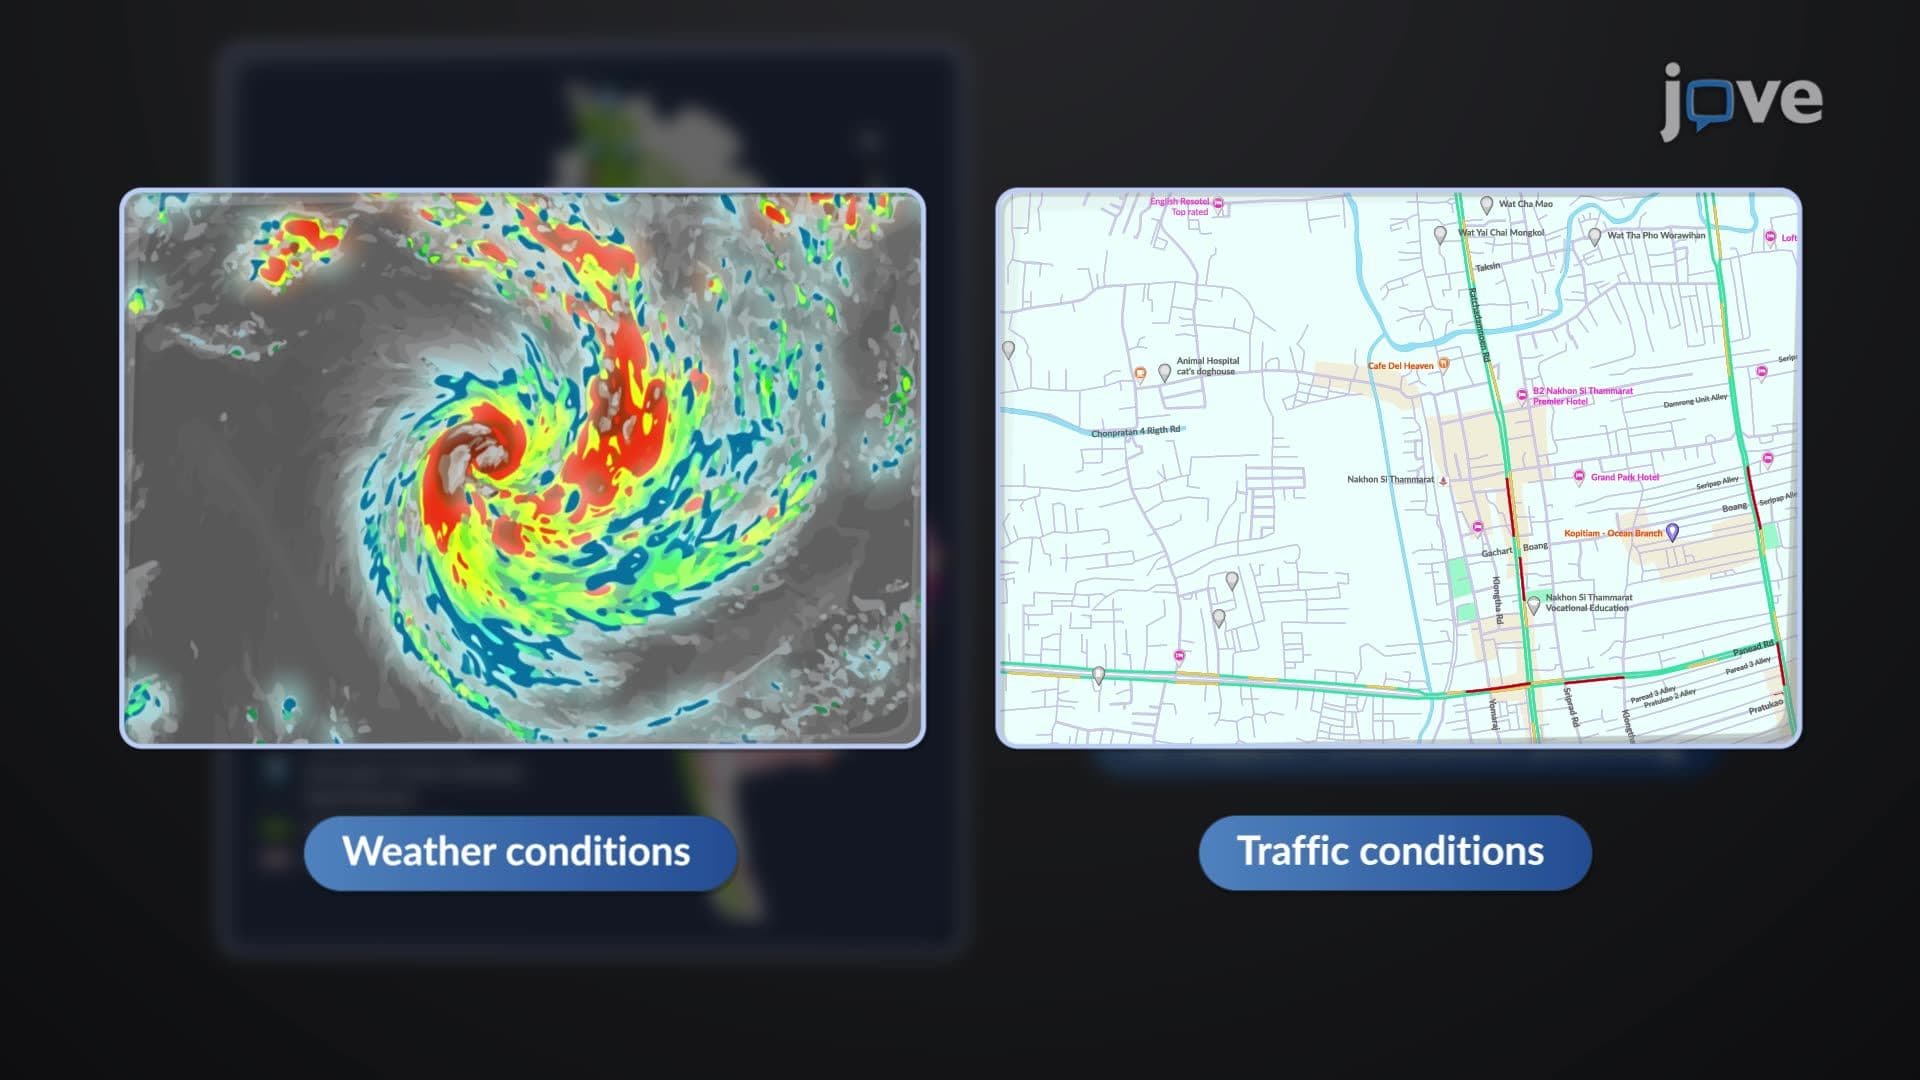
When Hurricane Katrina devastated New Orleans in 2005, emergency responders relied heavily on applications of GIS disaster management to coordinate rescue efforts and track flooding patterns across the city. Understanding What is Coordinates And Map Projections becomes crucial for GIS applications, as accurate positioning systems enable real-time disaster response, resource allocation, and evacuation planning. Emergency management teams use coordinate systems and map projections to overlay damage assessments, population density data, and infrastructure maps. Watch the full video on JoVE Coach to master this concept with expert-led visuals and step-by-step explanations.
Coordinate systems and map projections form the mathematical foundation that makes modern geographic analysis possible, particularly in critical applications like disaster management. While the Earth's spherical nature presents unique challenges for representing locations on flat surfaces, sophisticated coordinate systems have evolved to meet diverse mapping needs across various scales and purposes.
The latitude and longitude system represents Earth's most universally recognized coordinate framework, with latitude measuring angular distance from the equator (0° to 90° north or south) and longitude measuring angular distance from the Prime Meridian (0° to 180° east or west). This system enables emergency responders during disasters like the 2017 Hurricane Harvey to pinpoint exact locations for rescue operations across Houston's sprawling metropolitan area.
For more precise local applications, the Universal Transverse Mercator (UTM) system divides Earth into 60 zones, each 6° of longitude wide. US Geological Survey (USGS) topographic maps extensively use UTM coordinates, making them essential for students preparing for Advanced Placement Environmental Science exams or college-level geography courses. The State Plane Coordinate System, used throughout US surveying and engineering projects, provides even greater local accuracy for construction and urban planning applications.
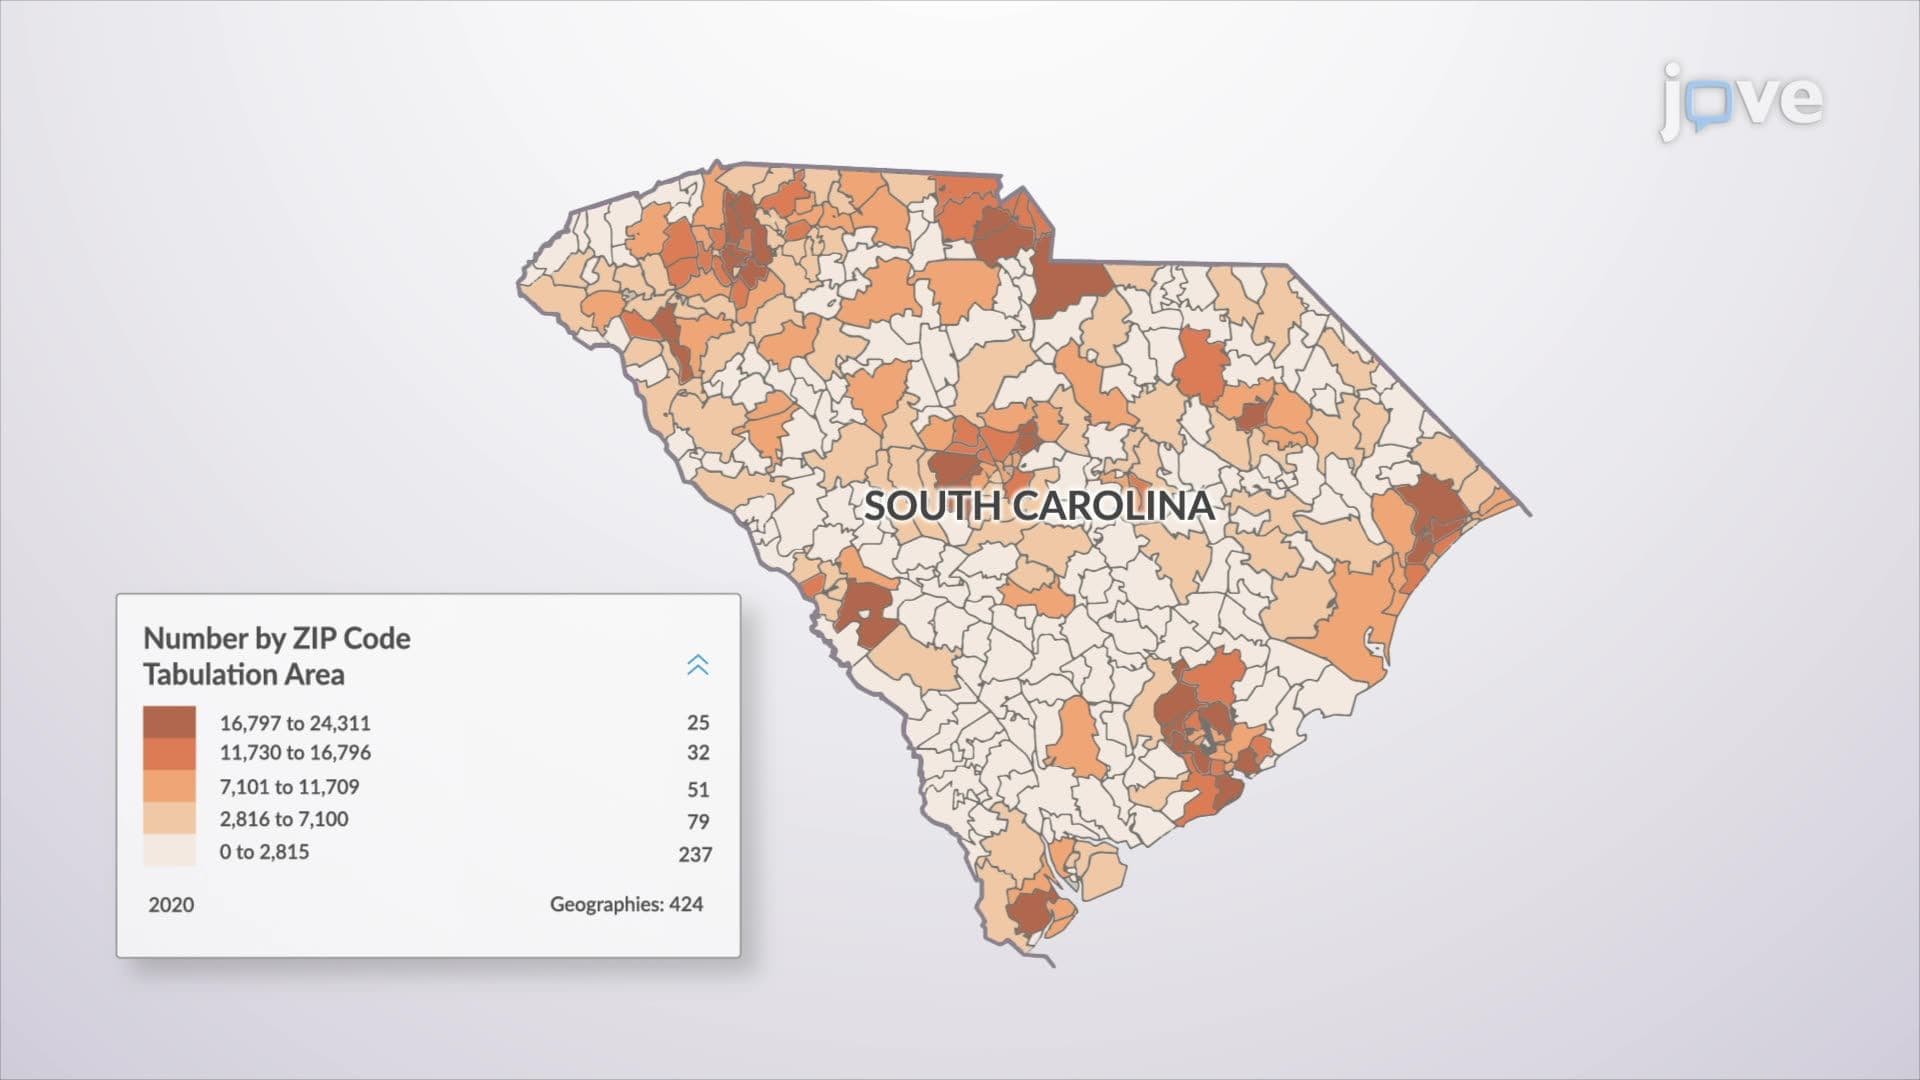
Different map projections serve distinct purposes in professional applications. The Mercator projection, despite its polar distortion, remains invaluable for marine navigation because it preserves angular relationships, allowing navigators to plot straight-line courses. The Albers Equal-Area Conic projection, used by the US Census Bureau for demographic mapping, maintains accurate area relationships crucial for population density studies and resource allocation during emergencies.
Students encountering these concepts in SAT Subject Tests or college entrance exams should understand that projection choice directly impacts data interpretation. For instance, when analyzing tornado frequency patterns across the Great Plains, meteorologists prefer conic projections that minimize distortion across mid-latitude regions, ensuring accurate spatial analysis for weather prediction models used by the National Weather Service.
Related Micro-courses