Loading video…


 9 Concepts
 1.9K views

Video Summary: Selected Data About Geographic Locations Guide
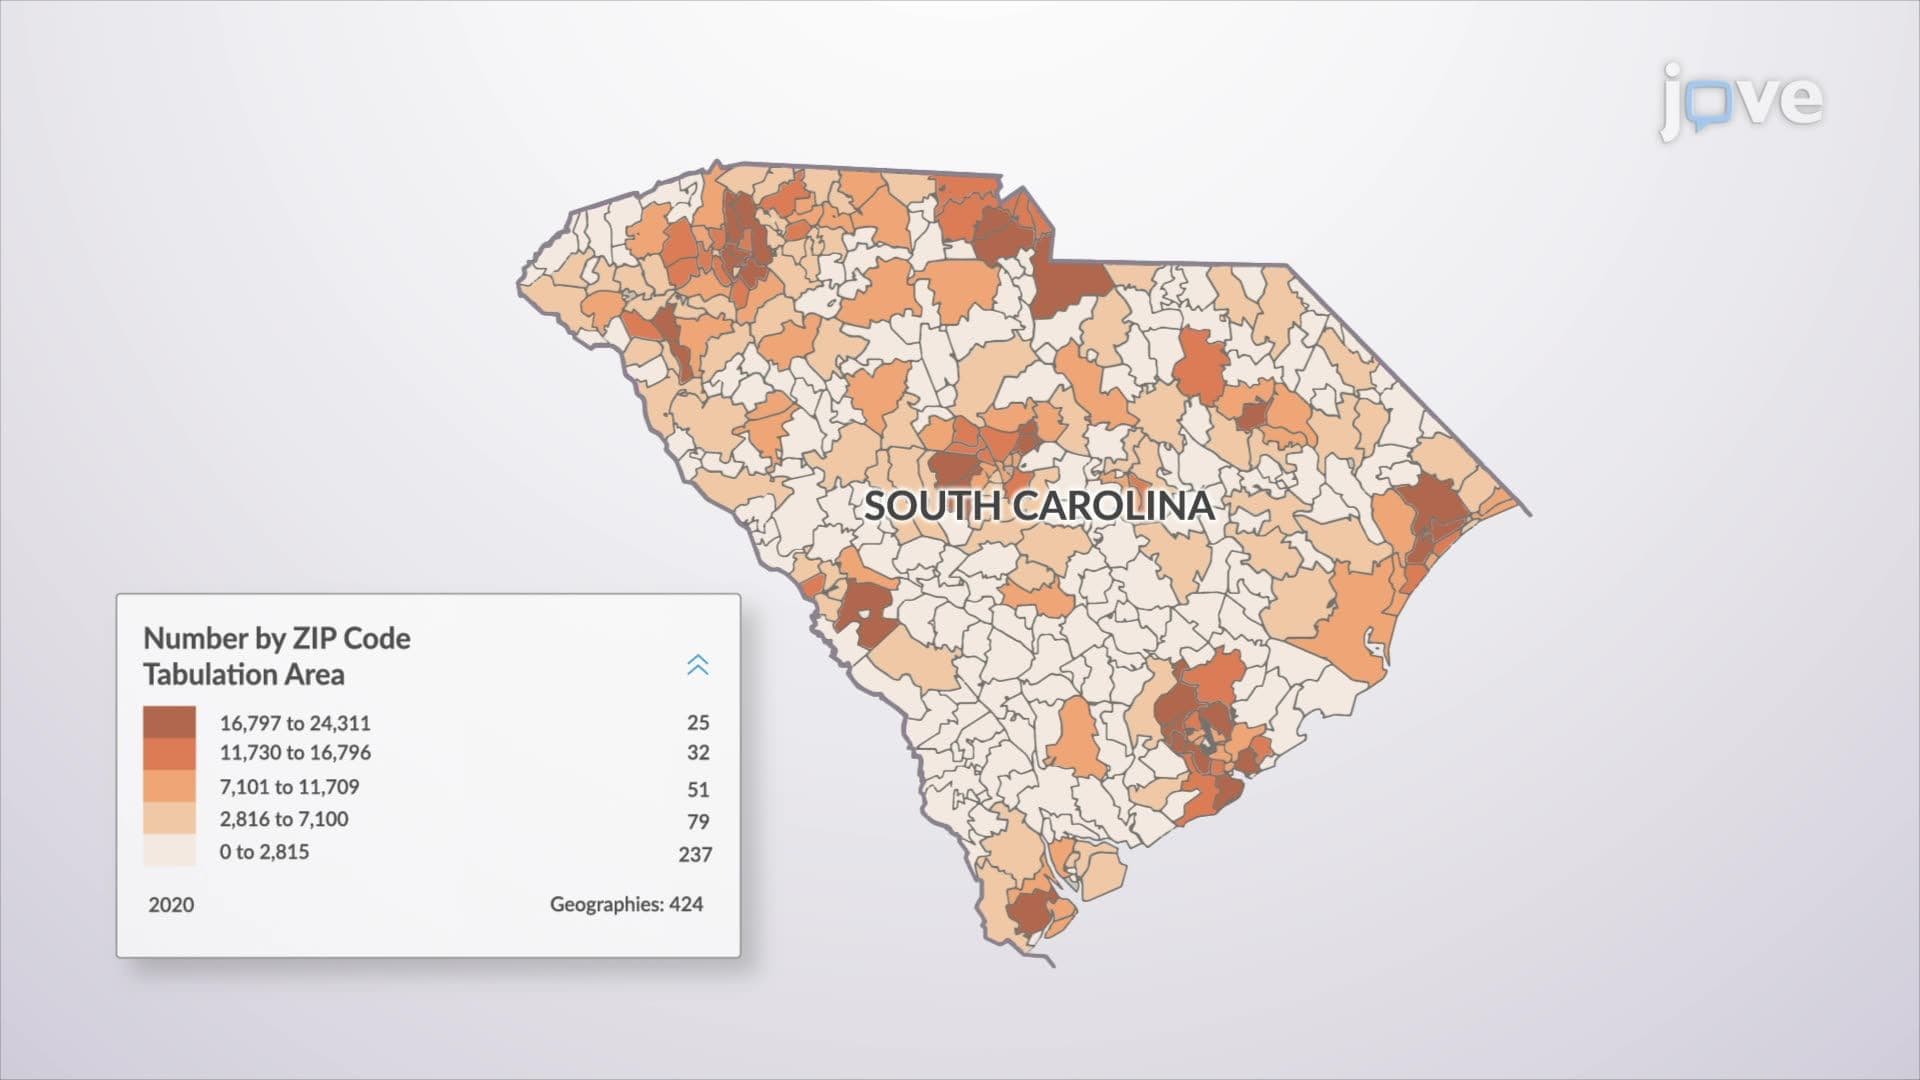
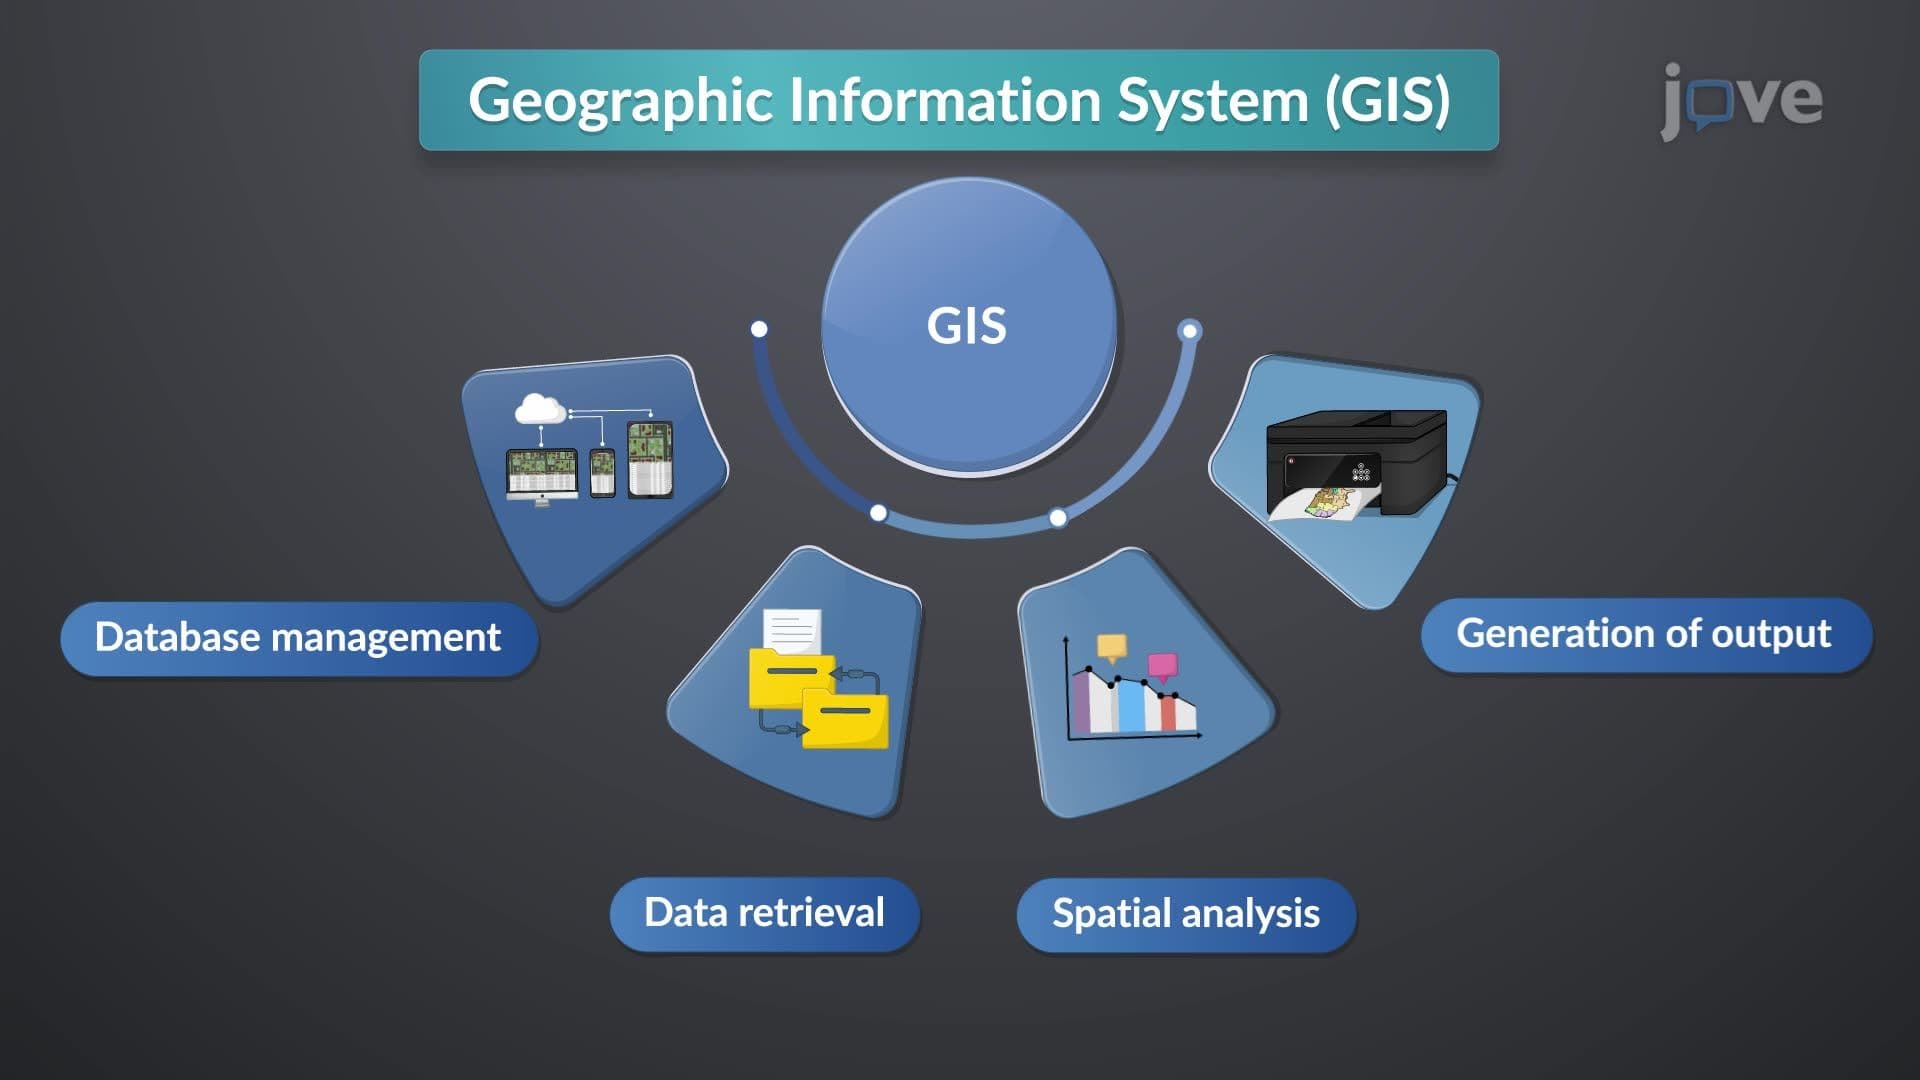
Ever wondered how emergency services instantly locate your exact position during a 911 call? GIS software hardware and sources make this life-saving technology possible by combining spatial coordinates with descriptive information about locations. The US Census Bureau uses this Selected Data About Geographic Locations Guide approach to map everything from population density to voting districts across all 50 states. Watch the full video on JoVE Coach to master this concept with expert-led visuals and step-by-step explanations.
Geographic Information Systems represent a revolutionary approach to understanding our world through data. The Selected Data About Geographic Locations Guide concept centers on two fundamental data types that work in harmony. Spatial data provides the "where", precise coordinate information that pinpoints locations on Earth's surface using systems like the Universal Transverse Mercator (UTM) or standard latitude/longitude coordinates. Attribute data supplies the "what", descriptive characteristics that give meaning to those locations.
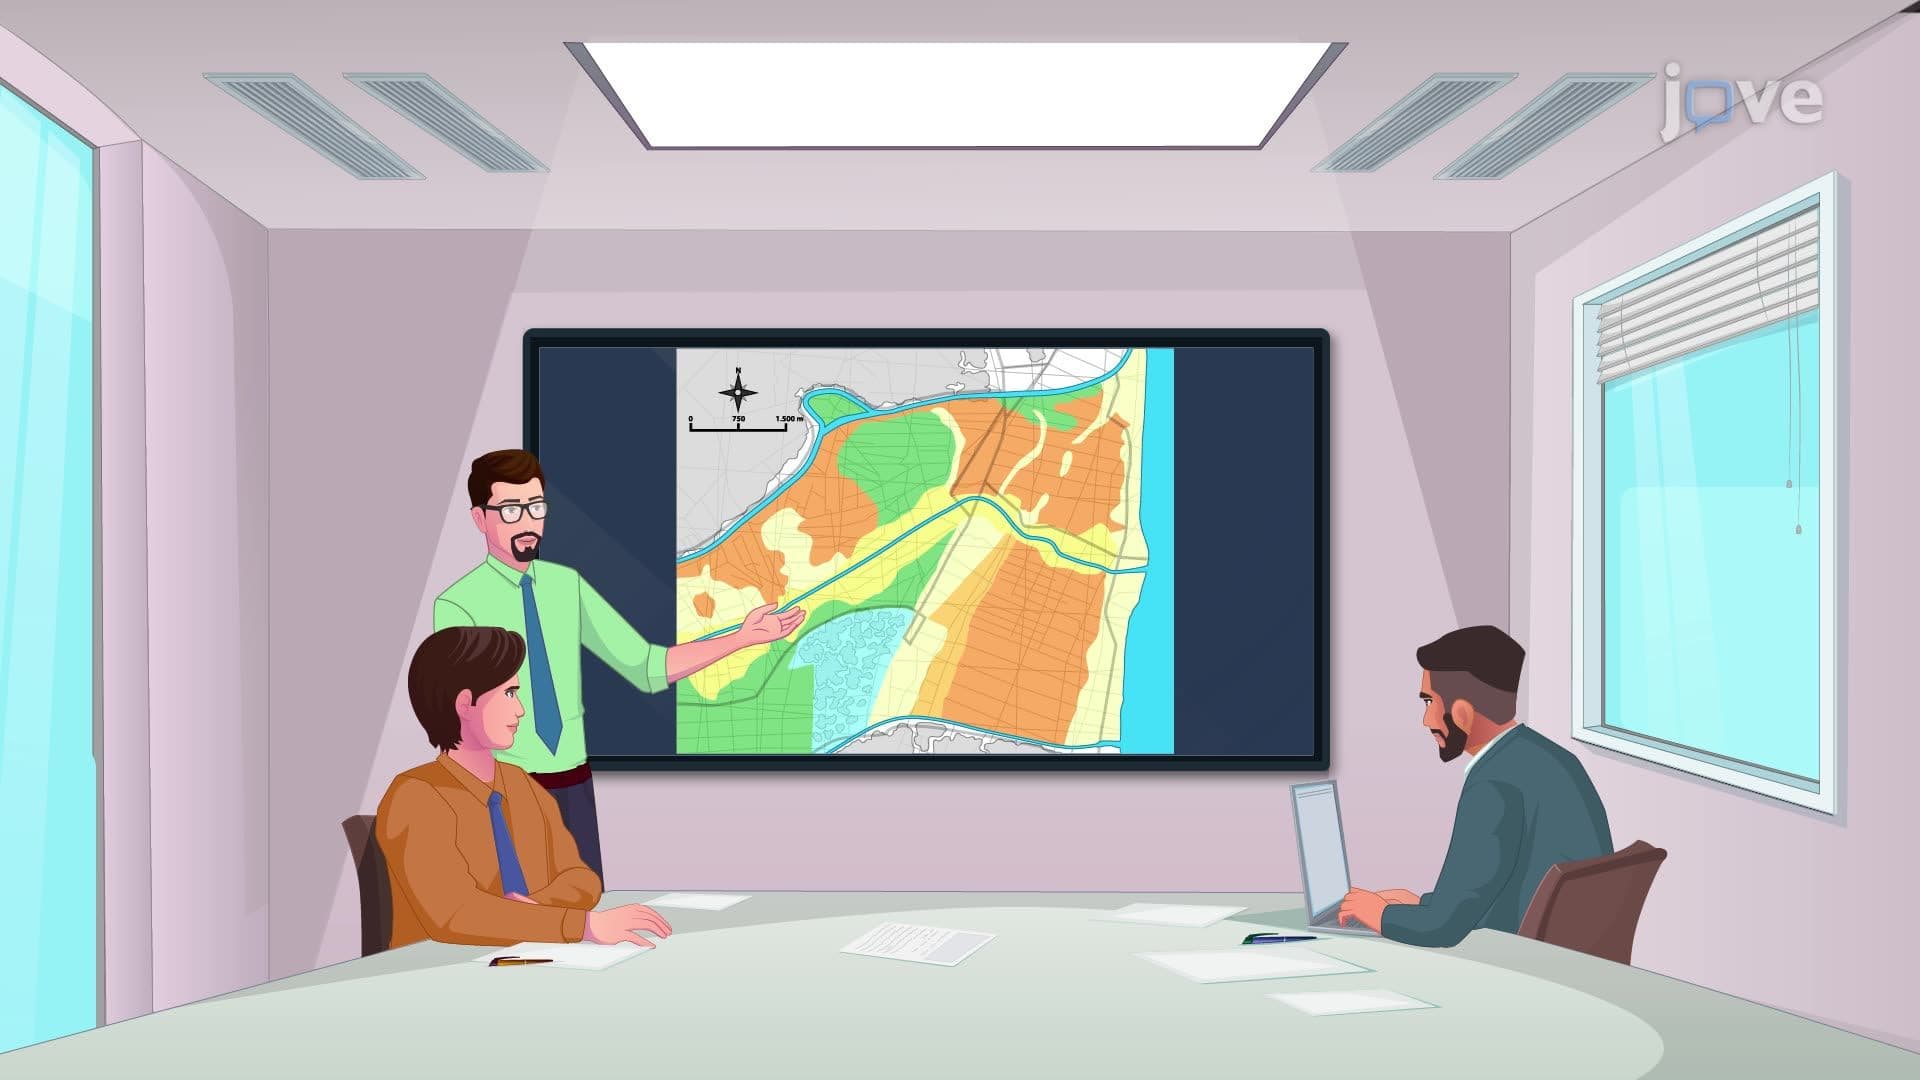
Spatial data forms the geometric backbone of any GIS analysis. When the Federal Emergency Management Agency (FEMA) maps flood zones across Louisiana, they rely on precise coordinate systems to define boundaries. These coordinates typically use decimal degrees (like 29.9511° N, 90.0715° W for New Orleans) or state plane coordinates for local accuracy. Students preparing for AP Human Geography or college-level GIS courses should understand that spatial accuracy directly impacts analytical results, a principle tested frequently on standardized exams.
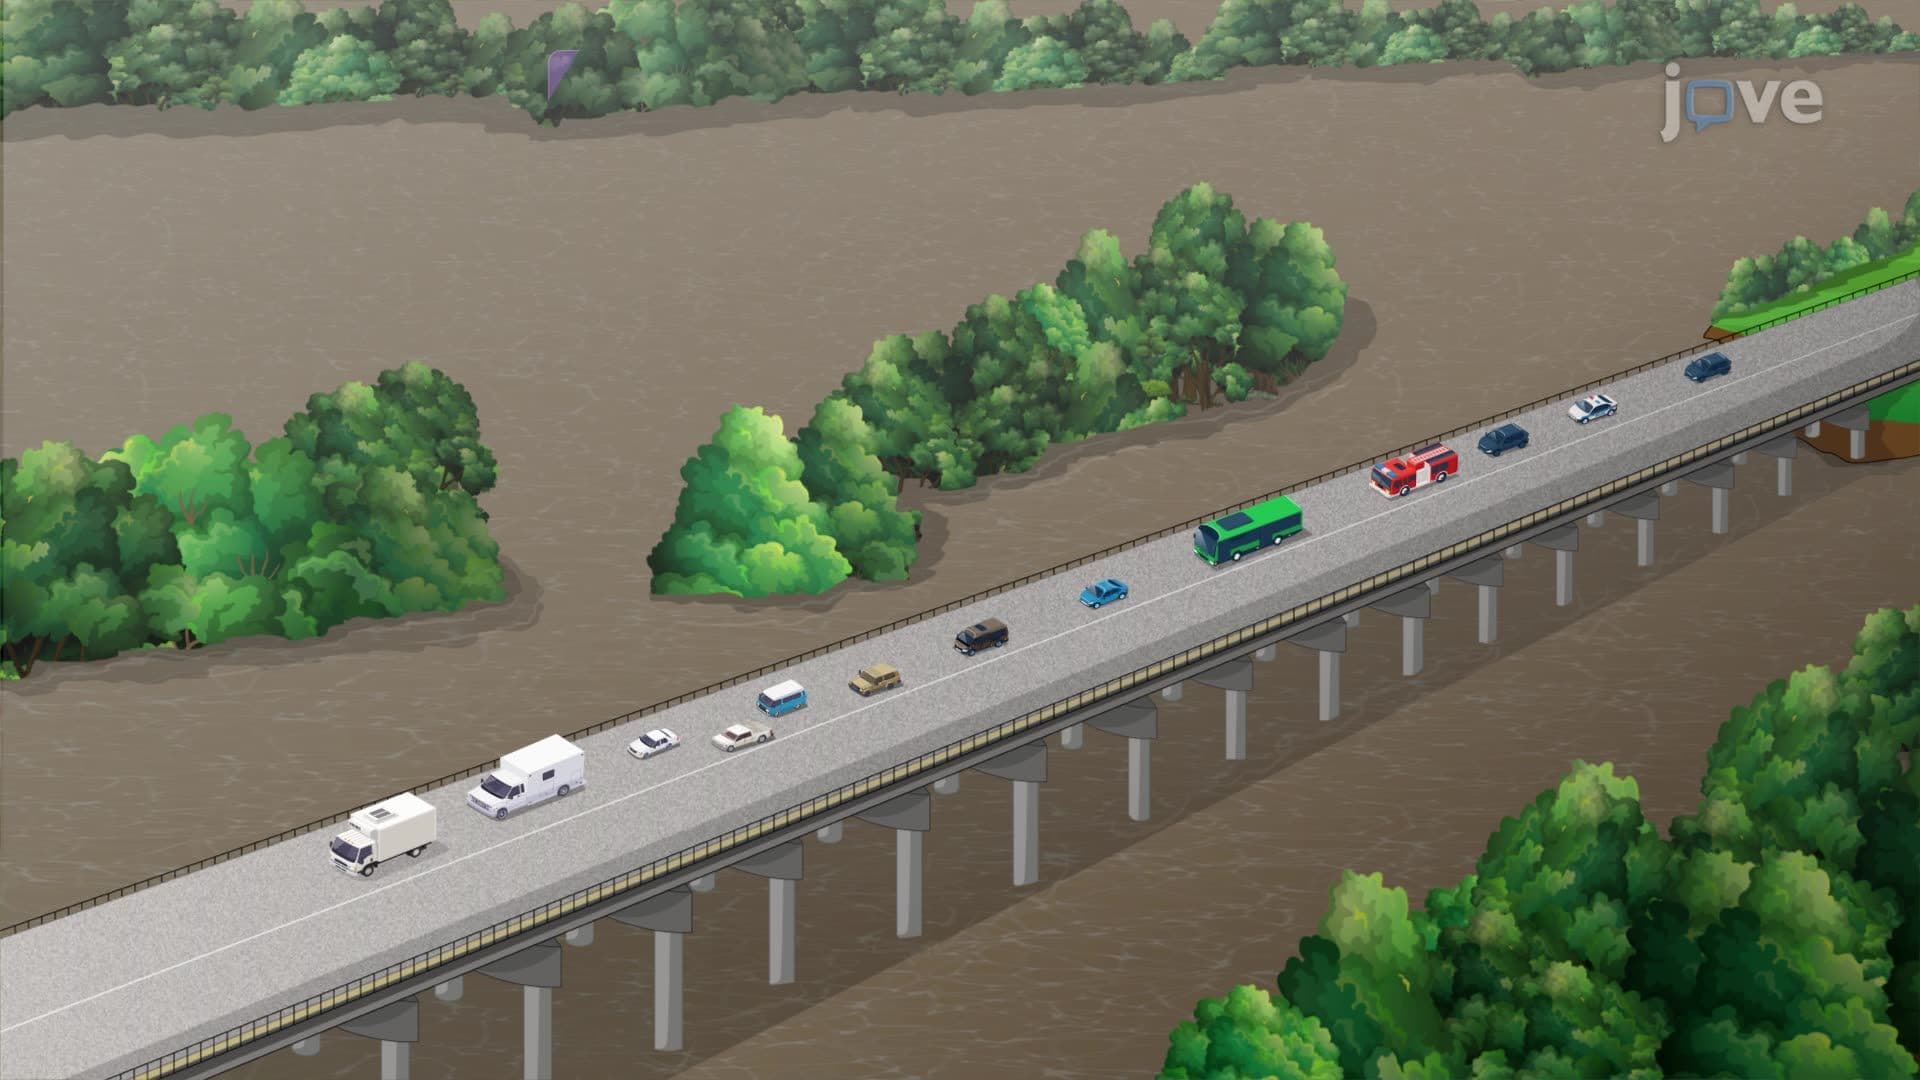
Attribute data transforms simple coordinates into actionable intelligence. The US Department of Transportation maintains massive databases linking highway coordinates to traffic volume, accident rates, construction status, and maintenance schedules. For a single interstate segment, attribute data might include speed limits, surface materials, construction dates, and average daily traffic counts. This information enables evidence-based decision-making for infrastructure investments and safety improvements.
The raster model divides geographic space into uniform grid cells, similar to pixels in a digital photograph. NASA's Landsat satellite imagery uses raster data to monitor deforestation in national forests, with each 30-meter cell containing spectral information about ground cover. The National Weather Service employs raster models for precipitation forecasting, creating detailed maps where each cell represents rainfall intensity.
Vector models use mathematical geometry, points, lines, and polygons, to represent features precisely. The US Geological Survey's topographic maps utilize vector data to show exact boundaries of lakes (polygons), river networks (lines), and mountain peaks (points). Vector models excel at representing discrete features with sharp boundaries, making them ideal for legal property boundaries and infrastructure planning.
Students tackling SAT Subject Tests or college midterms should remember that model selection depends on the analytical purpose: raster for continuous phenomena like temperature or elevation, vector for discrete features like buildings or political boundaries.
Related Micro-courses