Loading video…


 9 Concepts
 1.9K views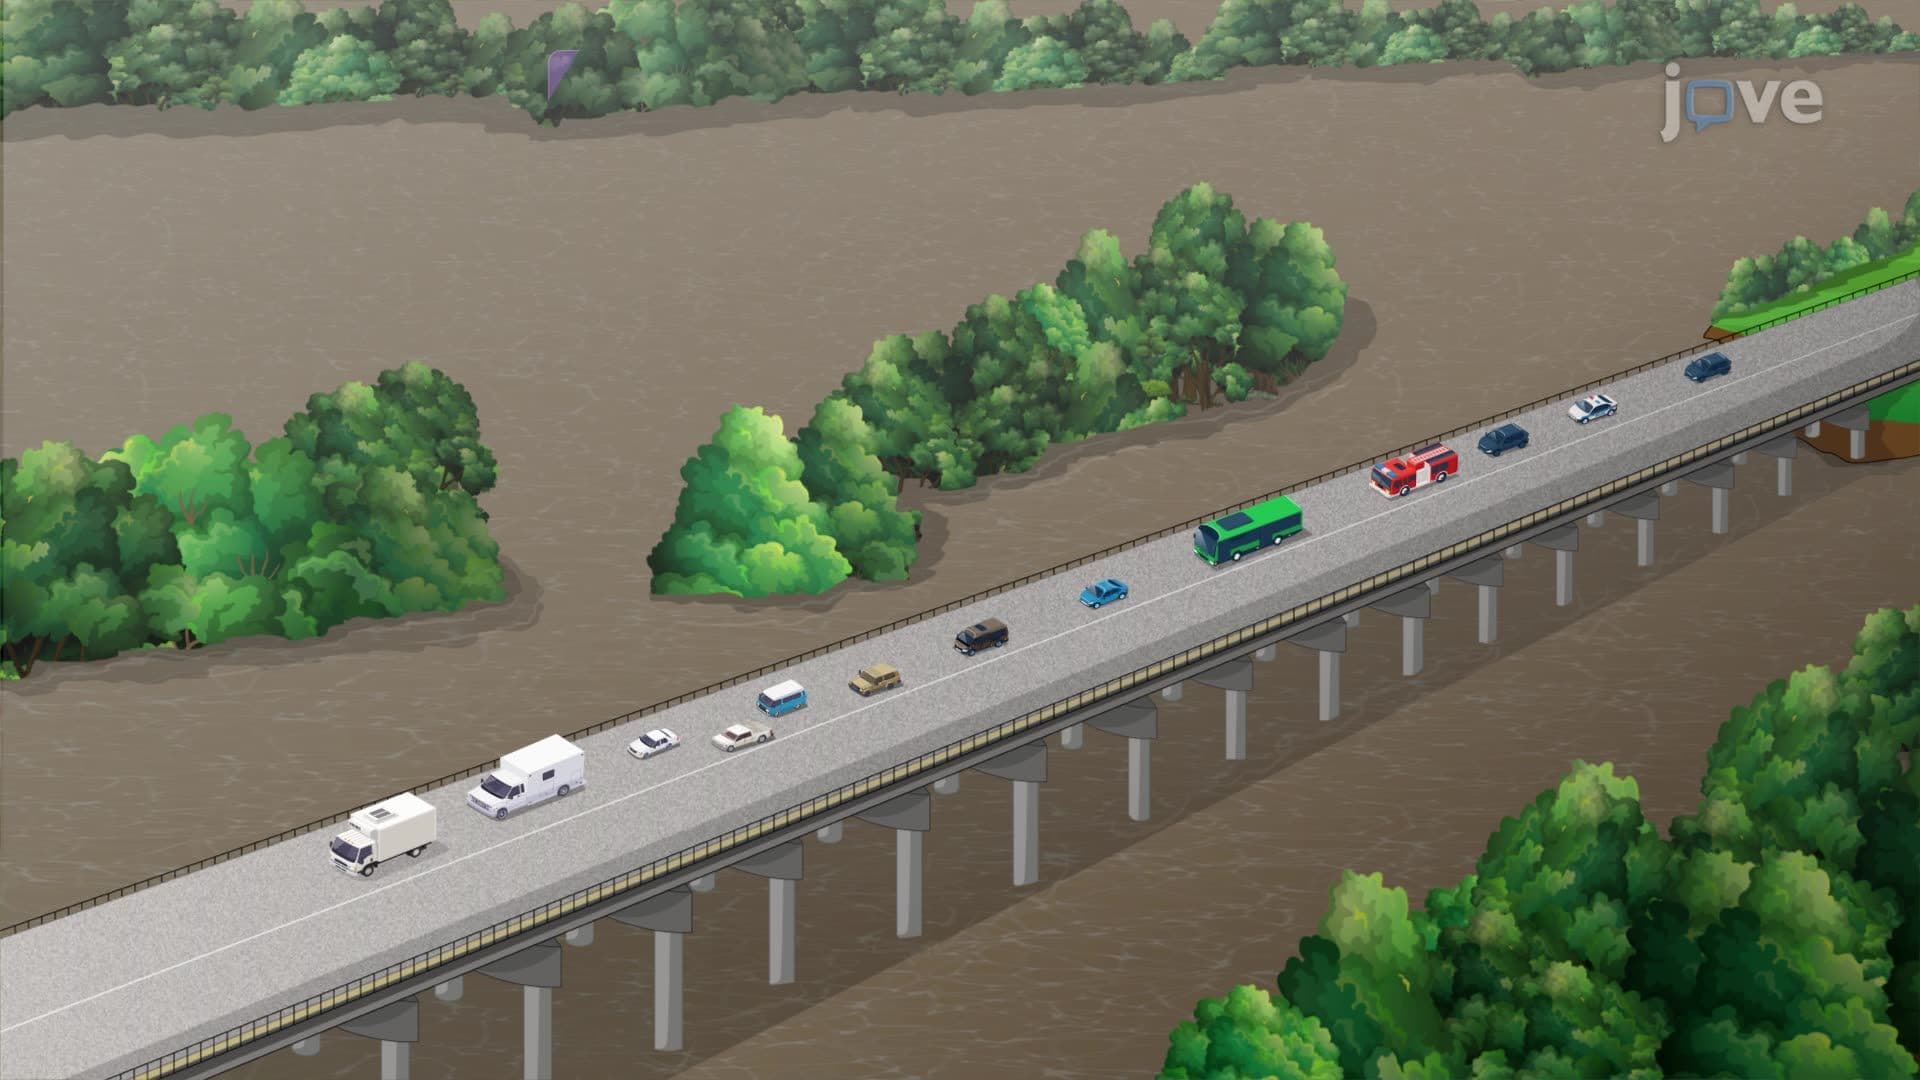

Video Summary: What Is Manipulation and Analysis
Ever wonder how emergency responders determine the fastest route to reach disaster victims during Hurricane Florence in North Carolina? Coordinates and map projections form the foundation for sophisticated Geographic Information Systems (GIS) that enable critical spatial analysis and decision-making. Through advanced manipulation and analysis techniques like overlaying, buffering, and least-cost path calculations, GIS transforms raw geographic data into actionable intelligence for everything from evacuation planning to business site selection. Watch the full video on JoVE Coach to master this concept with expert-led visuals and step-by-step explanations.
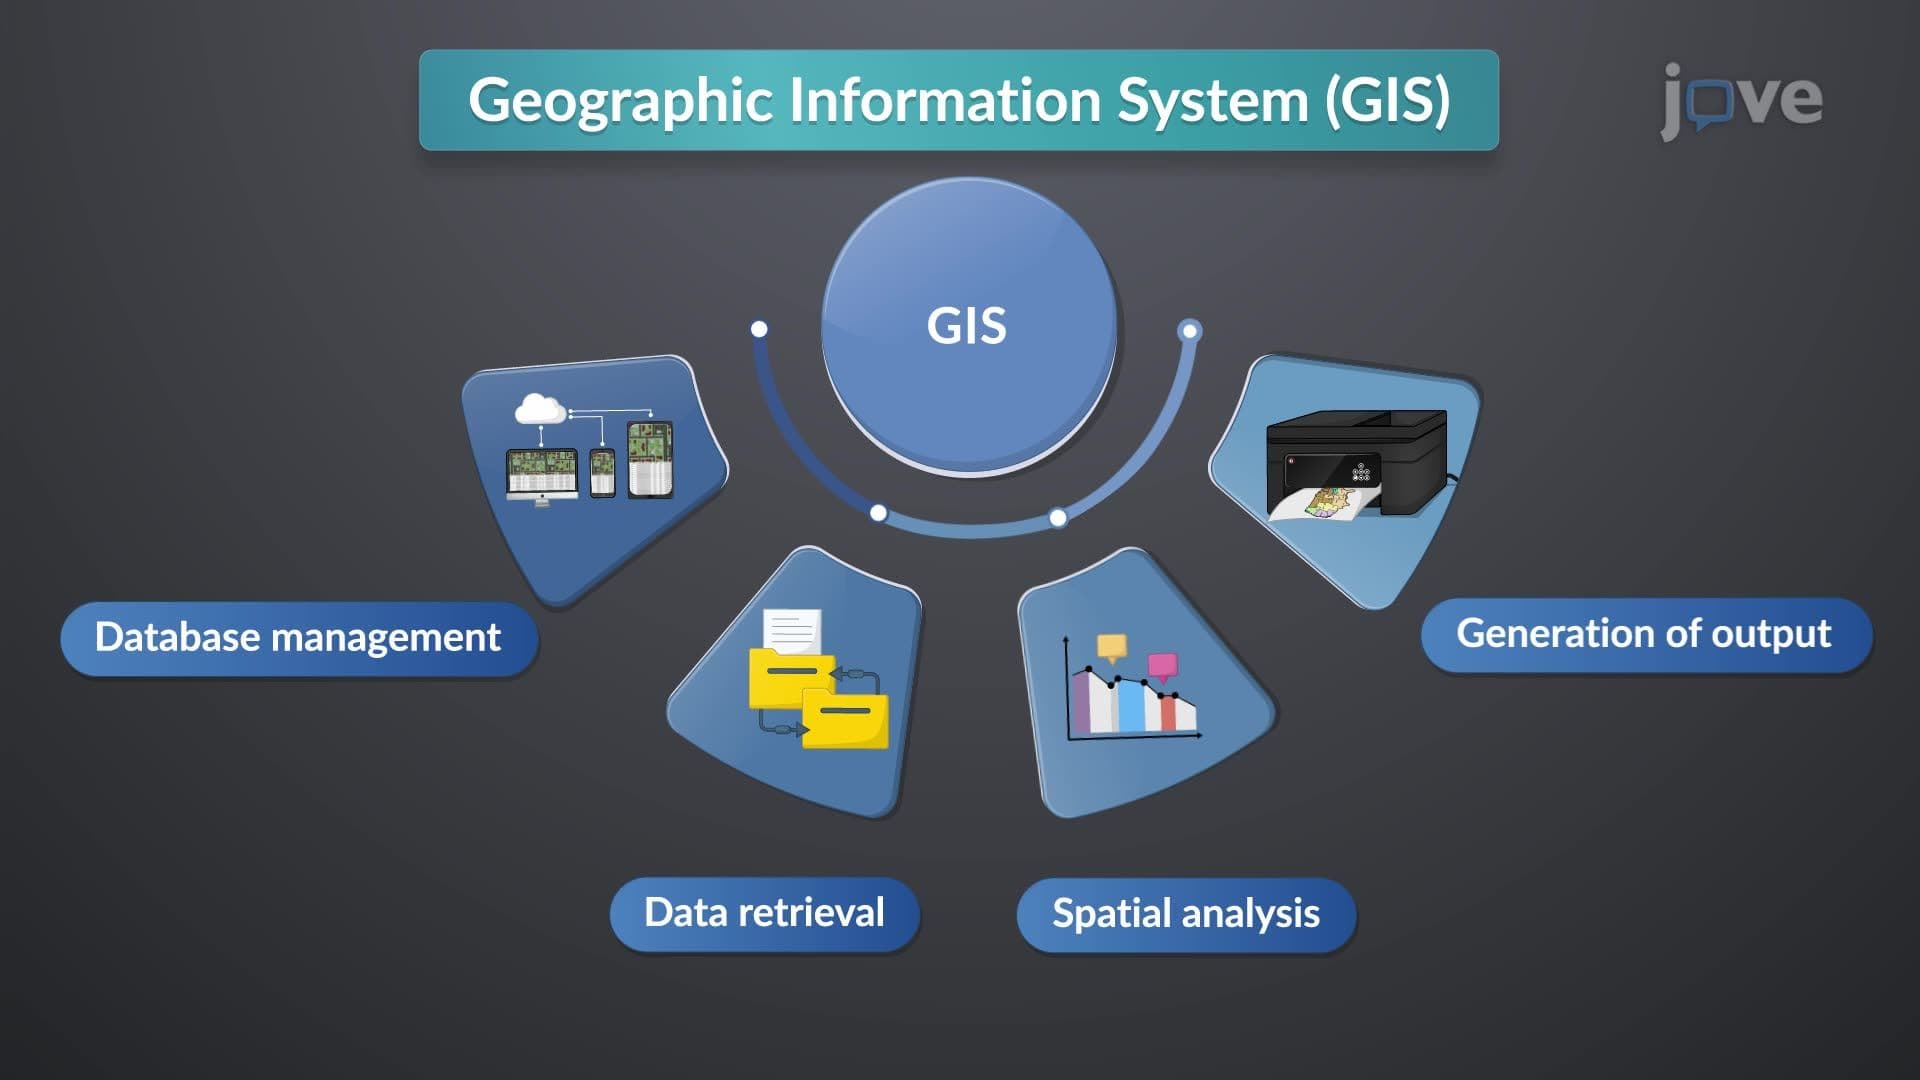
Manipulation and analysis represents the computational heart of Geographic Information Systems, where raw spatial data transforms into meaningful insights for decision-making. While coordinates and map projections provide the spatial framework, manipulation and analysis techniques extract patterns, relationships, and solutions from geographic datasets. This process goes far beyond simple map creation-it involves sophisticated computational methods that solve real-world problems across multiple disciplines.
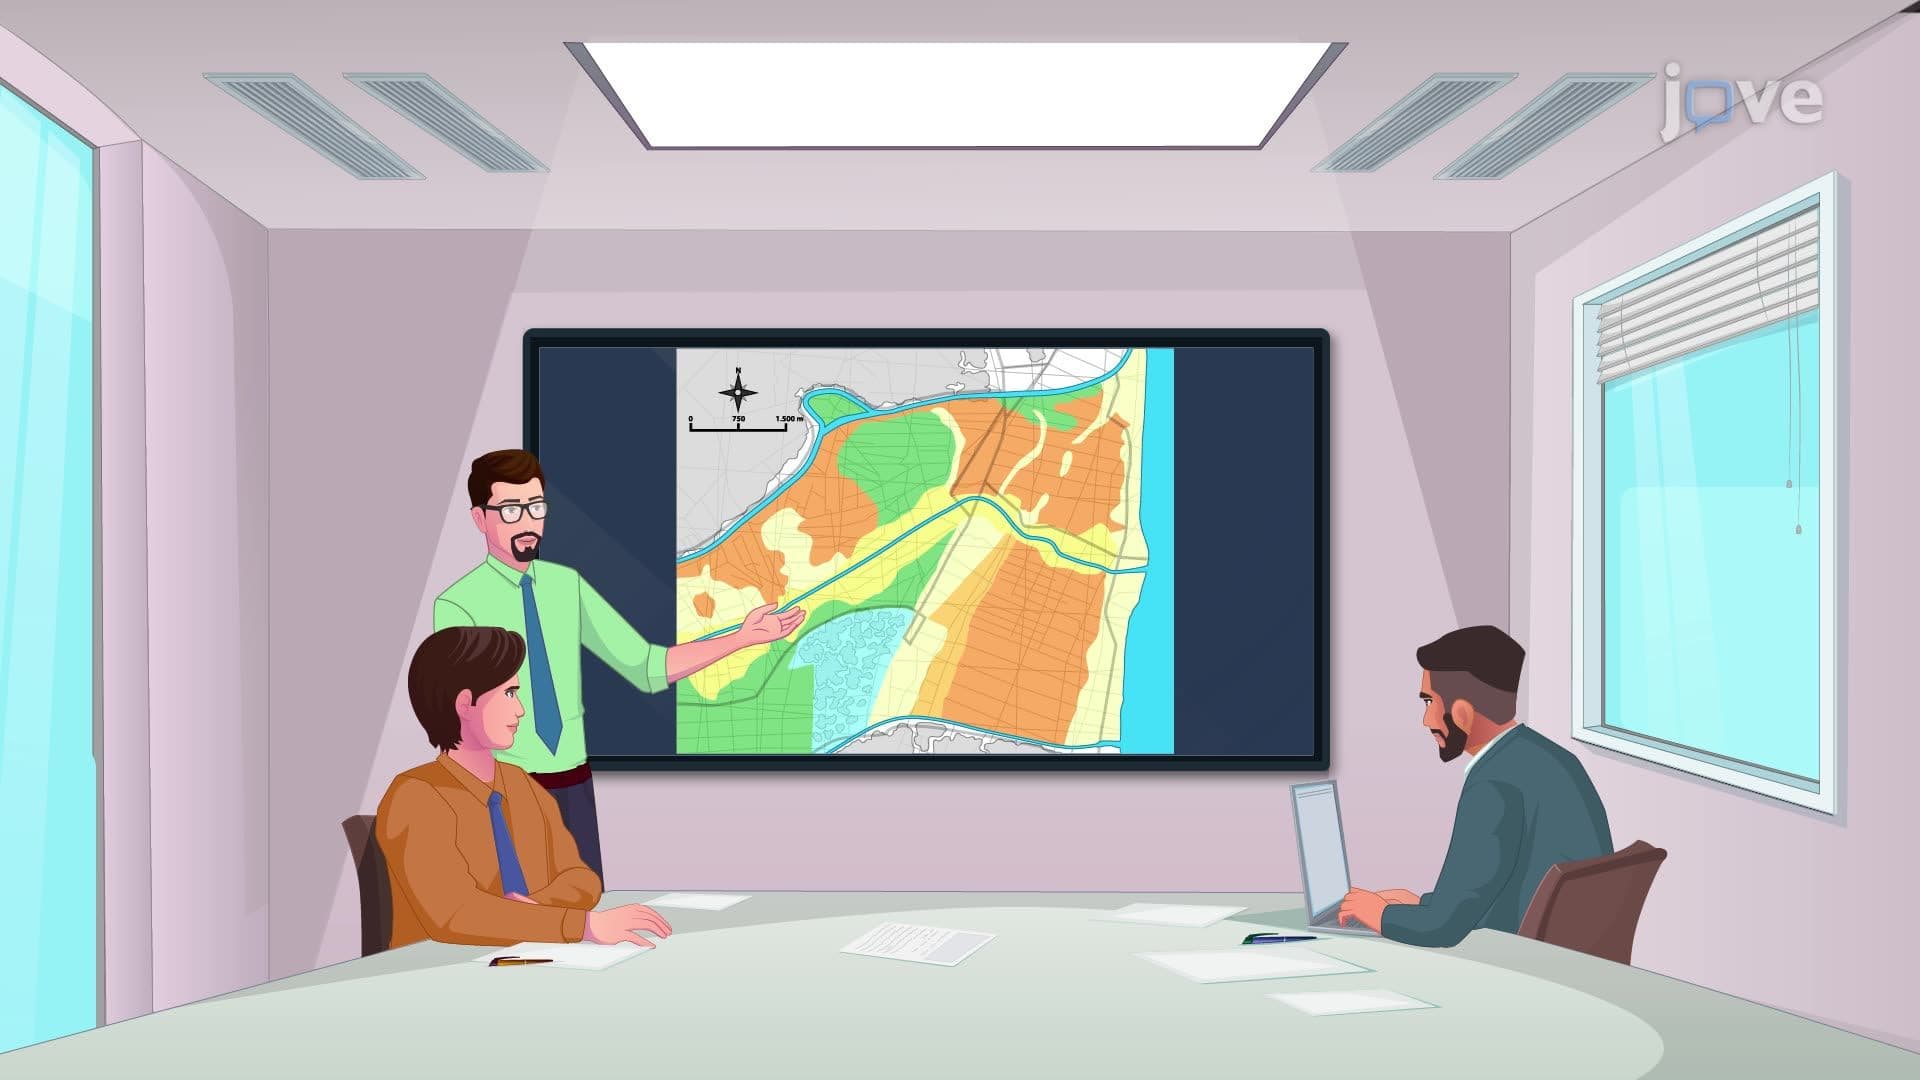
Data overlay analysis serves as one of the most fundamental GIS operations, combining multiple data layers to reveal spatial relationships. For instance, the U.S. Army Corps of Engineers uses overlay techniques to assess how proposed dam construction might affect existing infrastructure, combining elevation models, road networks, and building footprints to predict flooding impacts. This technique proves essential for AP Environmental Science students studying human-environment interactions and appears frequently on college-level geography examinations.
Buffering operations create proximity zones around geographic features, enabling planners to identify areas within specific distances of important locations. The Federal Emergency Management Agency (FEMA) employs buffering to establish evacuation zones around nuclear power plants, creating concentric circles at 10-mile and 50-mile radii. Students preparing for the AP Human Geography exam often encounter buffering problems related to urban planning and land use analysis.
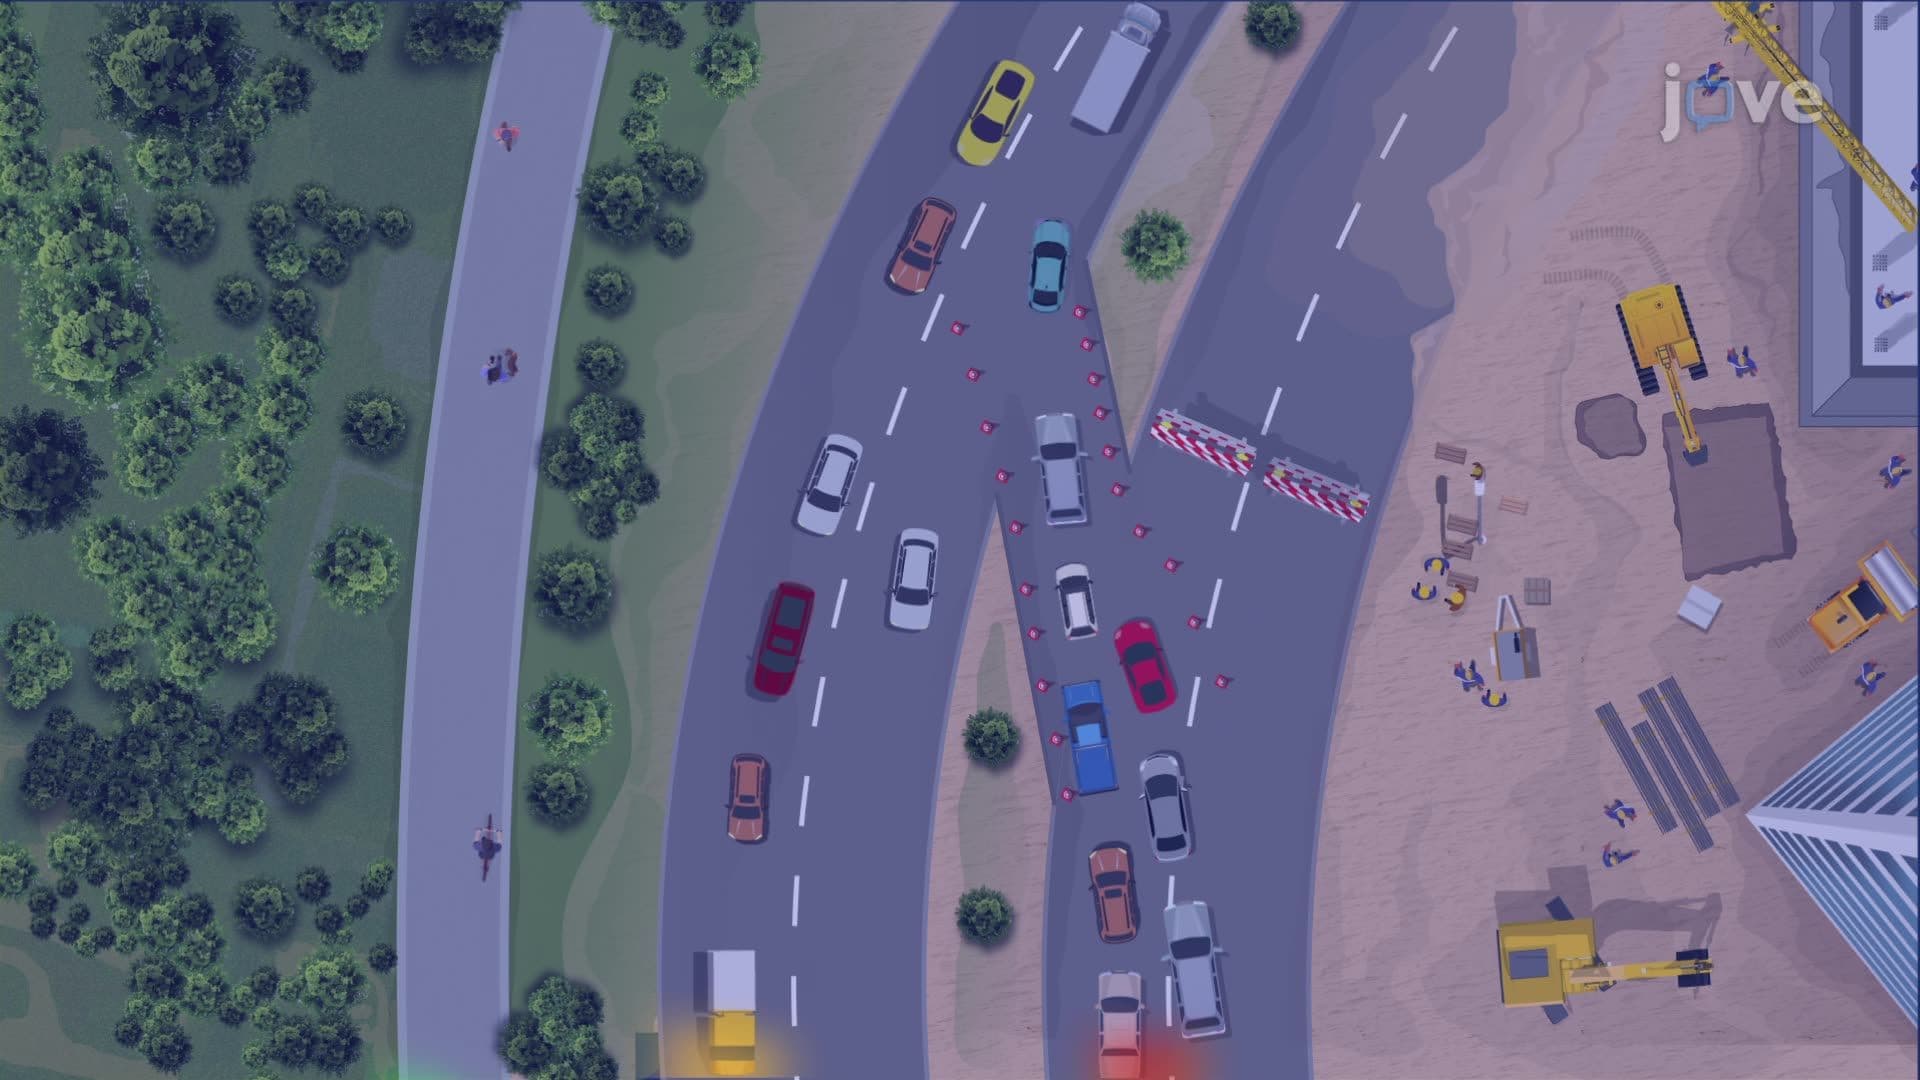
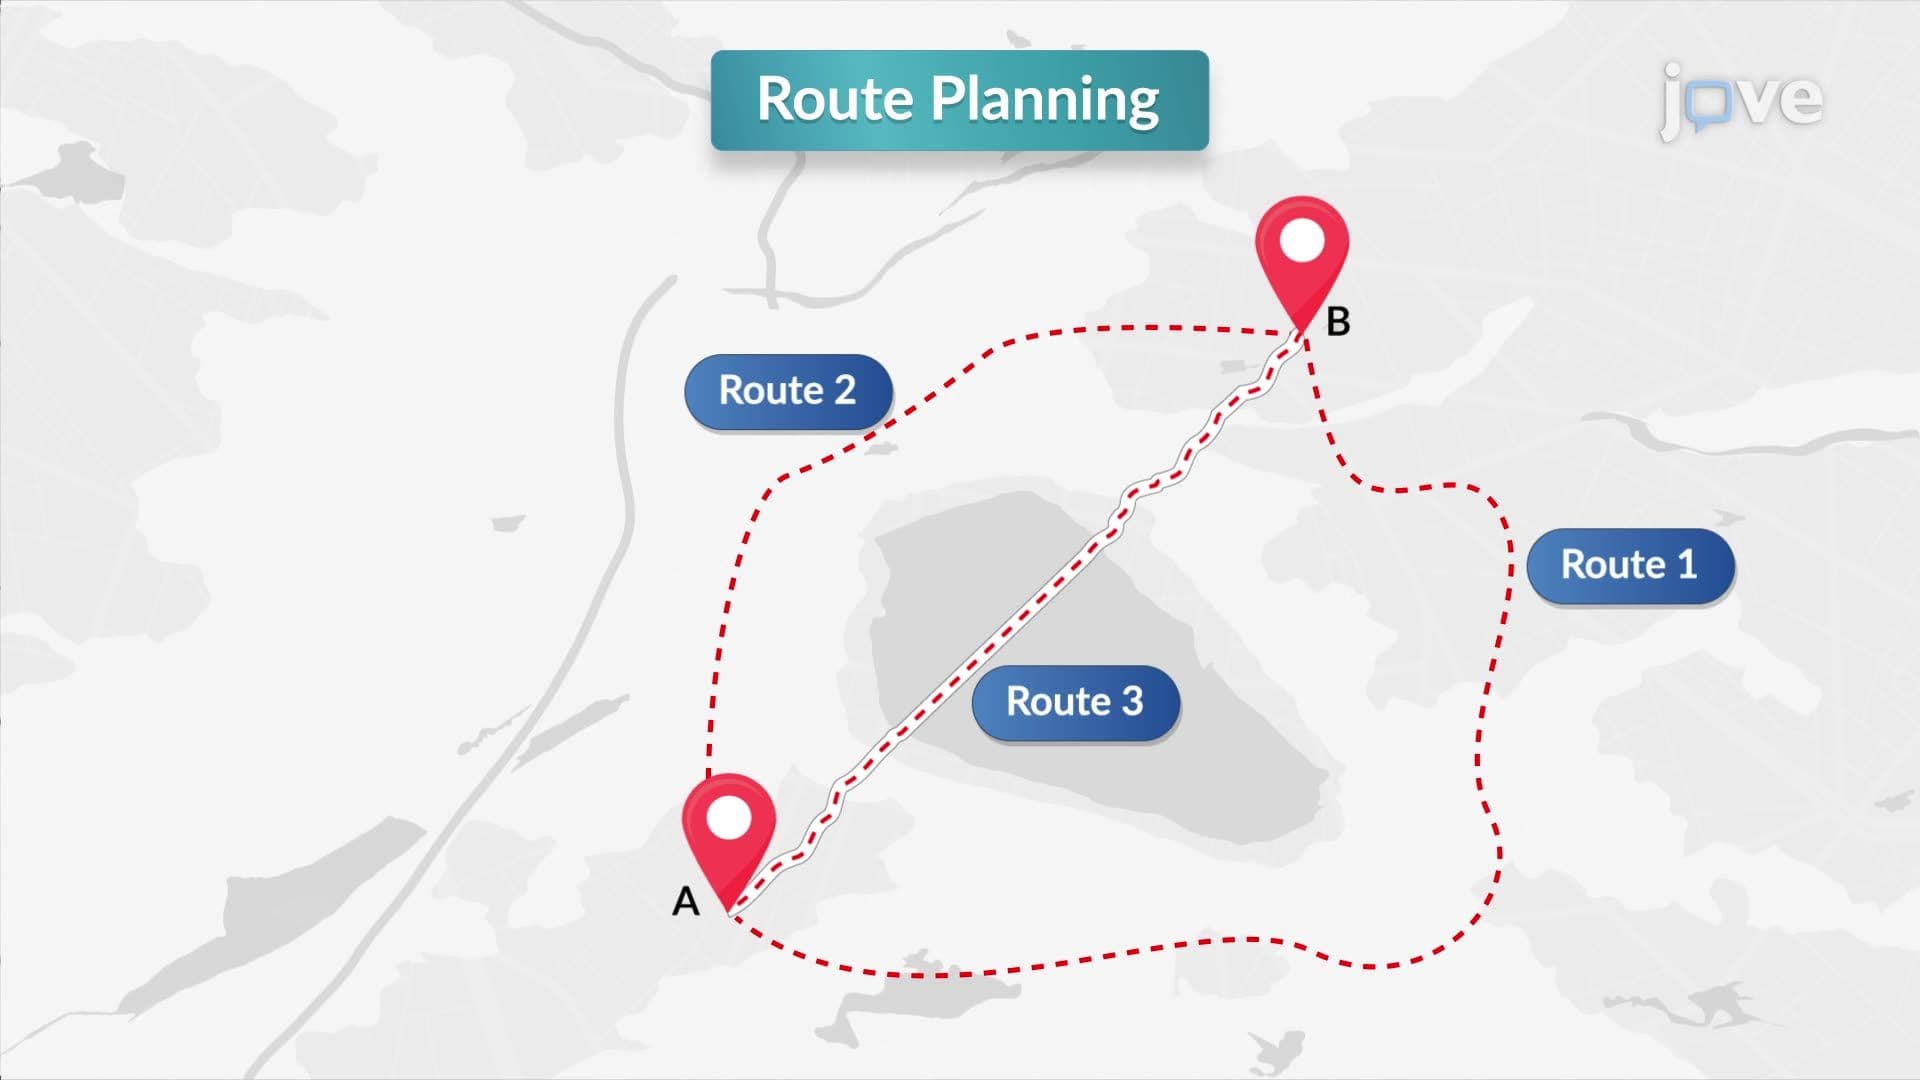
Least-cost path analysis represents a sophisticated algorithmic approach that considers multiple variables beyond simple distance. Emergency management systems in California use these calculations to optimize ambulance routing during wildfire evacuations, factoring in road conditions, traffic patterns, and terrain obstacles. This concept bridges geography and computer science, making it relevant for students in both AP Computer Science and AP Geography courses.
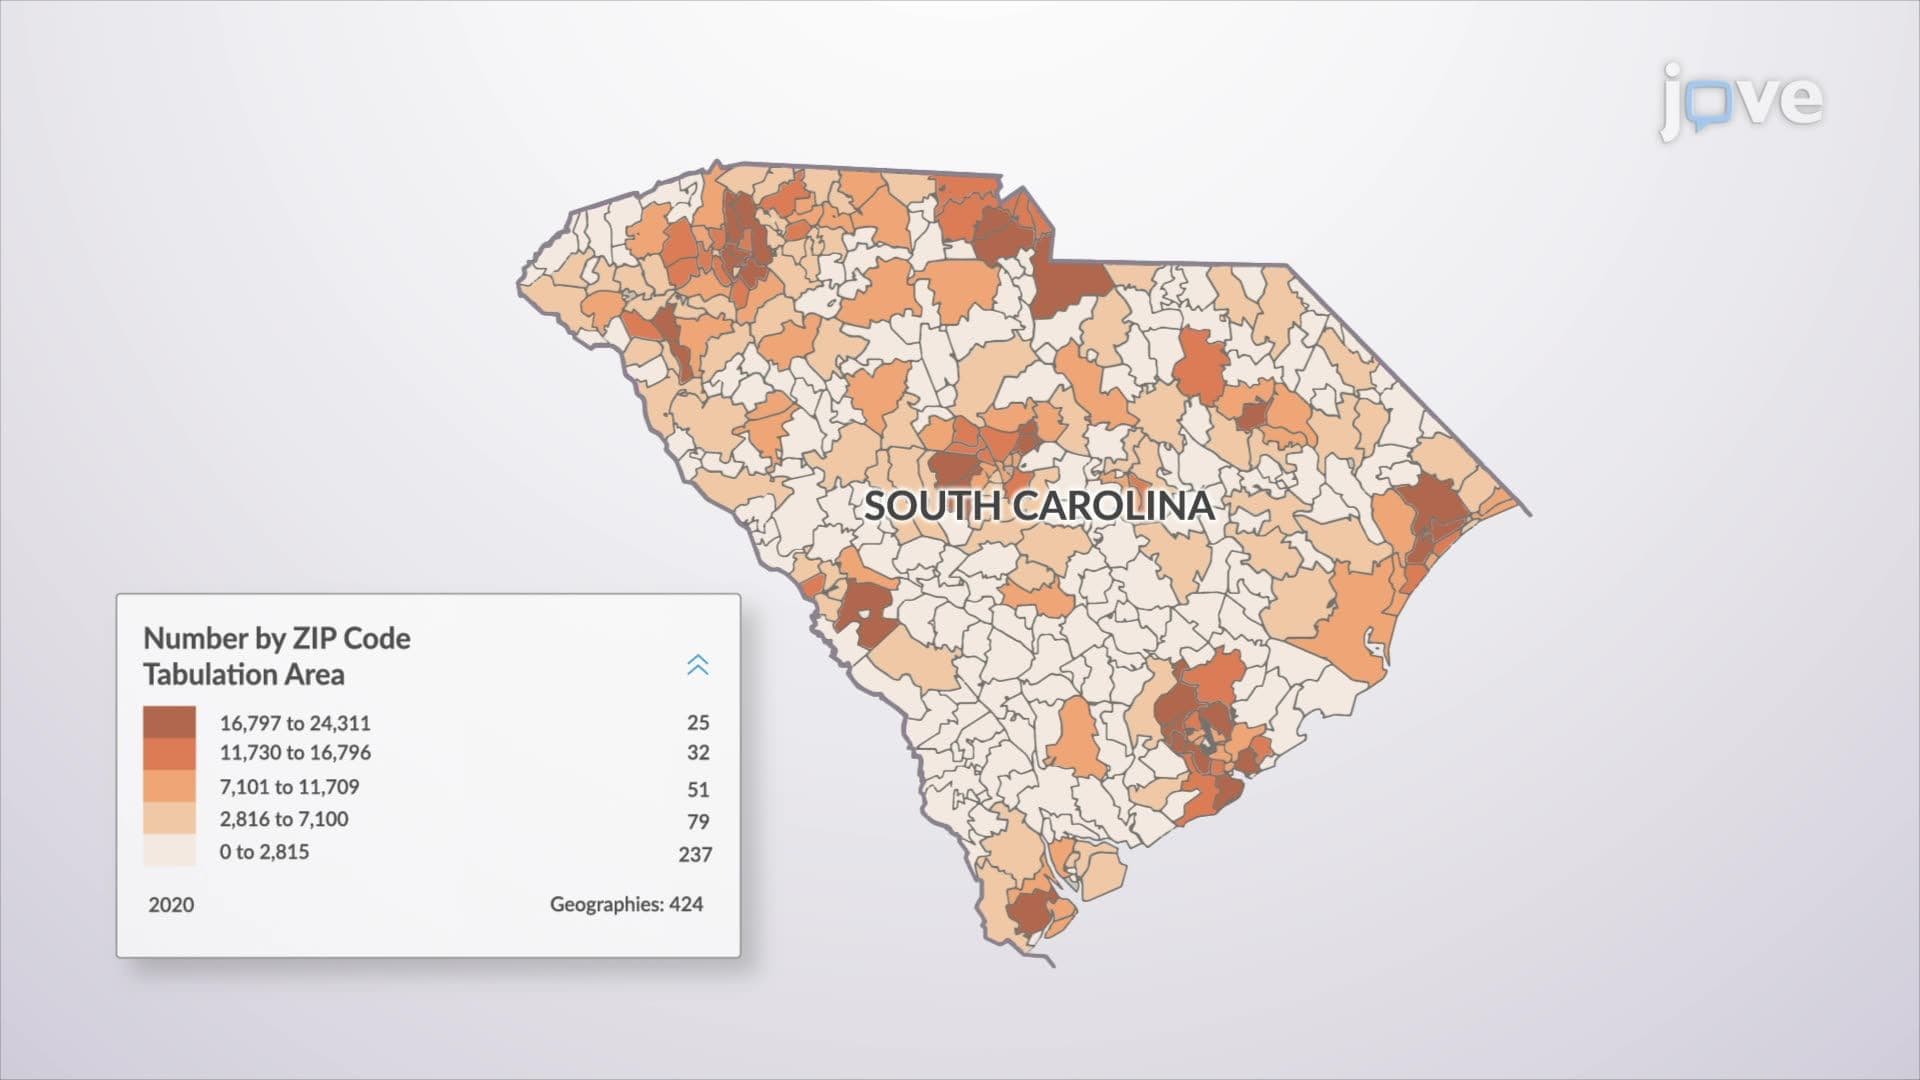
Statistical spatial analysis employs mathematical techniques like spatial autocorrelation to detect clustering patterns and spatial relationships. The Centers for Disease Control and Prevention utilizes these methods to identify disease outbreak hotspots, analyzing whether cases cluster geographically or occur randomly across populations. Understanding these statistical concepts prepares students for both AP Statistics and college-level epidemiology courses.
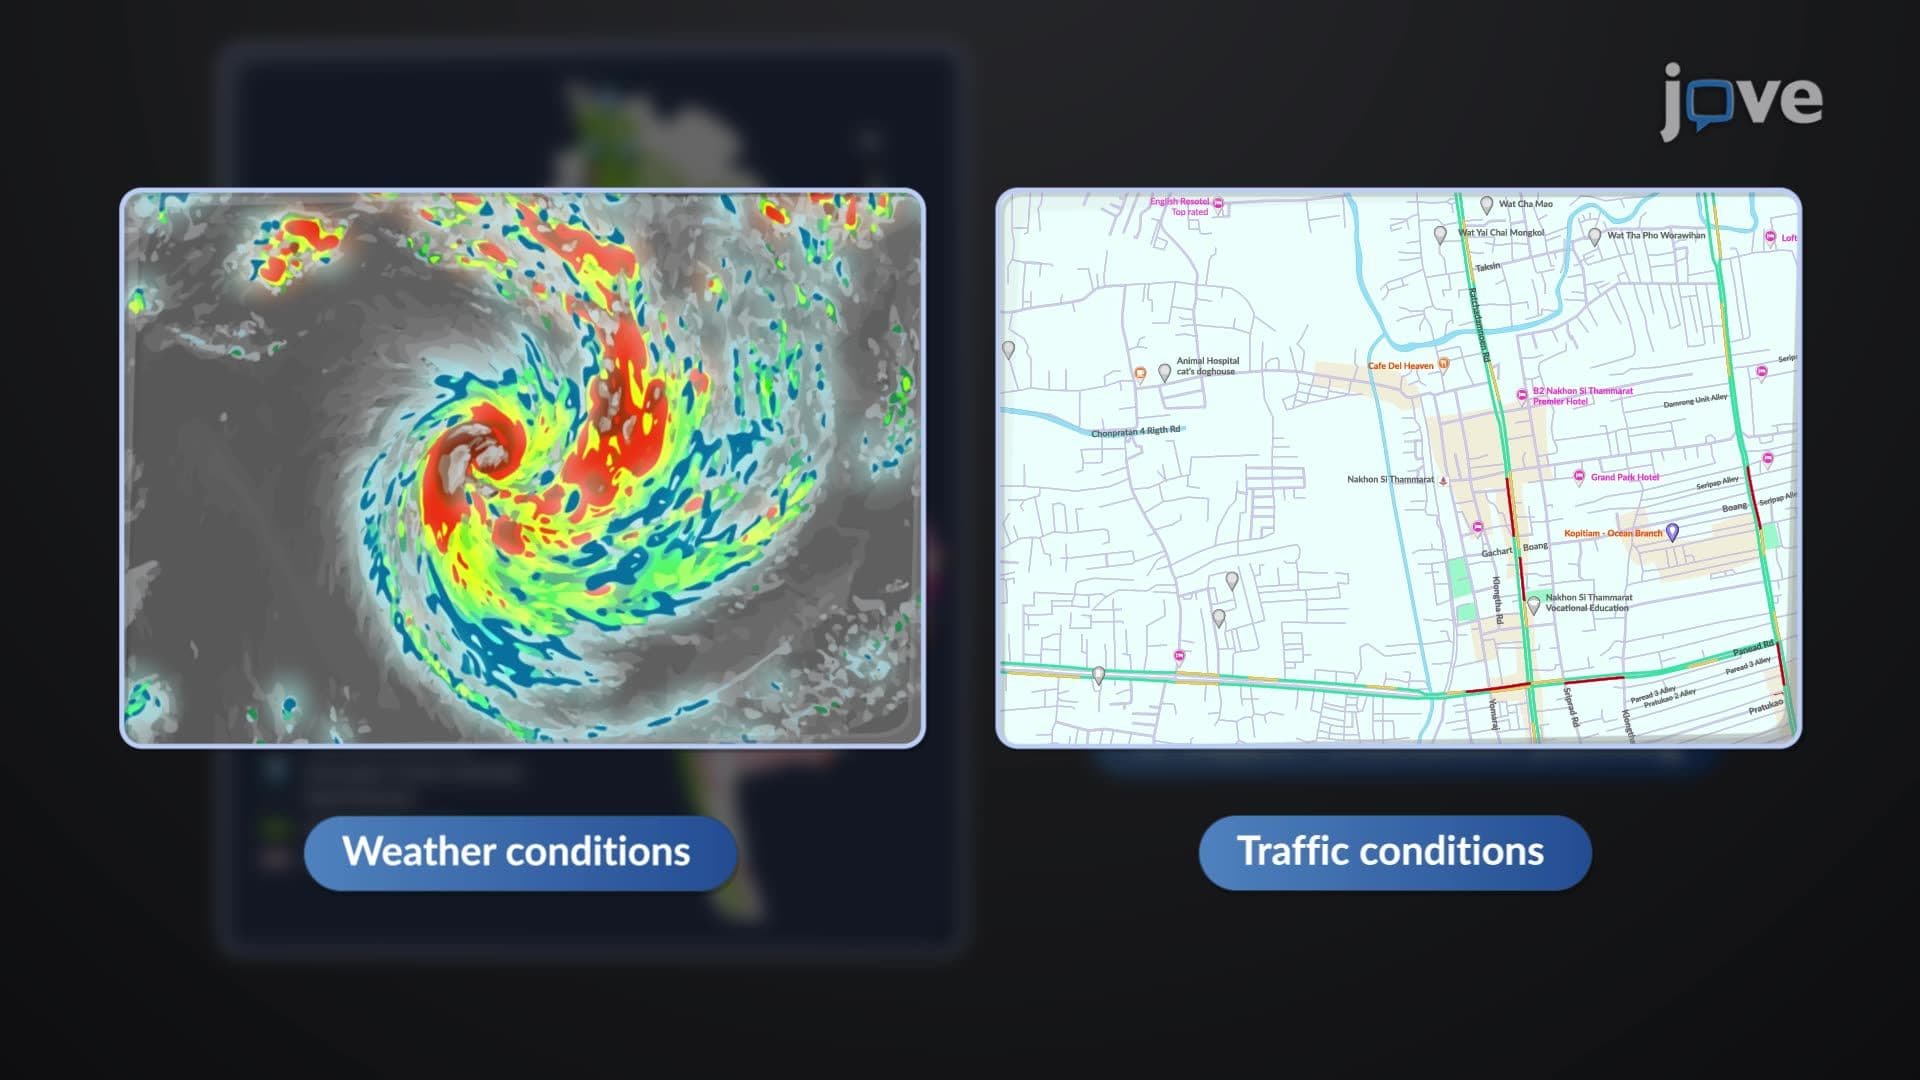
Effective spatial analysis culminates in clear visual communication through maps, charts, and graphs. The National Weather Service exemplifies this principle by transforming complex meteorological data into easily interpreted weather maps using standardized color schemes and symbols. These visualization skills prove valuable across multiple academic disciplines and standardized tests, from SAT Subject Tests in Mathematics to college geography comprehensive exams.
Related Micro-courses