Loading subject page…

218 views

Video Summary: What are Graphs of Polar Equations
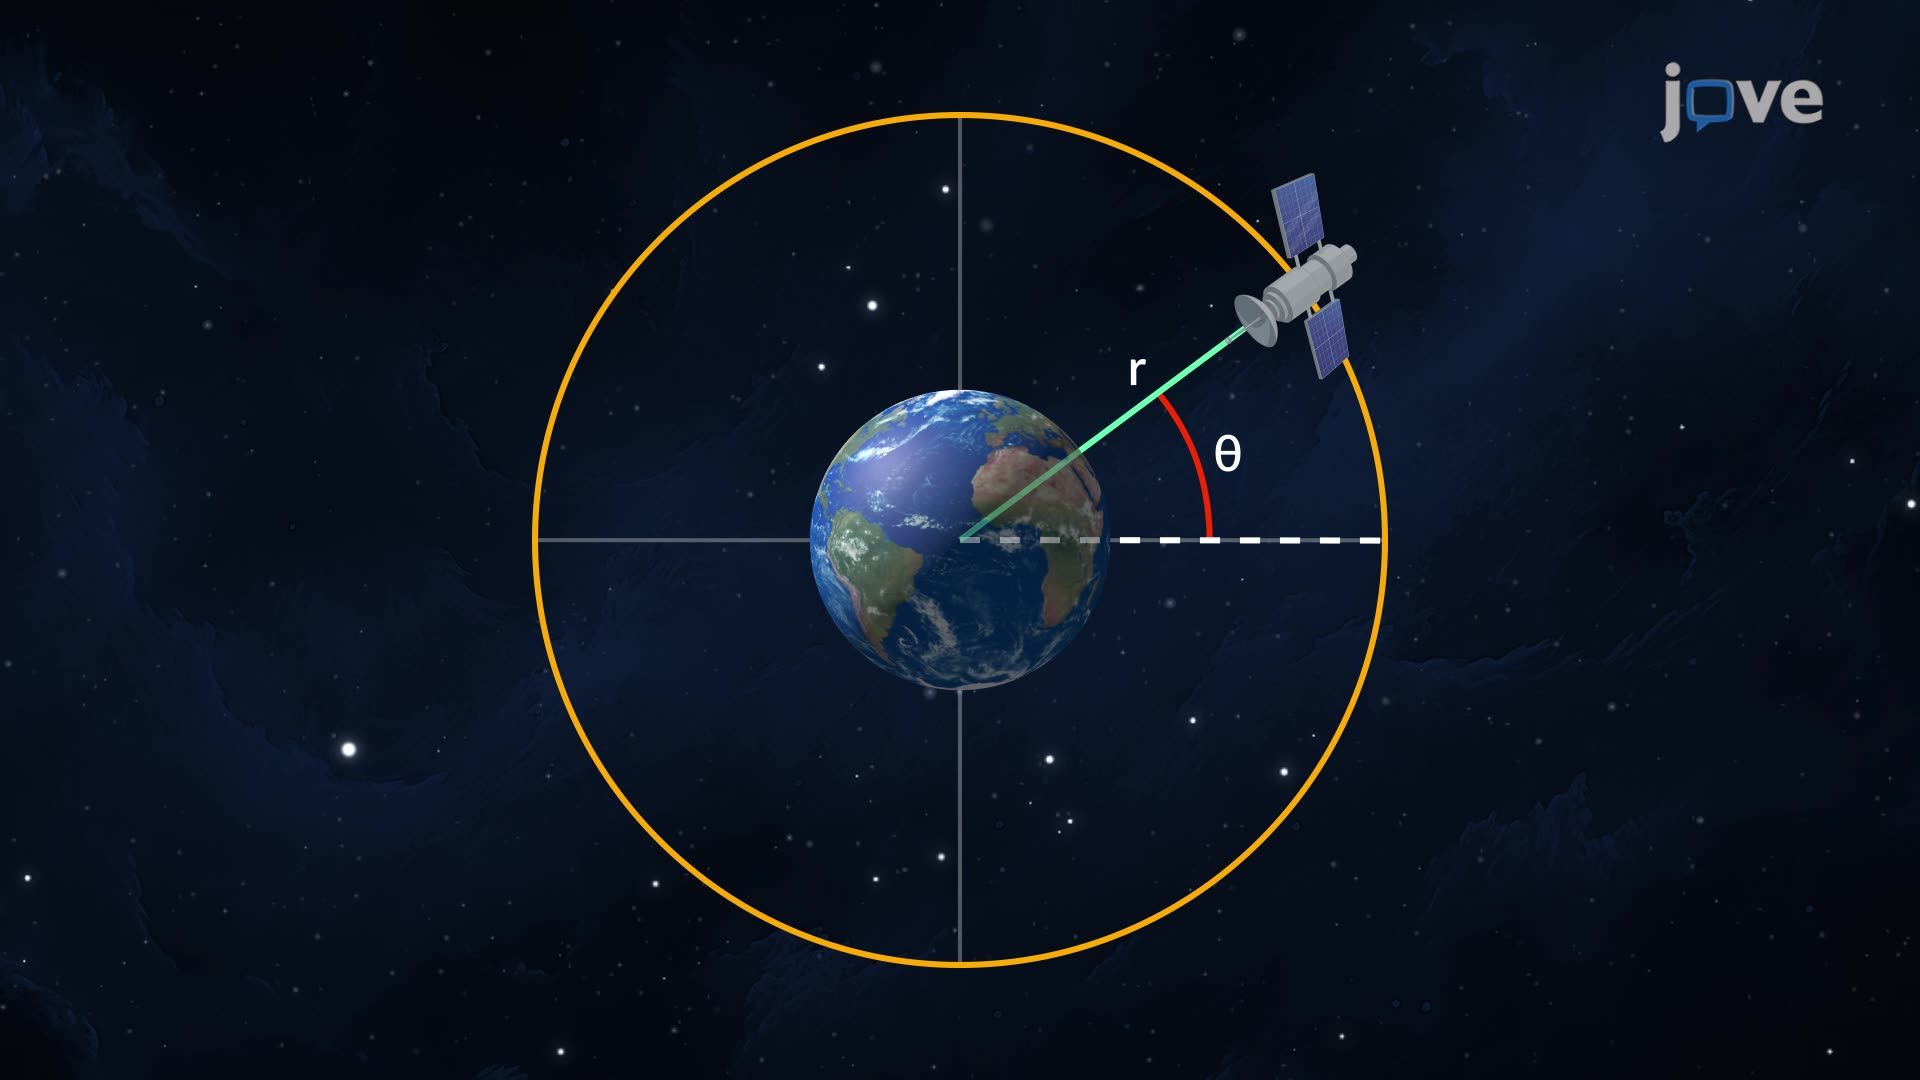
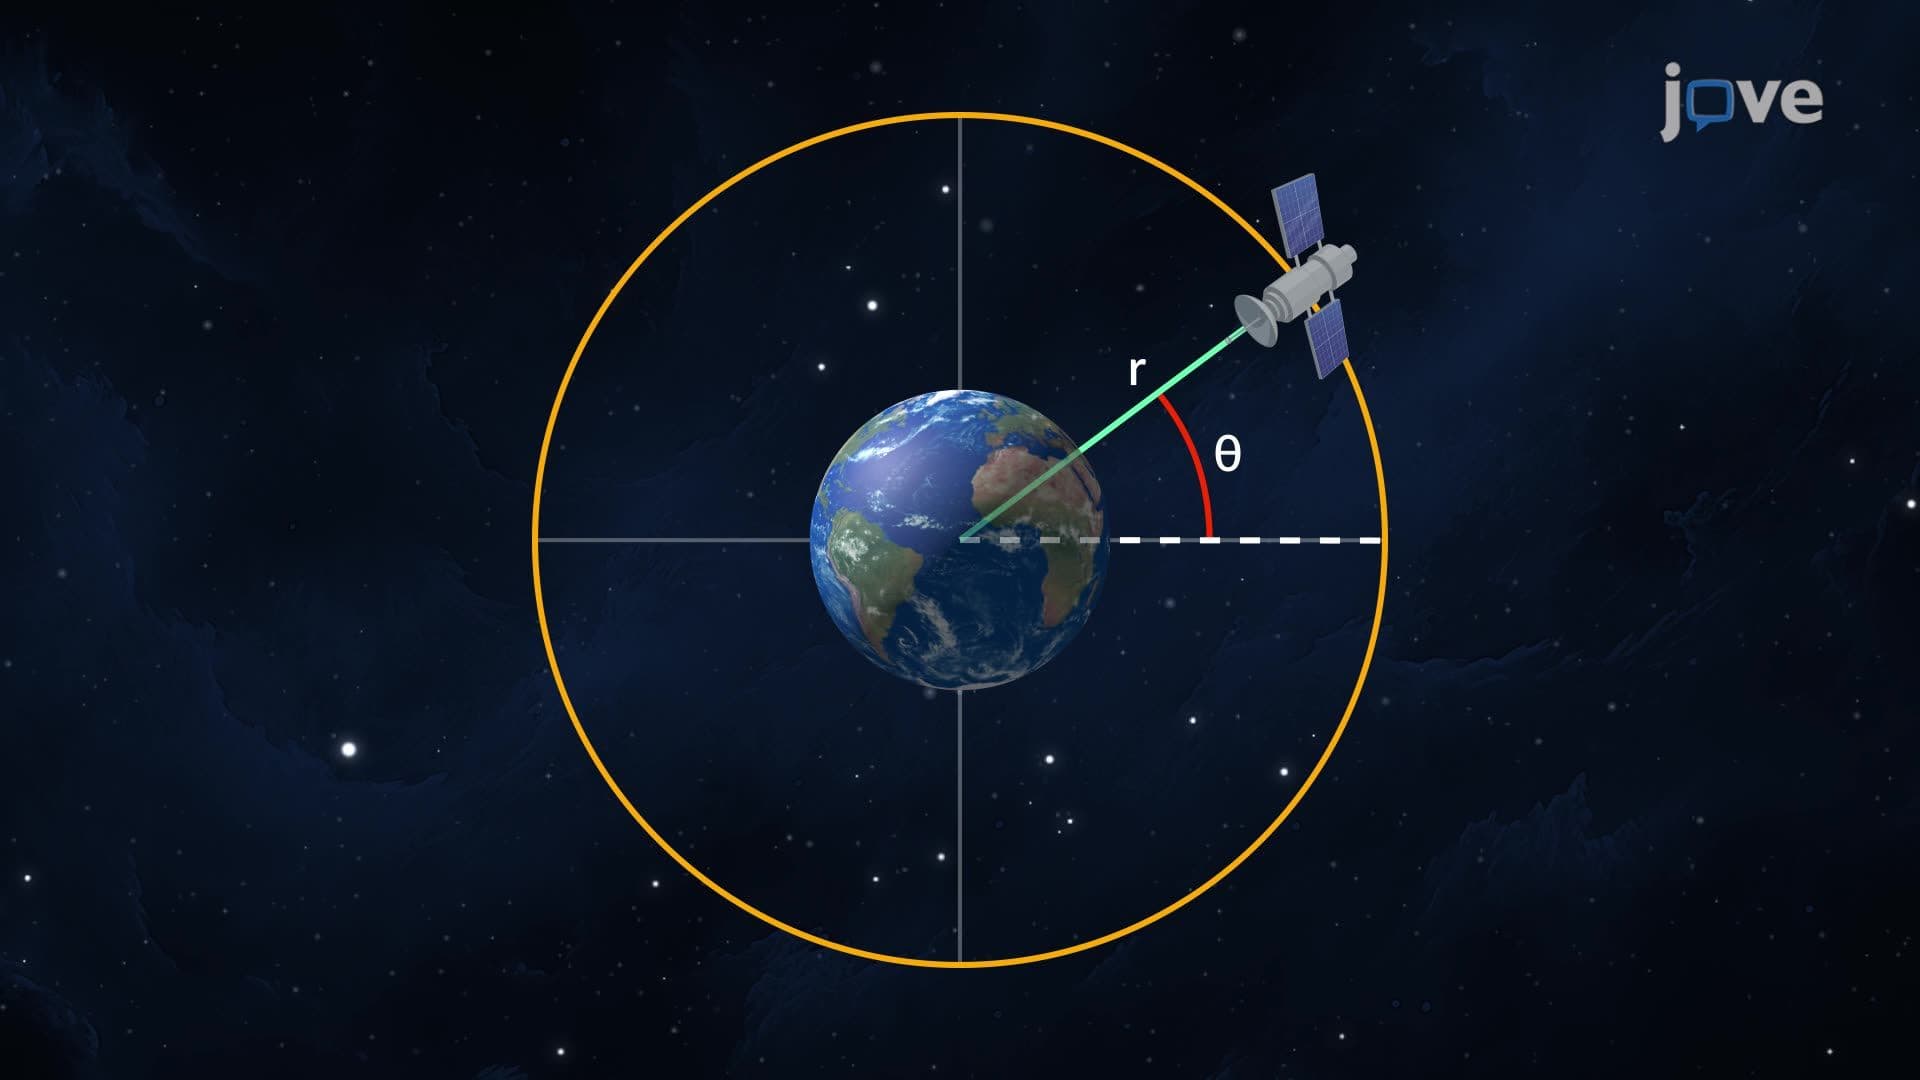
Did you know that NASA uses graphs of polar equations to track the International Space Station's orbit around Earth? These specialized coordinate systems represent points using distance and angle rather than traditional x-y coordinates. Understanding what are graphs of polar equations reveals how mathematical relationships create circles, spirals, and other curved paths essential in fields from satellite navigation to engineering design. From tracing GPS satellite positions to modeling hurricane paths, polar graphs provide precise tools for real-world applications. Watch the full video on JoVE Coach to master this concept with expert-led visuals and step-by-step explanations.
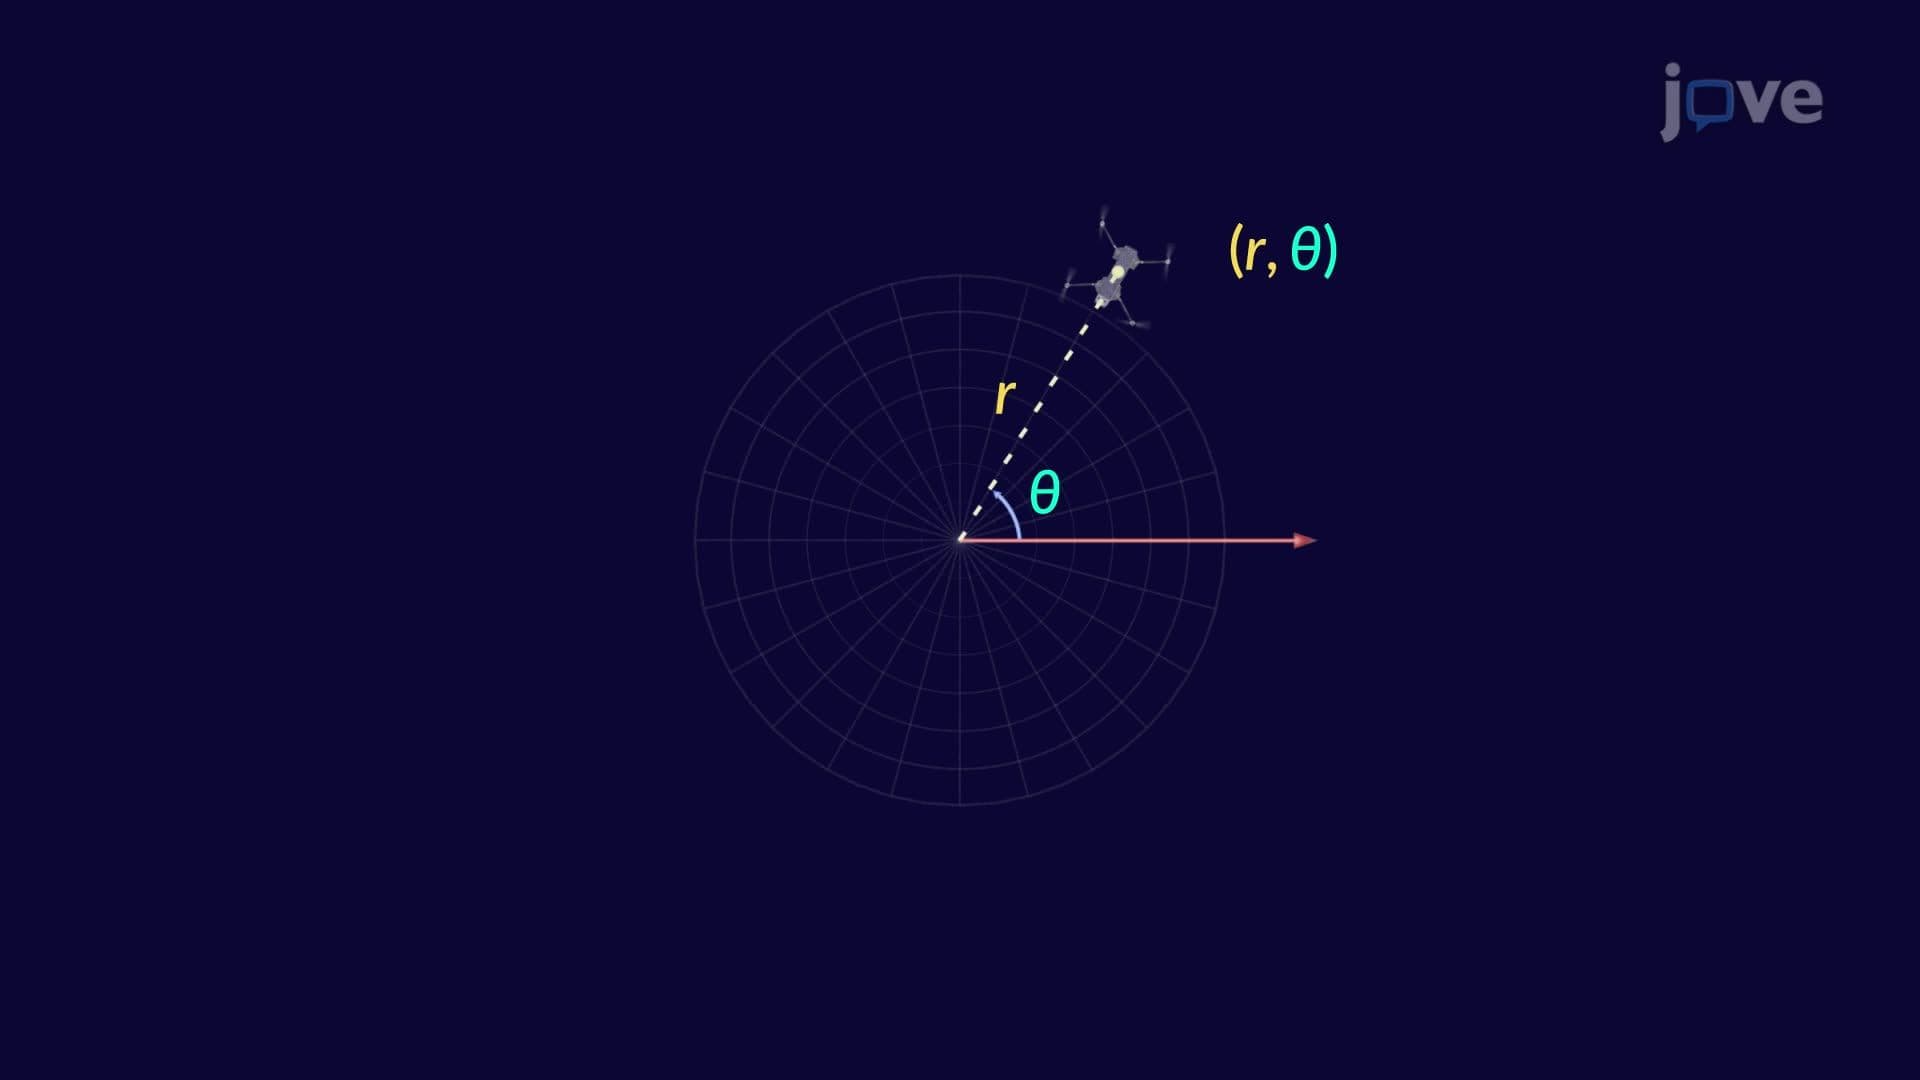
Graphs of polar equations represent a fundamental shift from traditional Cartesian thinking. Instead of using horizontal and vertical distances (x, y), polar coordinates describe point locations using a distance from a central point (the pole) and an angle measured from a reference direction (the polar axis). This system proves exceptionally useful when dealing with circular, rotational, or radial patterns that occur frequently in physics, engineering, and astronomy.
The simplest polar graphs emerge from constant values. When r equals a constant (r = 5), the result is a perfect circle with radius 5 centered at the pole. This represents all points maintaining the same distance from the origin regardless of angle. Conversely, when θ equals a constant (θ = π/4), the graph produces a straight line extending from the pole at a 45-degree angle.
More complex relationships yield fascinating patterns. The equation r = a cos(θ) creates a circle with diameter 'a' that passes through the pole. When graphing r = 2 cos(θ), students discover a circle with diameter 2, positioned so the pole lies on its circumference. These relationships frequently appear on AP Calculus BC exams and college-level Calculus II courses.
Trigonometric polar equations generate stunning geometric patterns. Rose curves (r = a cos(nθ)) produce petal-like shapes, where 'n' determines the number of petals. Limaçons (r = a + b cos(θ)) create heart-shaped or looped curves depending on the ratio of constants 'a' and 'b'. These patterns aren't merely mathematical curiosities-they model real phenomena like flower petal arrangements and acoustic wave patterns.
Understanding graphs of polar equations proves essential for students pursuing STEM careers. Aerospace engineers use polar coordinates to calculate spacecraft trajectories and satellite orbits. The Hubble Space Telescope's positioning system relies on polar coordinate calculations for precise astronomical observations. Weather meteorologists employ polar graphs to track hurricane spiral patterns and tornado formations across the United States.
In college physics courses, students encounter polar equations when studying oscillatory motion, electromagnetic fields, and quantum mechanical wave functions. SAT Subject Test Math Level 2 occasionally includes polar coordinate problems, making this concept valuable for college-bound students. Engineering programs at universities like MIT and Stanford integrate polar coordinate systems into coursework covering robotics, antenna design, and signal processing applications.
Related Micro-courses