Loading subject page…

- Pharmacology
- Pharmacodynamics
- Dose-Response Relationship: Overview
Micro-course: Pharmacodynamics
96,701 views
Learn key concepts and earn your certificate.


Dose-Response Relationship: Overview

00:00
01:03
Video Summary: What Is Dose Response Relationship
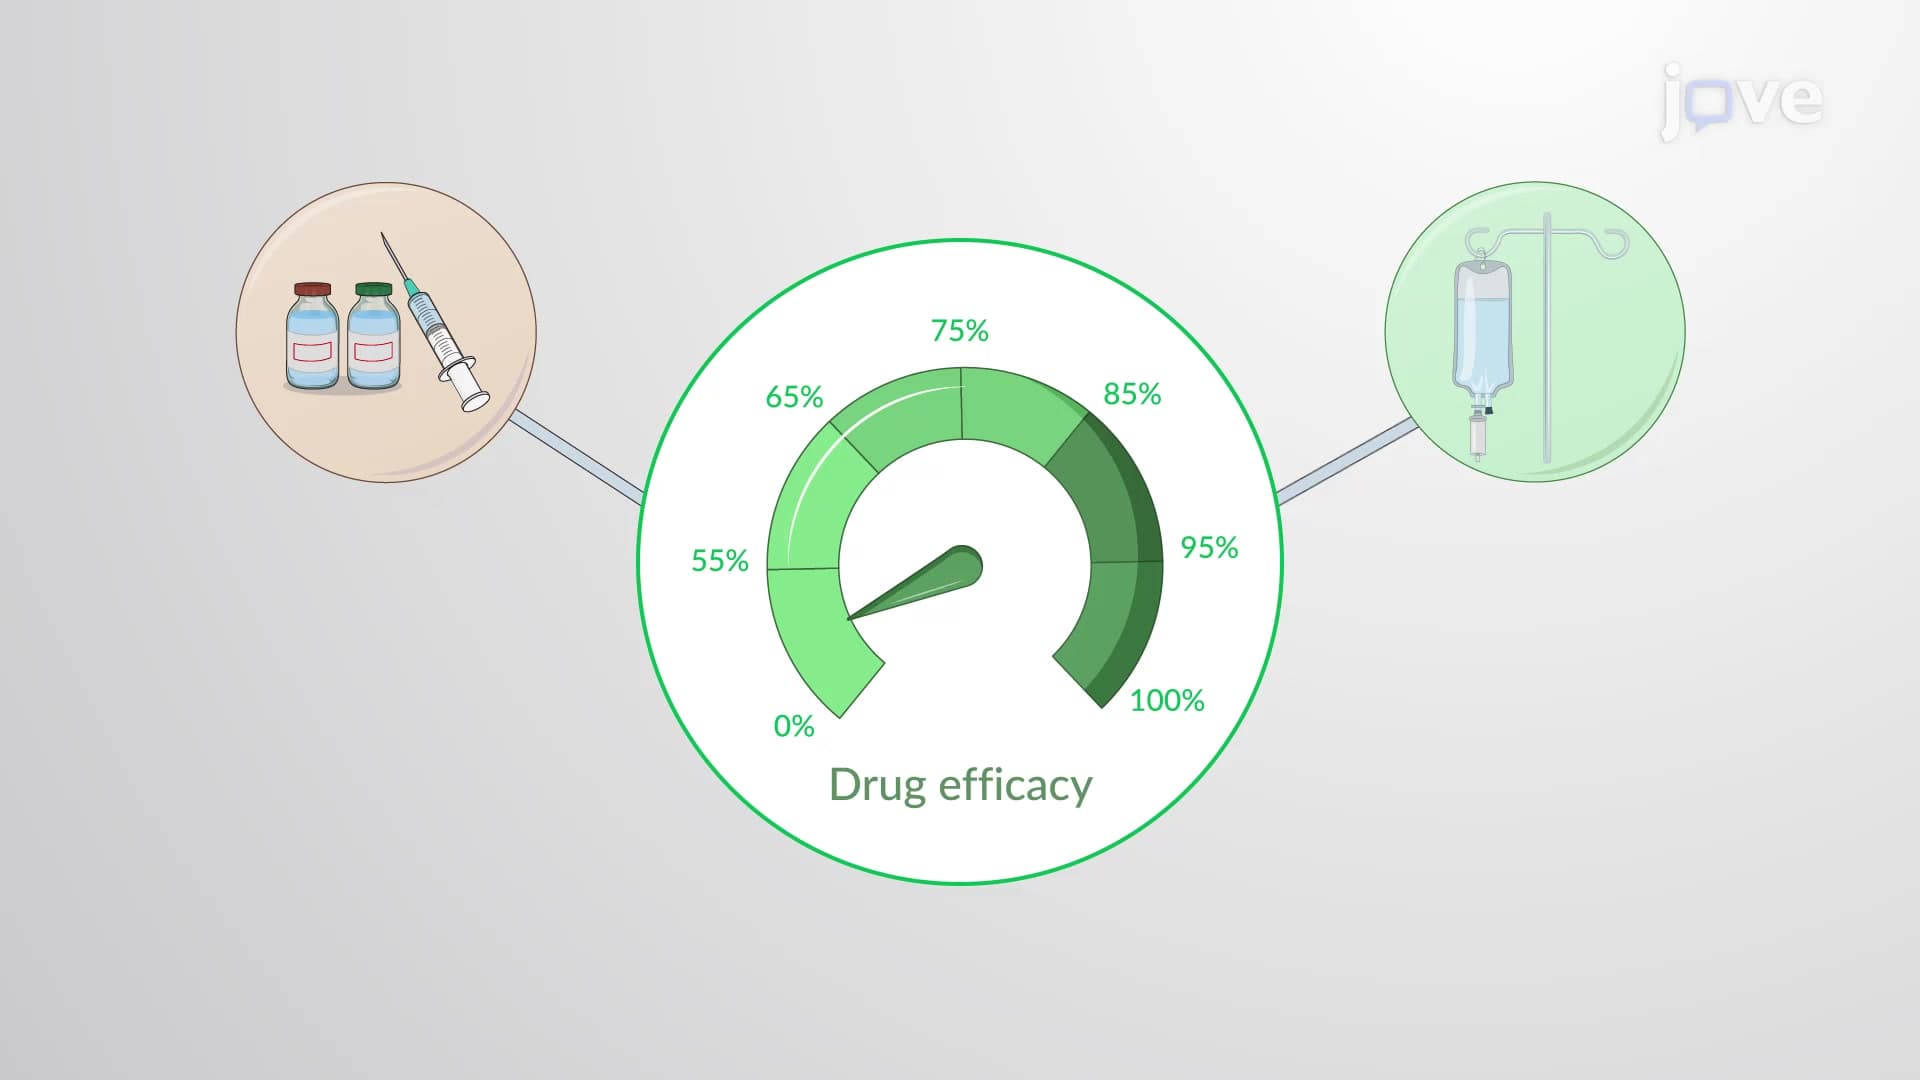
Ever wonder why taking two aspirin tablets relieves your headache better than one? The dose response relationship explains this fundamental principle of pharmacology-as drug concentration increases, so does the biological effect. In clinical studies at Johns Hopkins Hospital, researchers regularly use dose response curves to determine optimal medication dosages for conditions ranging from hypertension to cancer treatment. Understanding What is Dose Response Relationship helps predict how our bodies react to different drug concentrations. Watch the full video on JoVE Coach to master this concept with expert-led visuals and step-by-step explanations.
- Understand What is Dose Response Relationship and how drug concentration directly affects biological responses in human physiology
- Identify the key components of graded dose response curves, including EC50 values for potency and Emax values for efficacy
- Analyze how receptor saturation determines the maximum therapeutic effect achievable with any given medication
- Compare linear versus semi-logarithmic plotting methods for visualizing dose response relationships in pharmacological studies
- Evaluate drug potency and efficacy using standardized dose response curve parameters in clinical research settings
- Apply dose response principles to predict therapeutic outcomes and potential side effects in real-world medical scenarios
- Recognize the sigmoidal shape characteristic of dose response curves when plotted on semi-logarithmic scales
- Explore how receptor sensitivity and drug concentration work together to produce measurable pharmacologic responses
Understanding What is Dose Response Relationship in Pharmacology
The dose response relationship represents one of pharmacology's most fundamental principles: the mathematical relationship between the amount of drug administered and the magnitude of biological effect produced. This concept forms the foundation for all modern drug development and clinical practice in the United States, from determining safe dosages for pediatric patients at Boston Children's Hospital to establishing chemotherapy protocols at MD Anderson Cancer Center.
Molecular Mechanisms Behind Dose Response
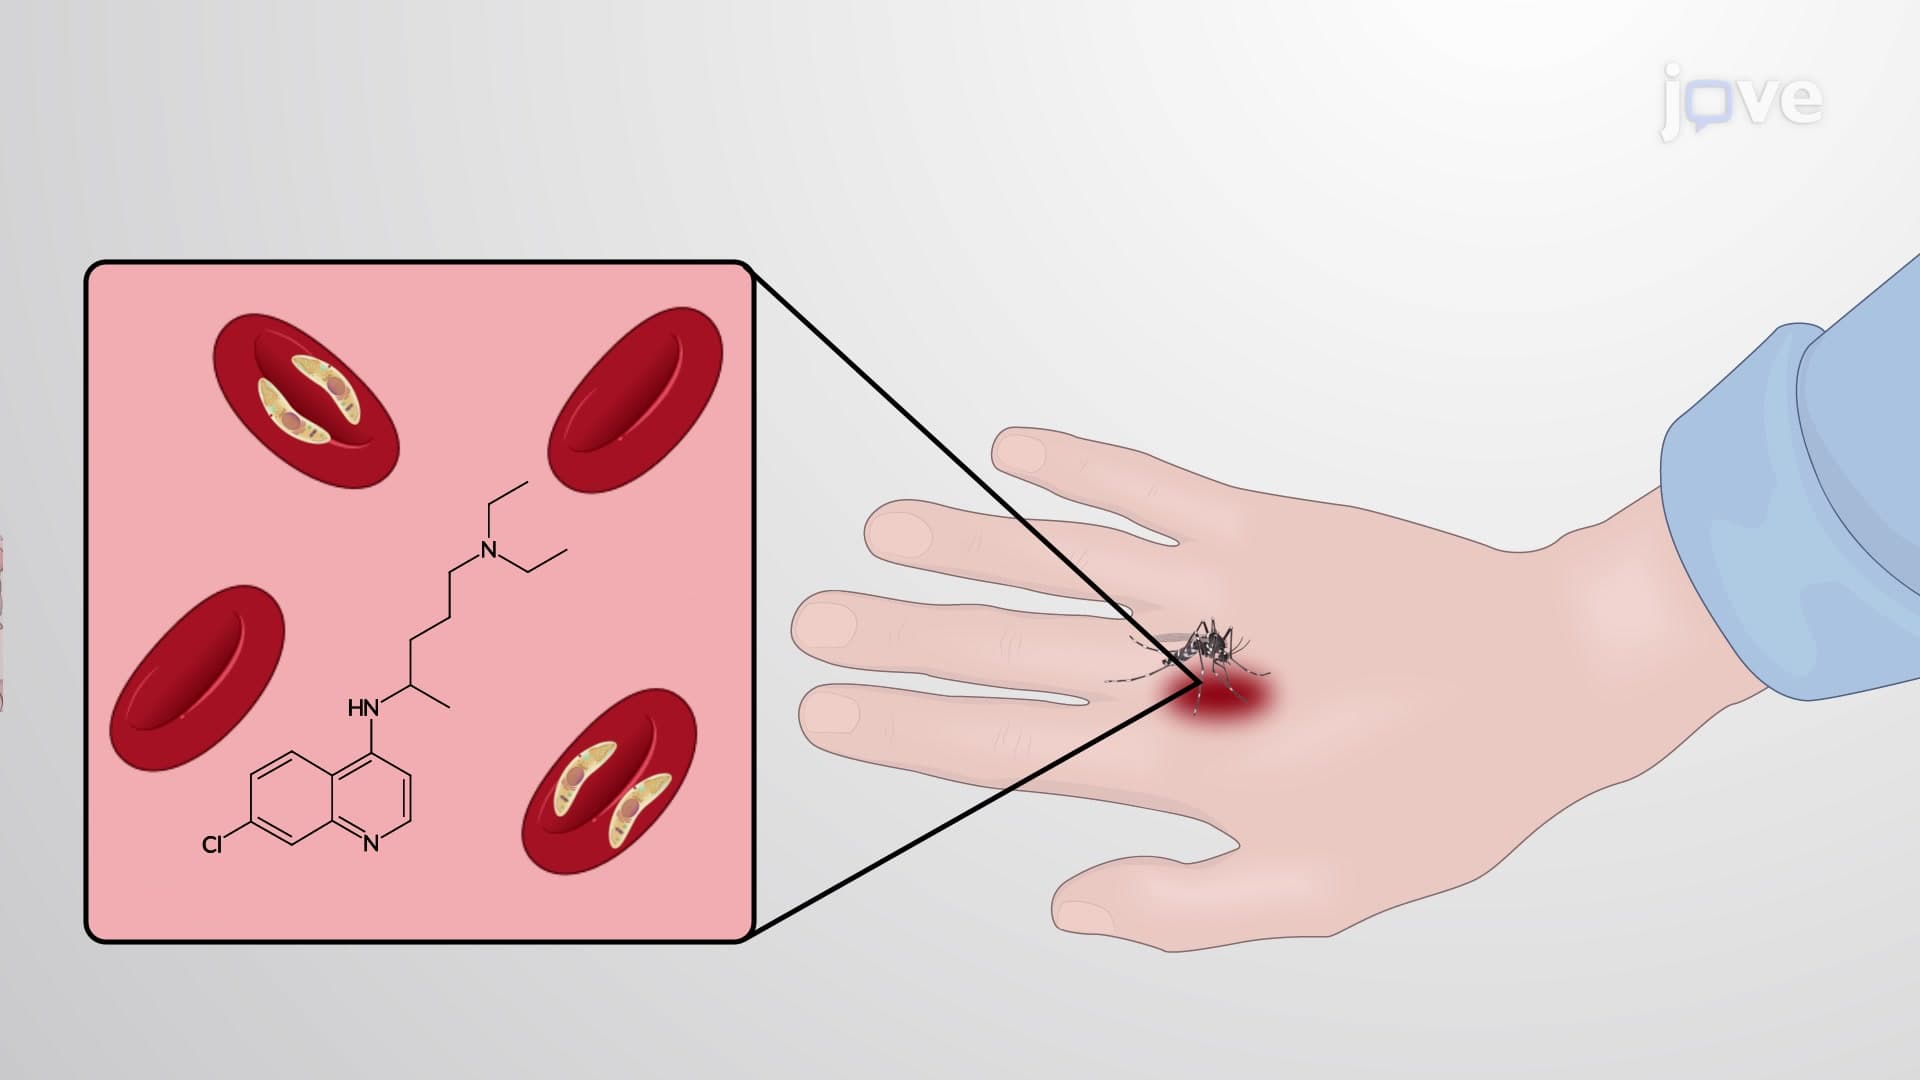
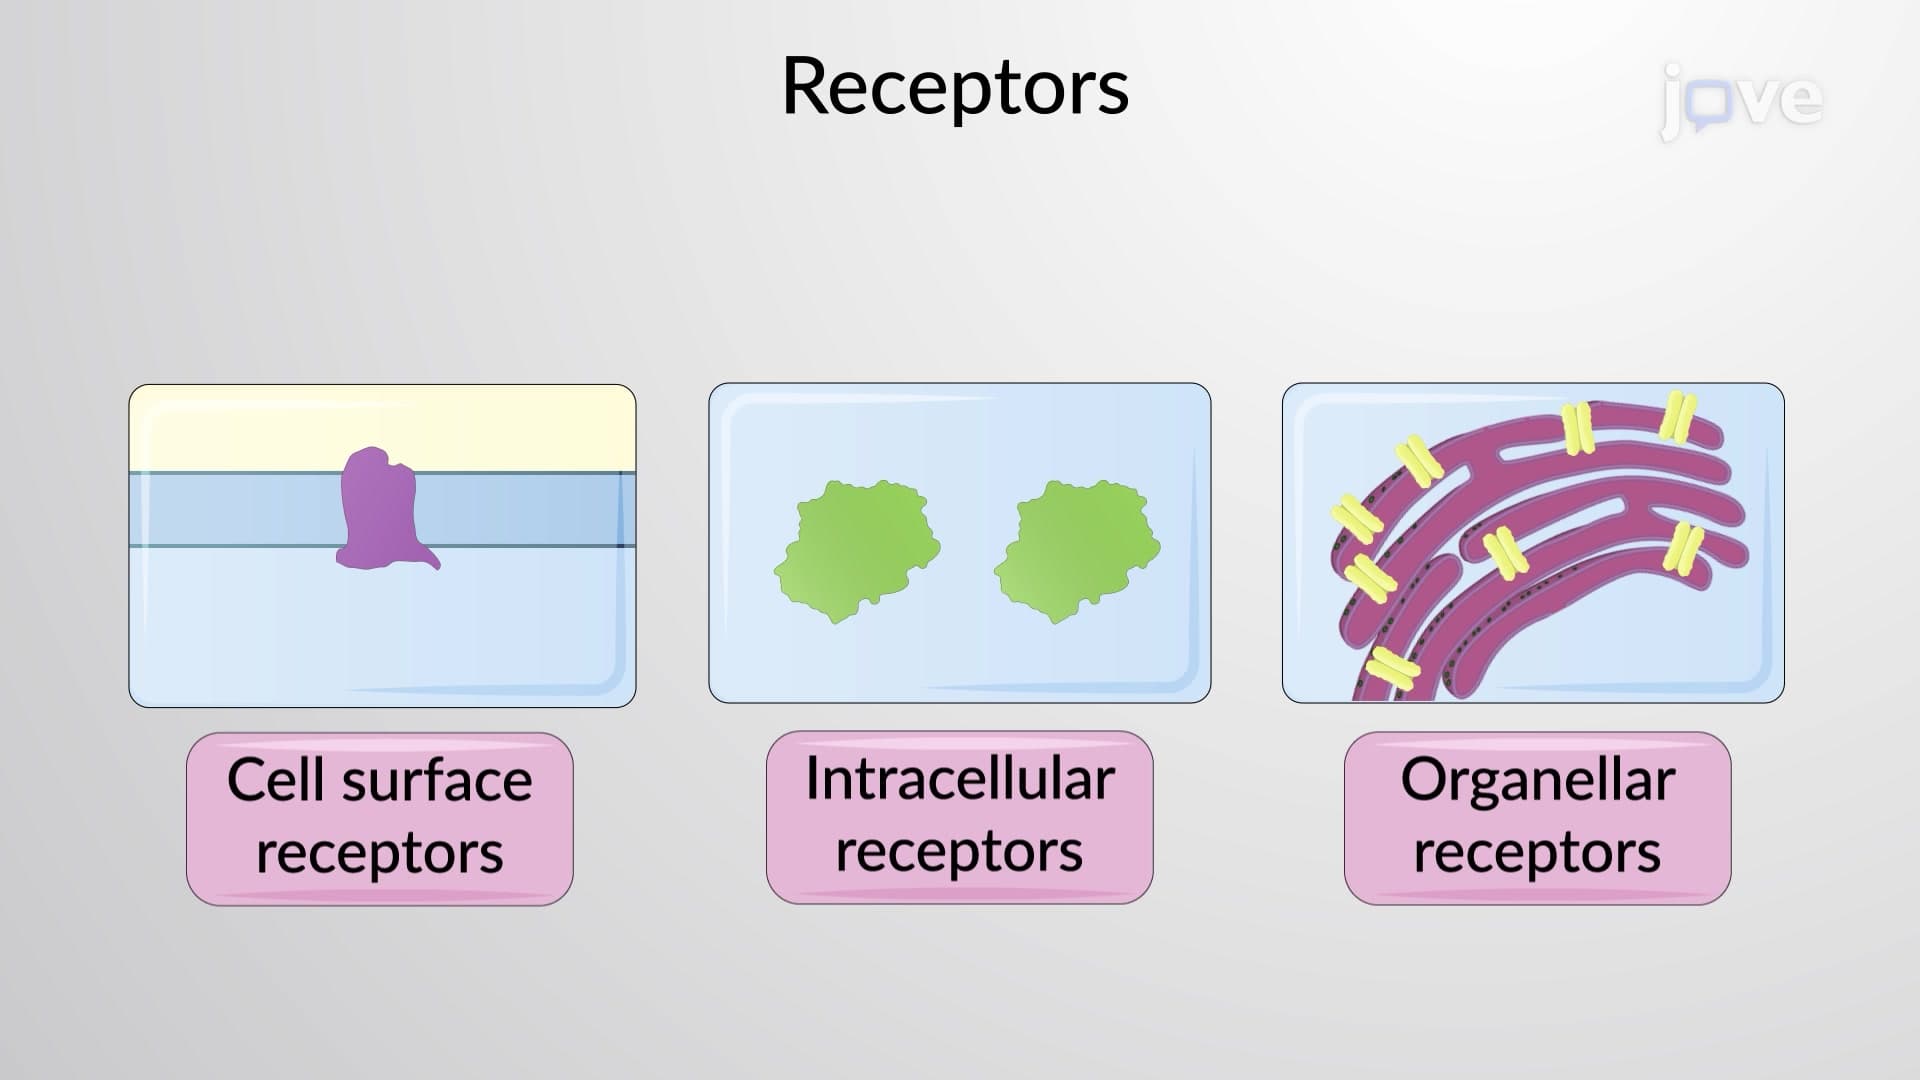
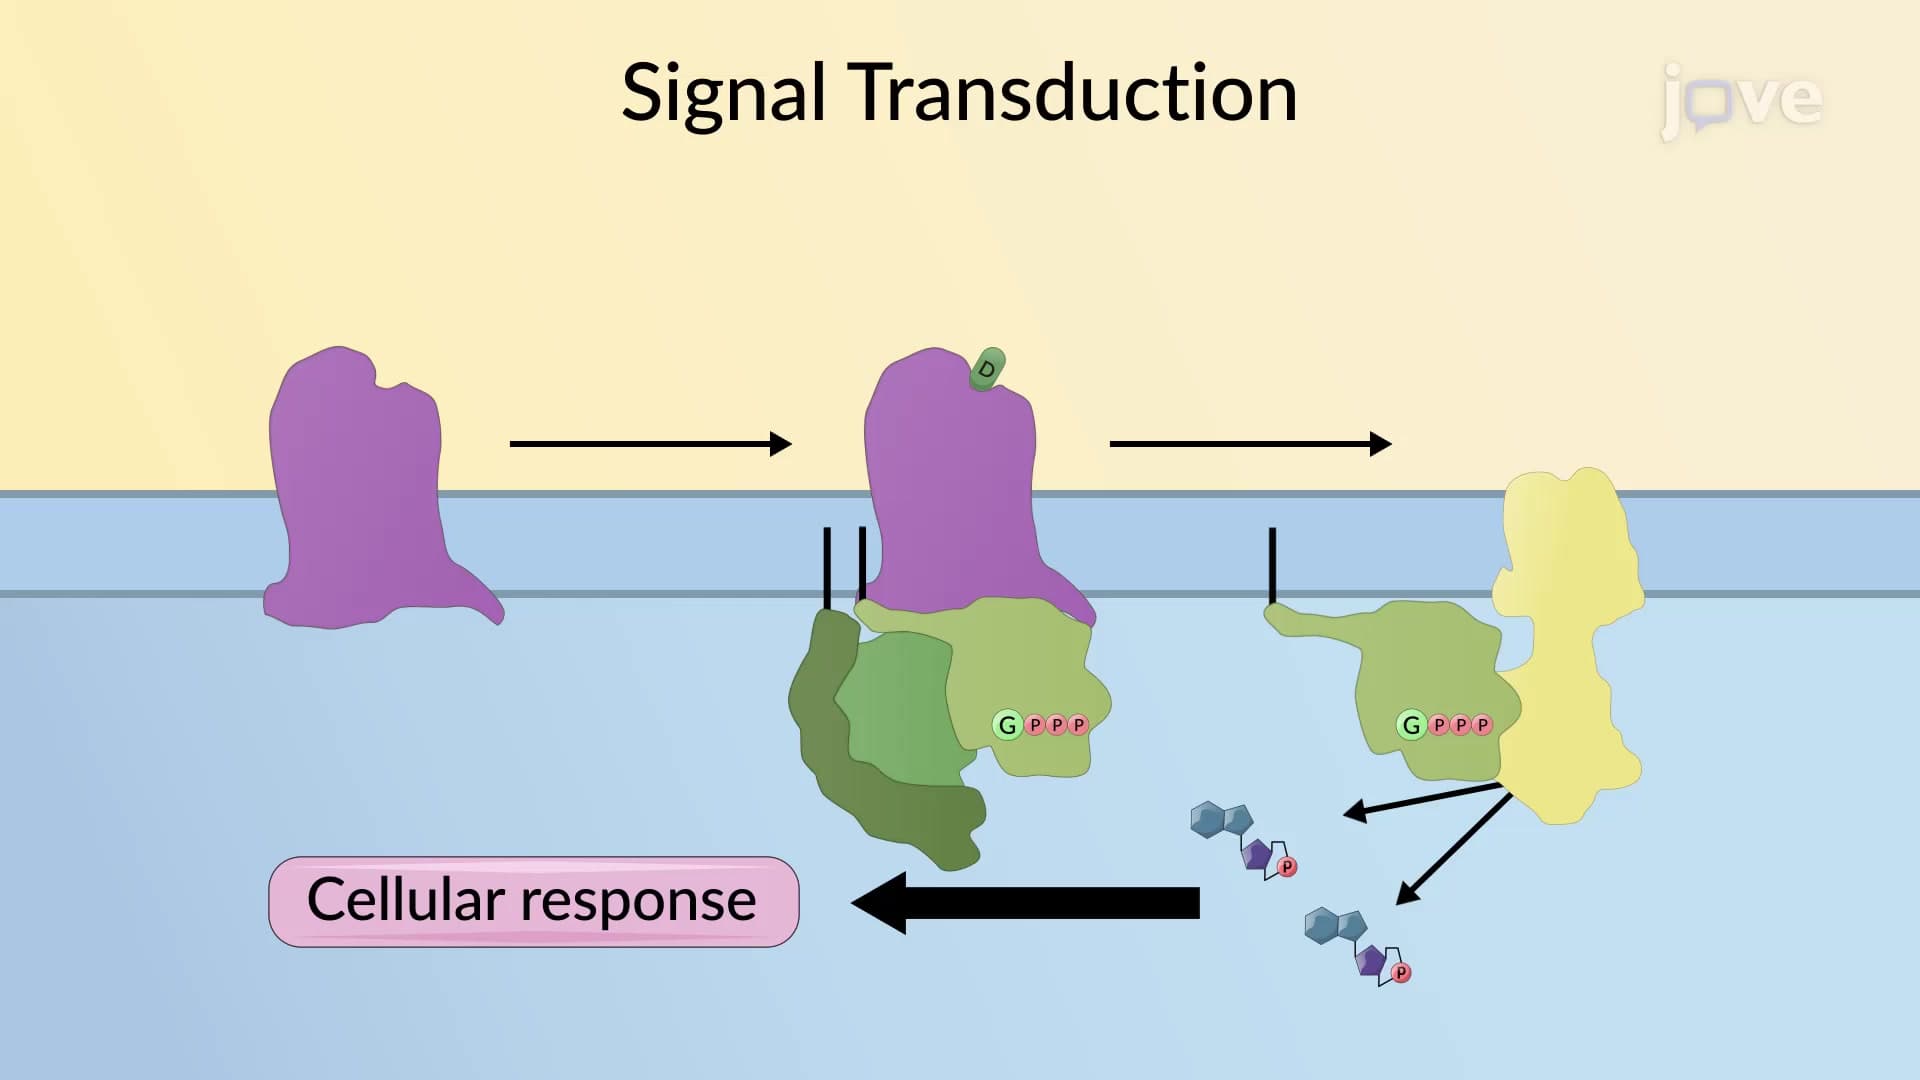
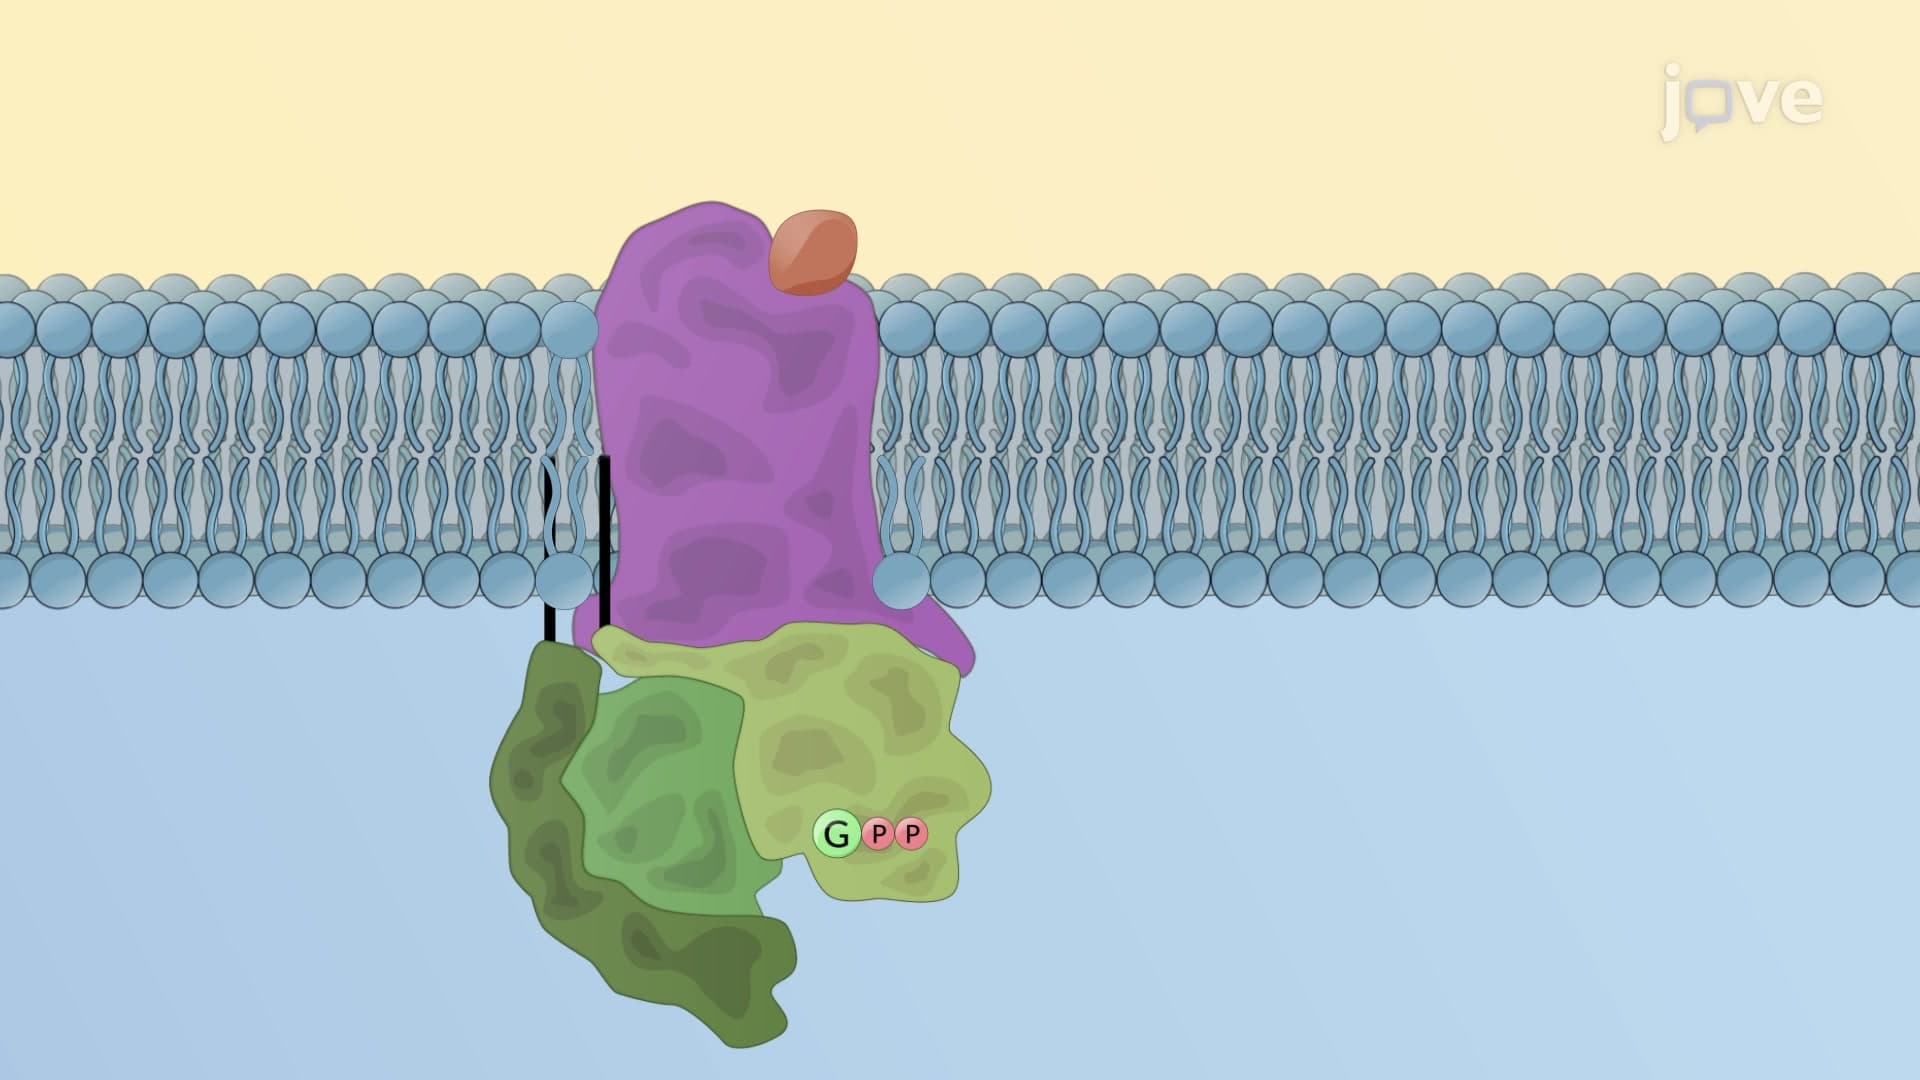
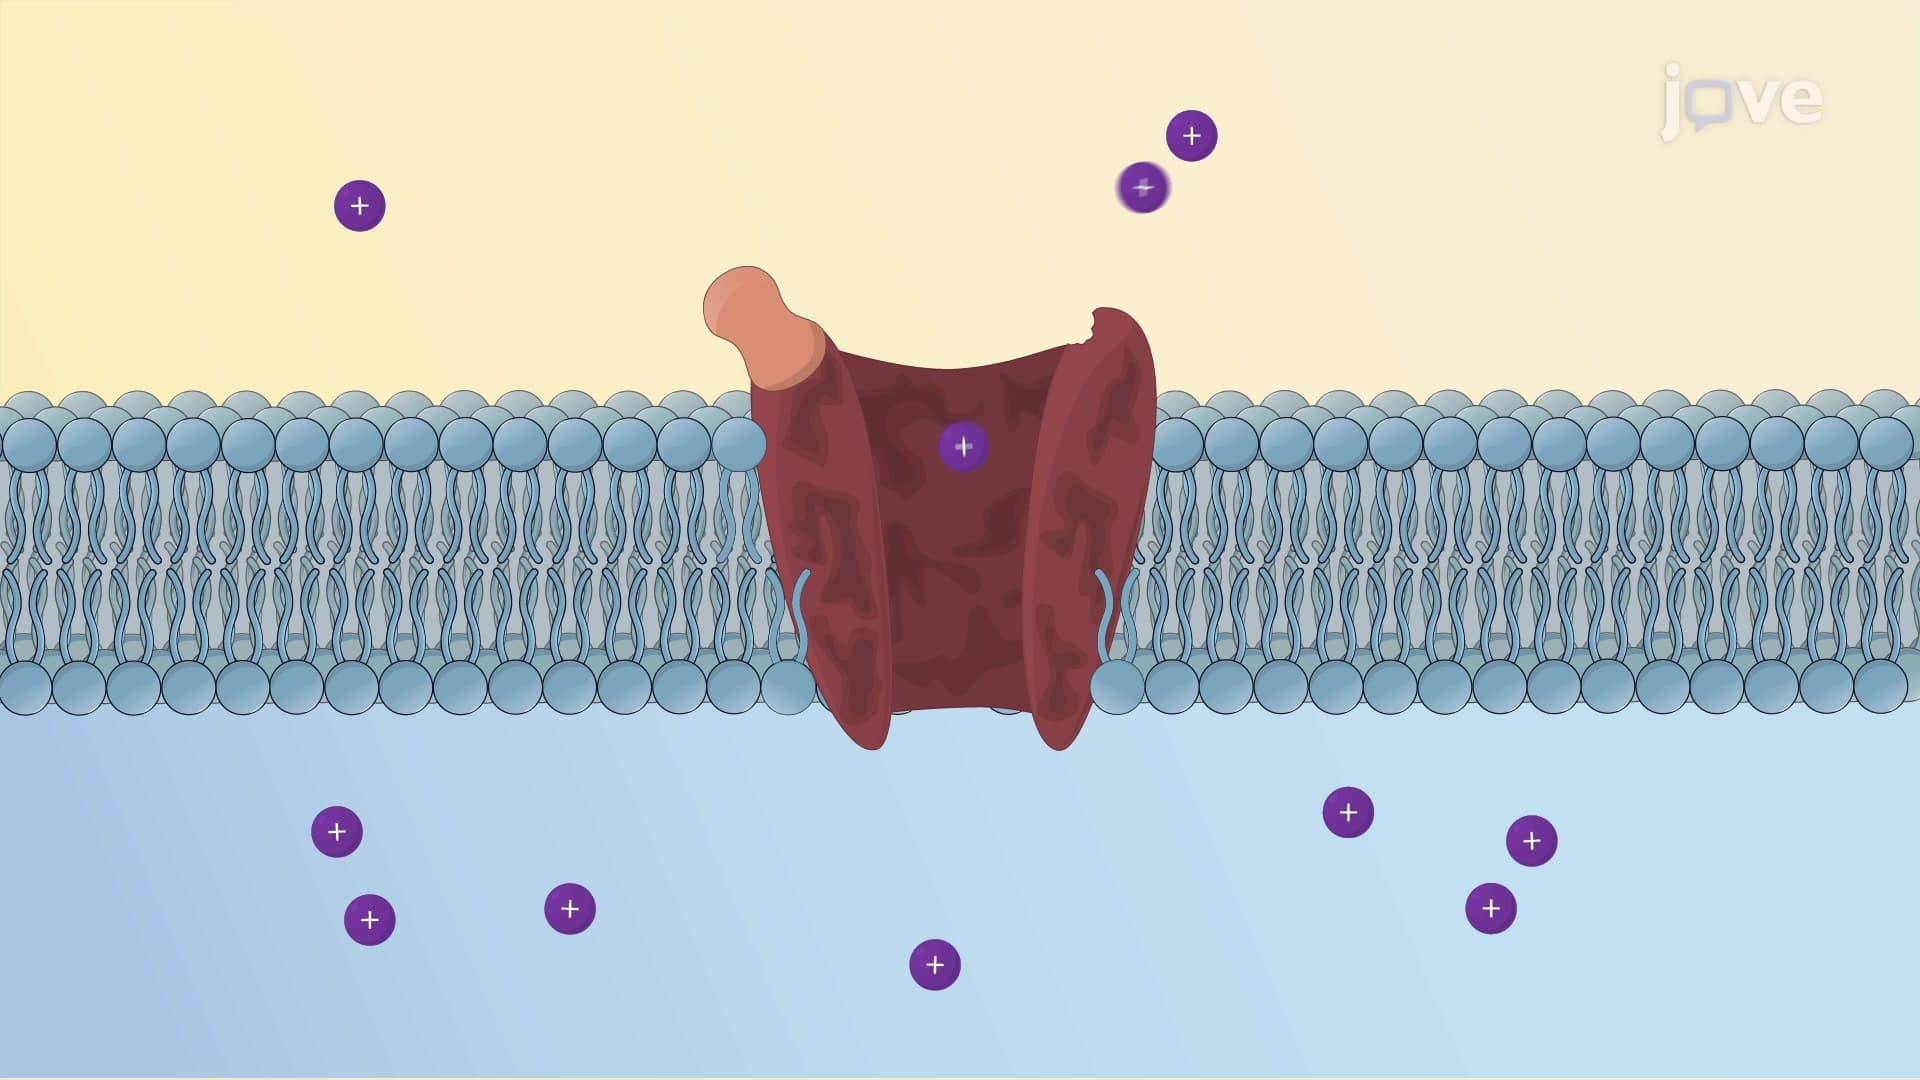
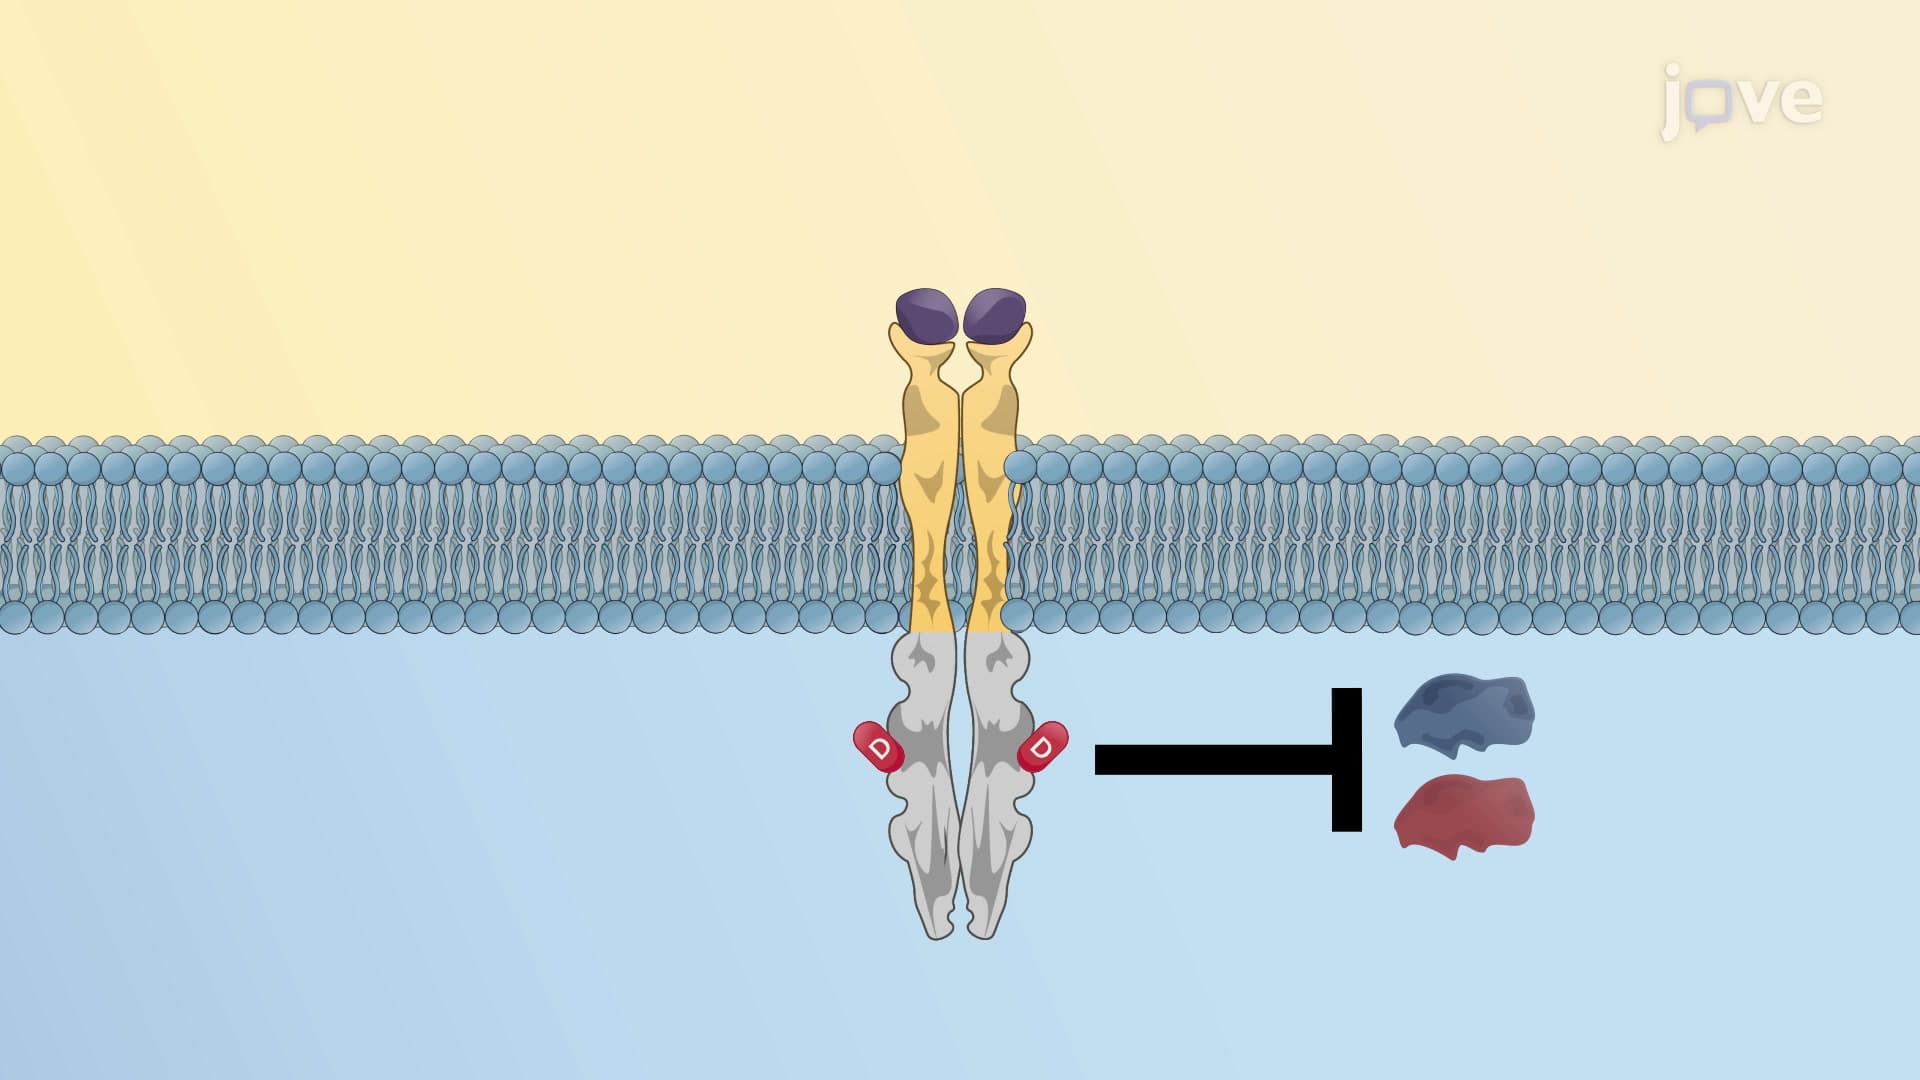
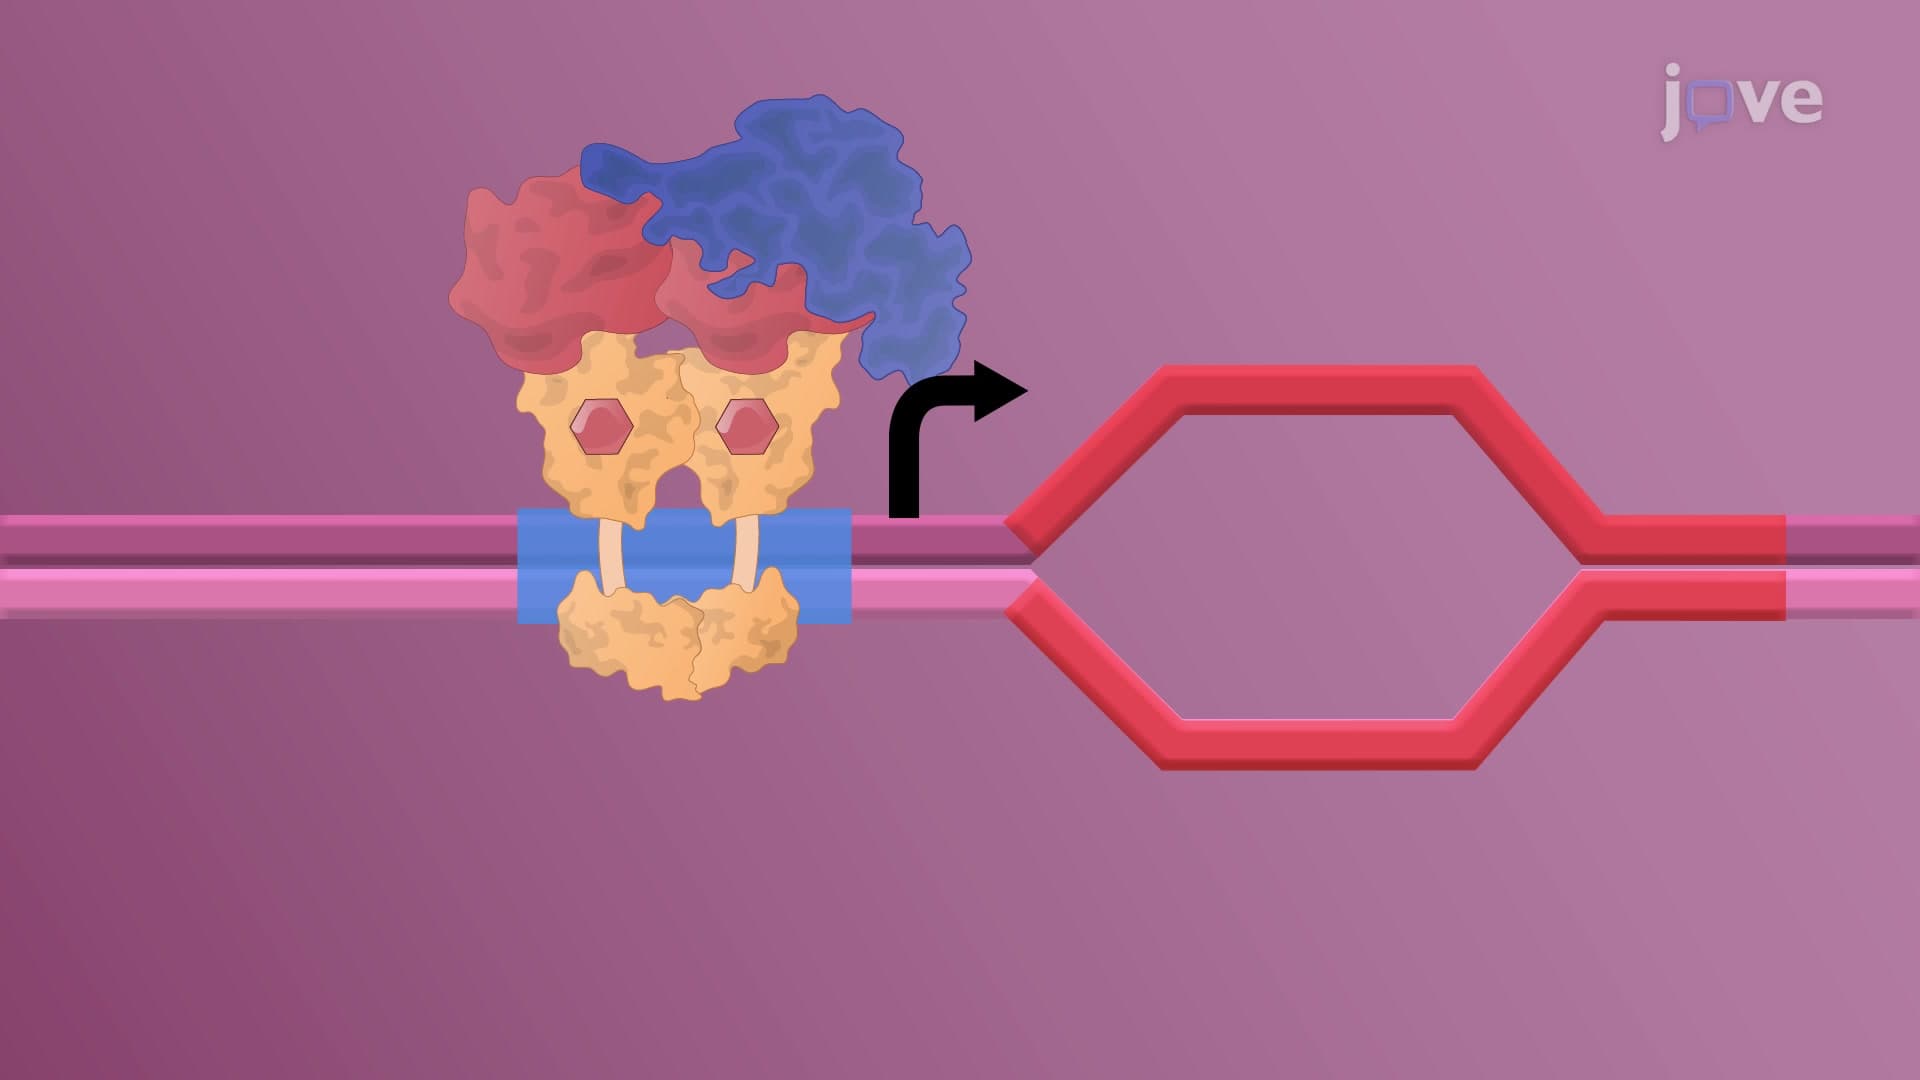
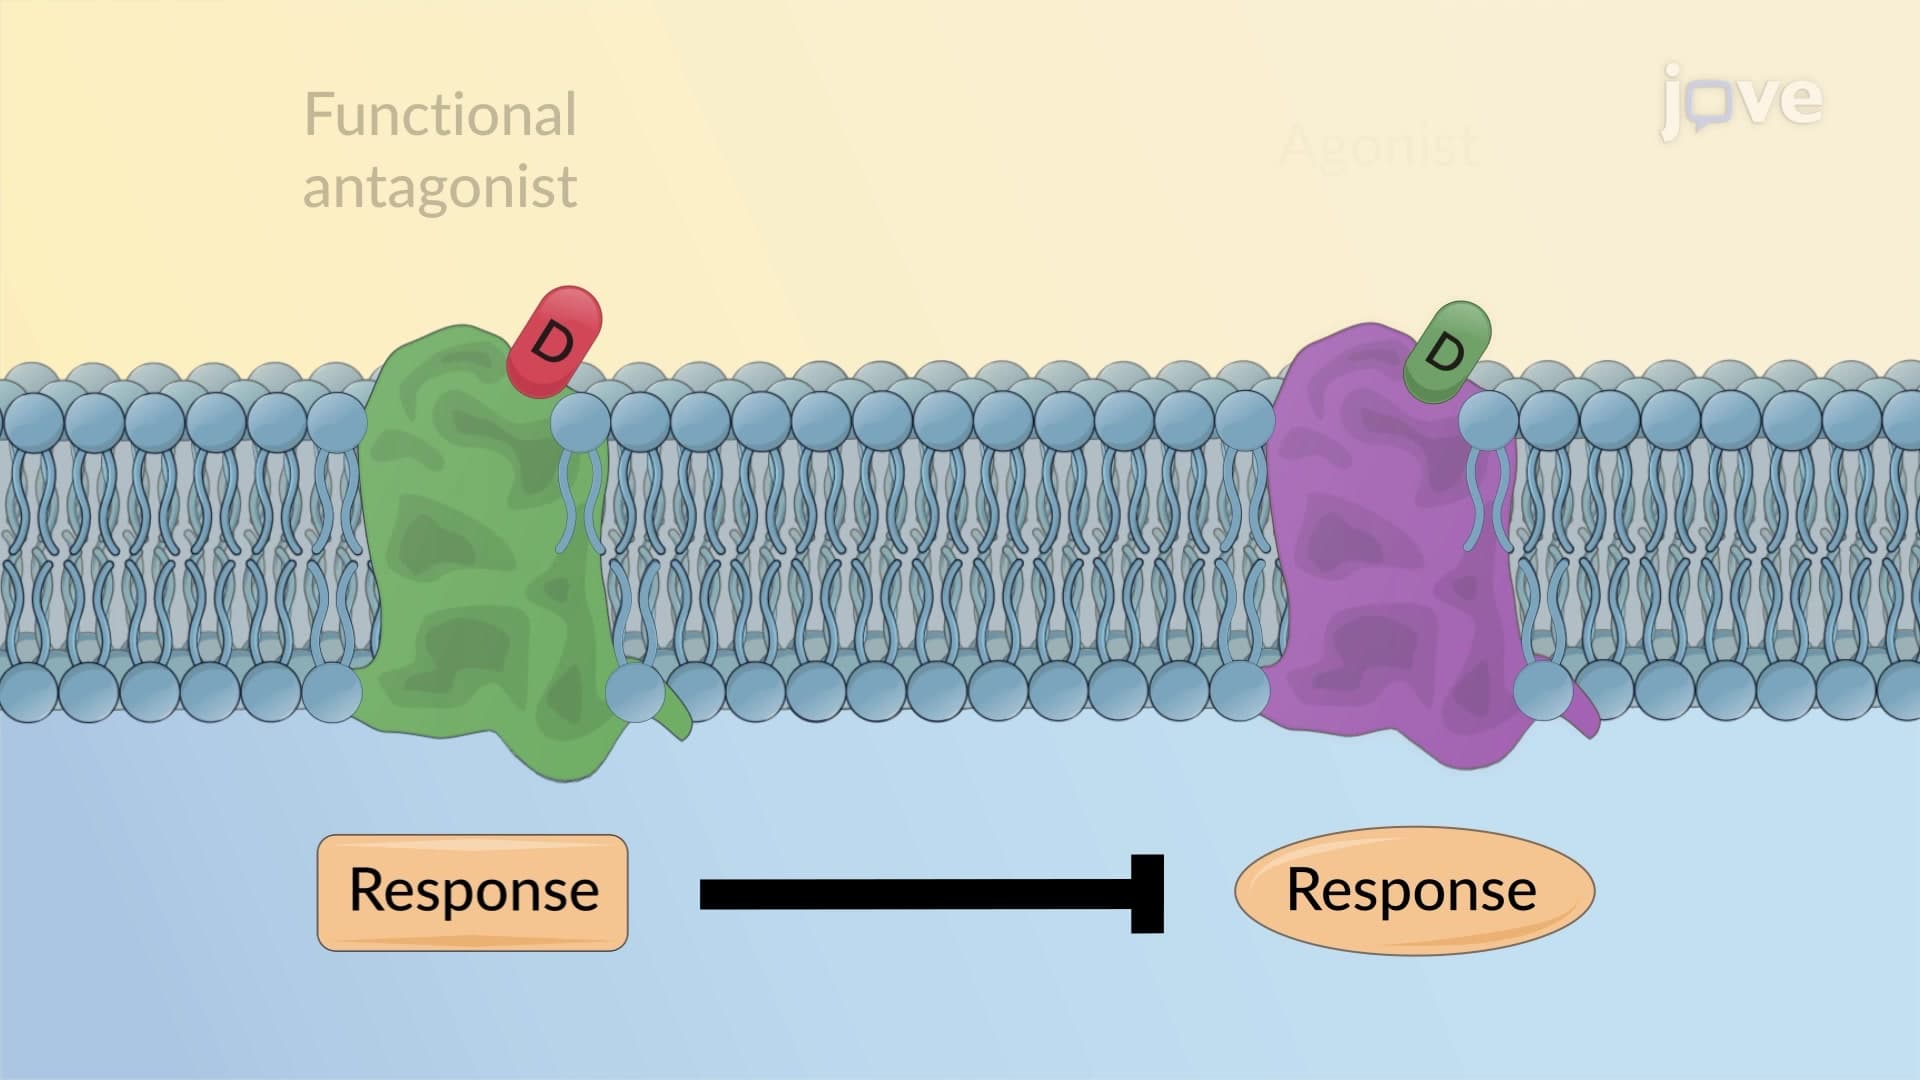
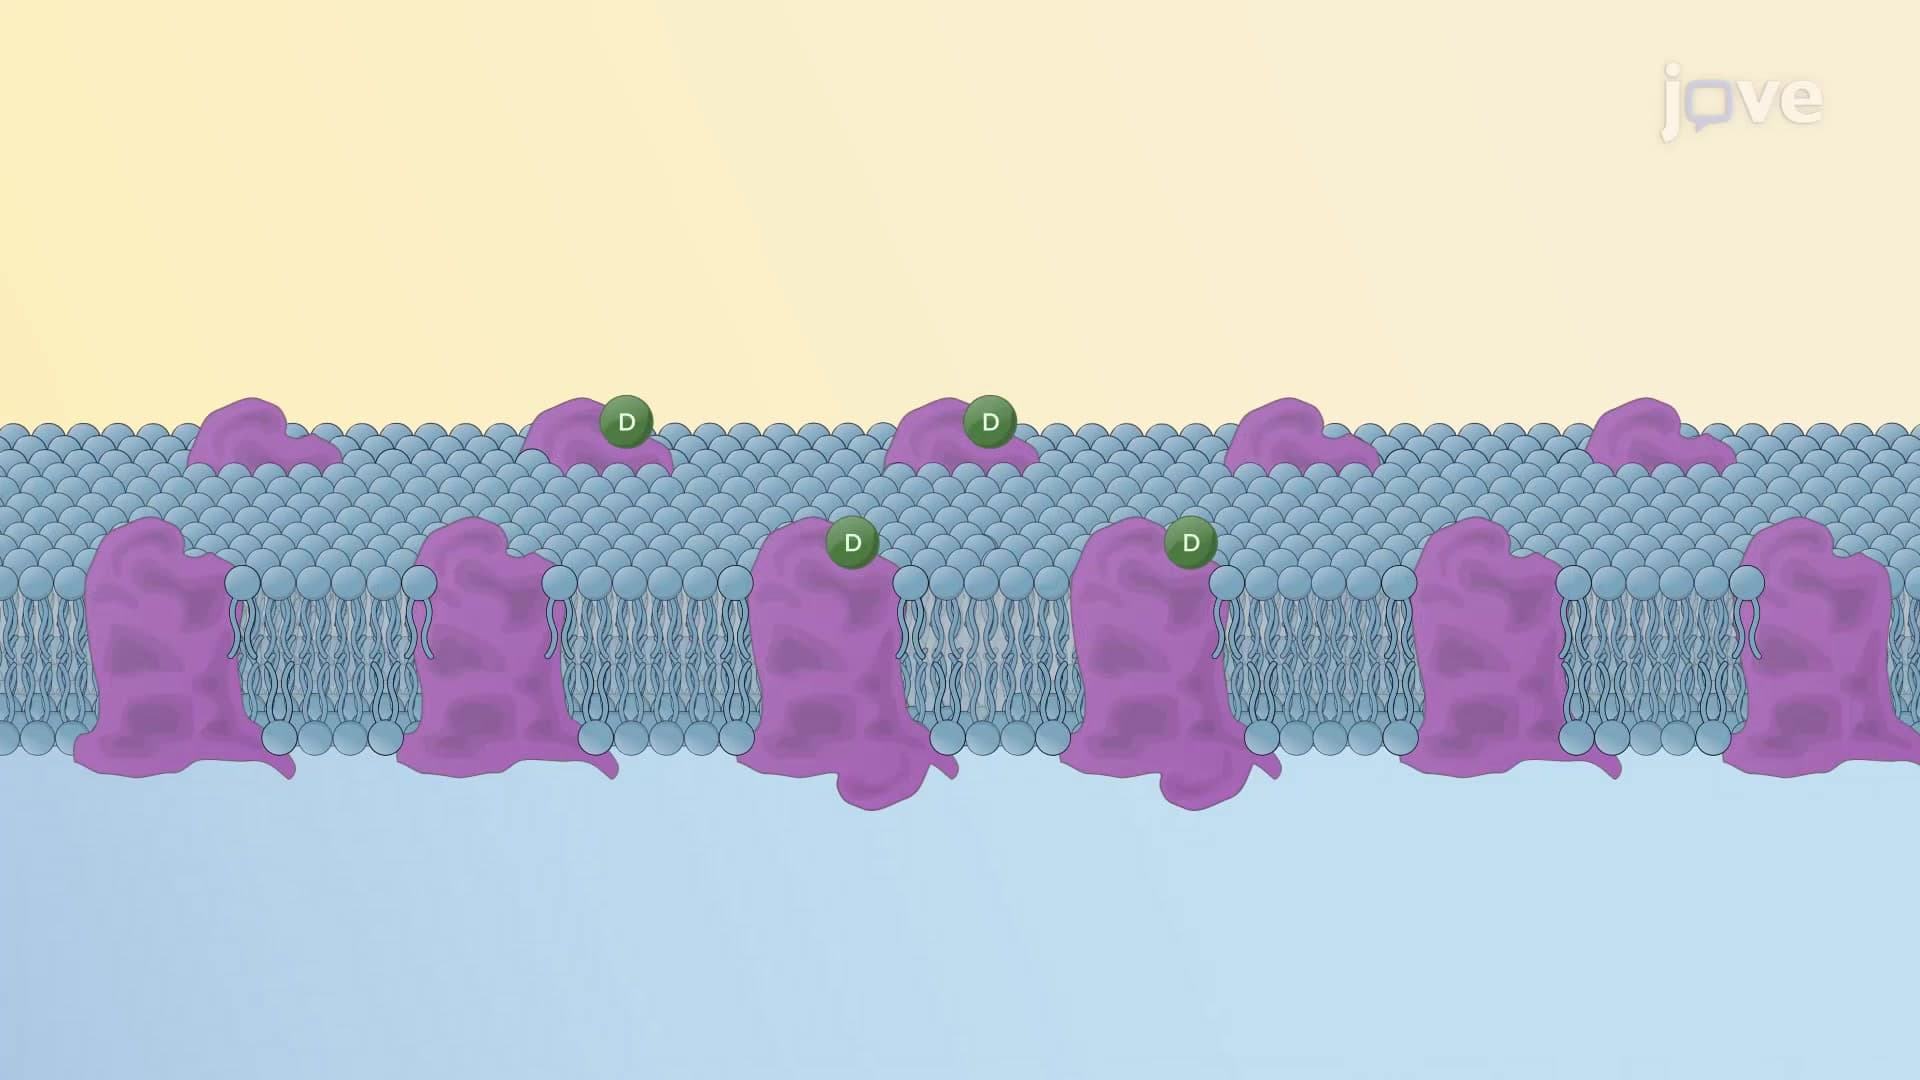
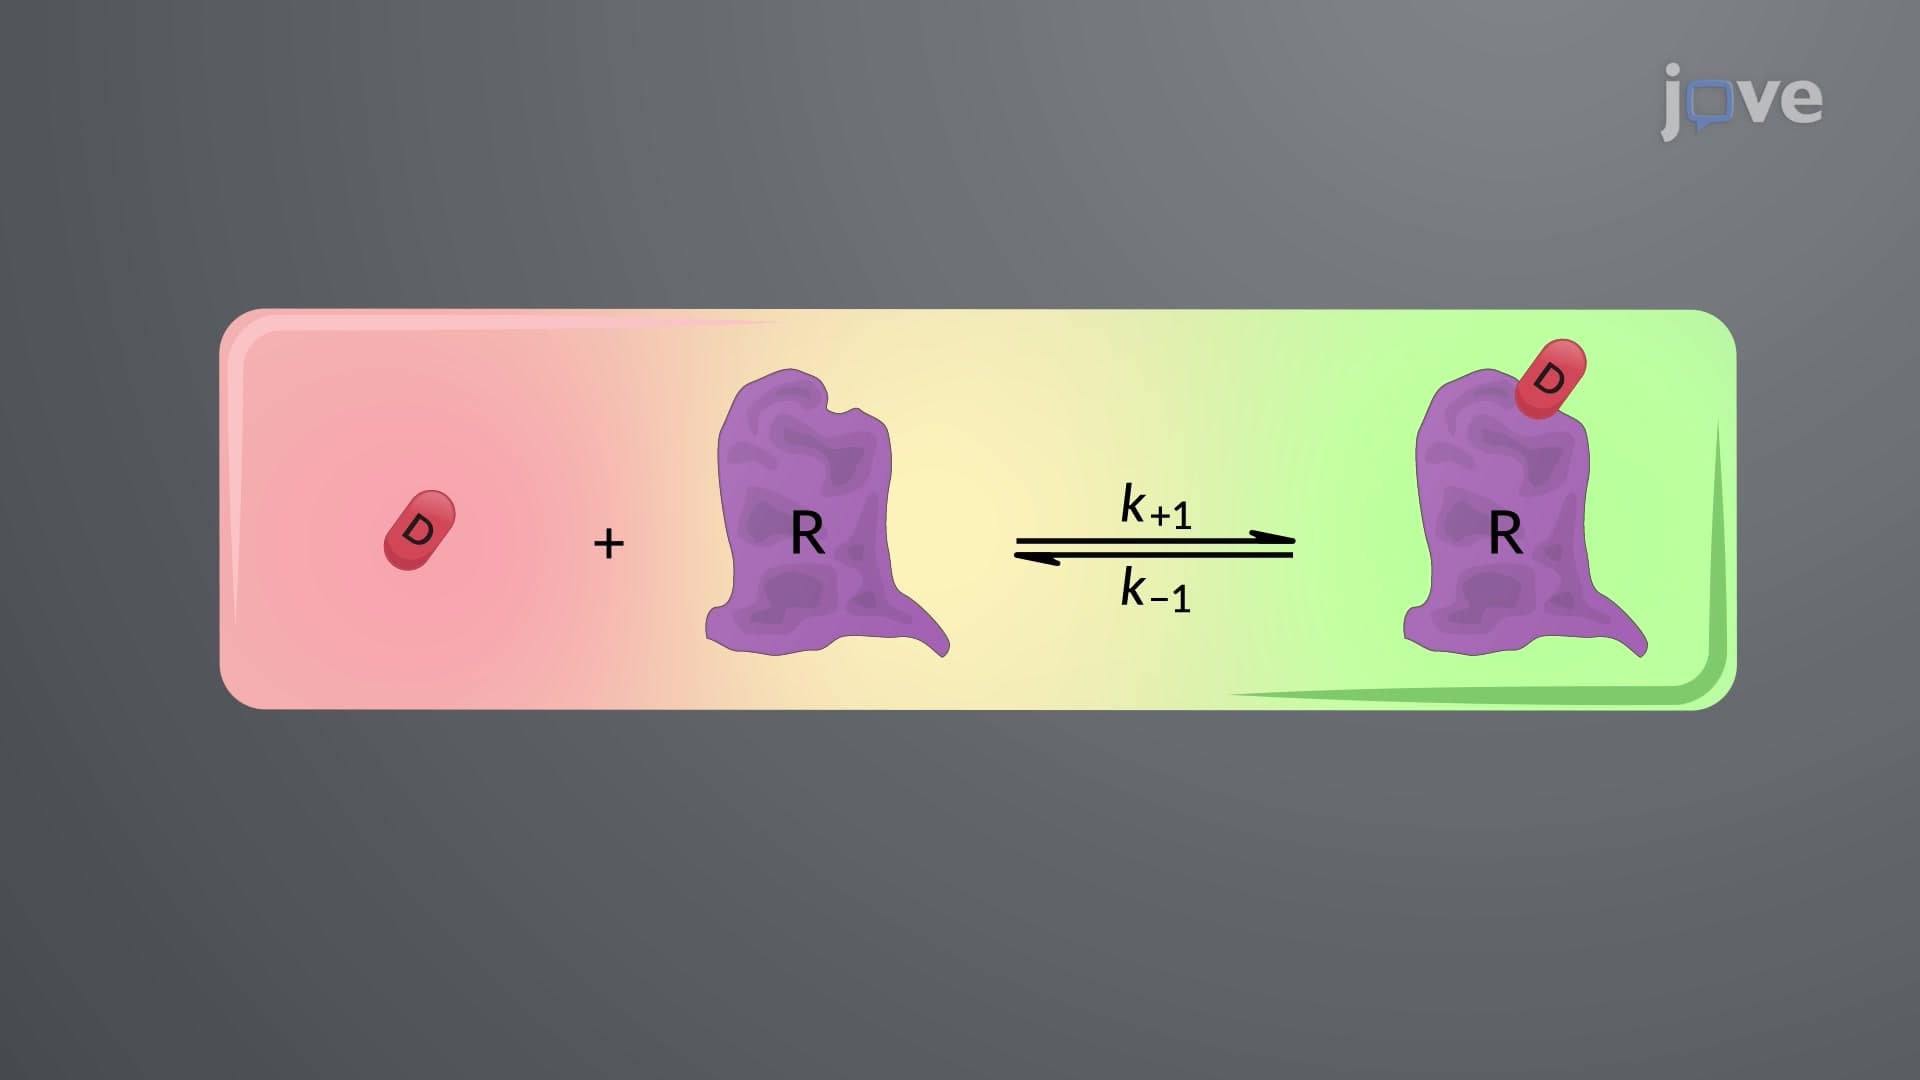
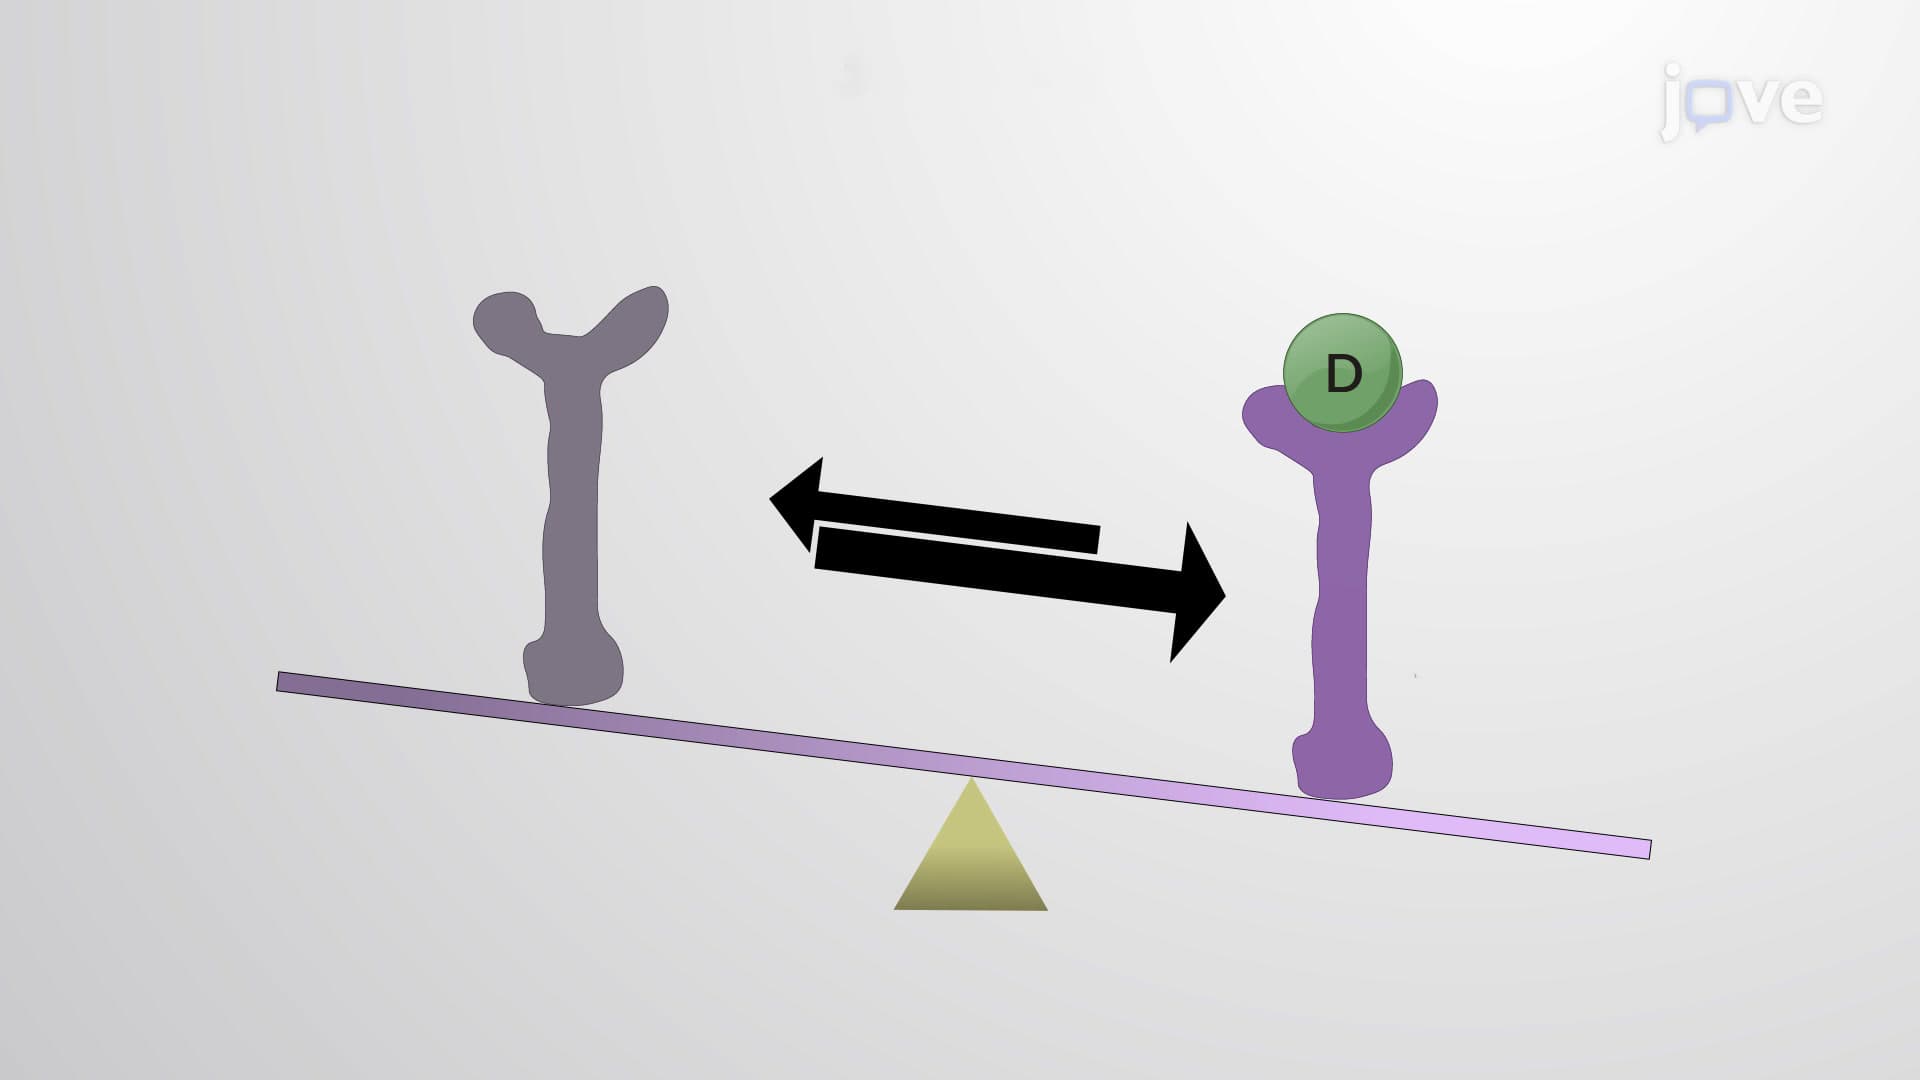
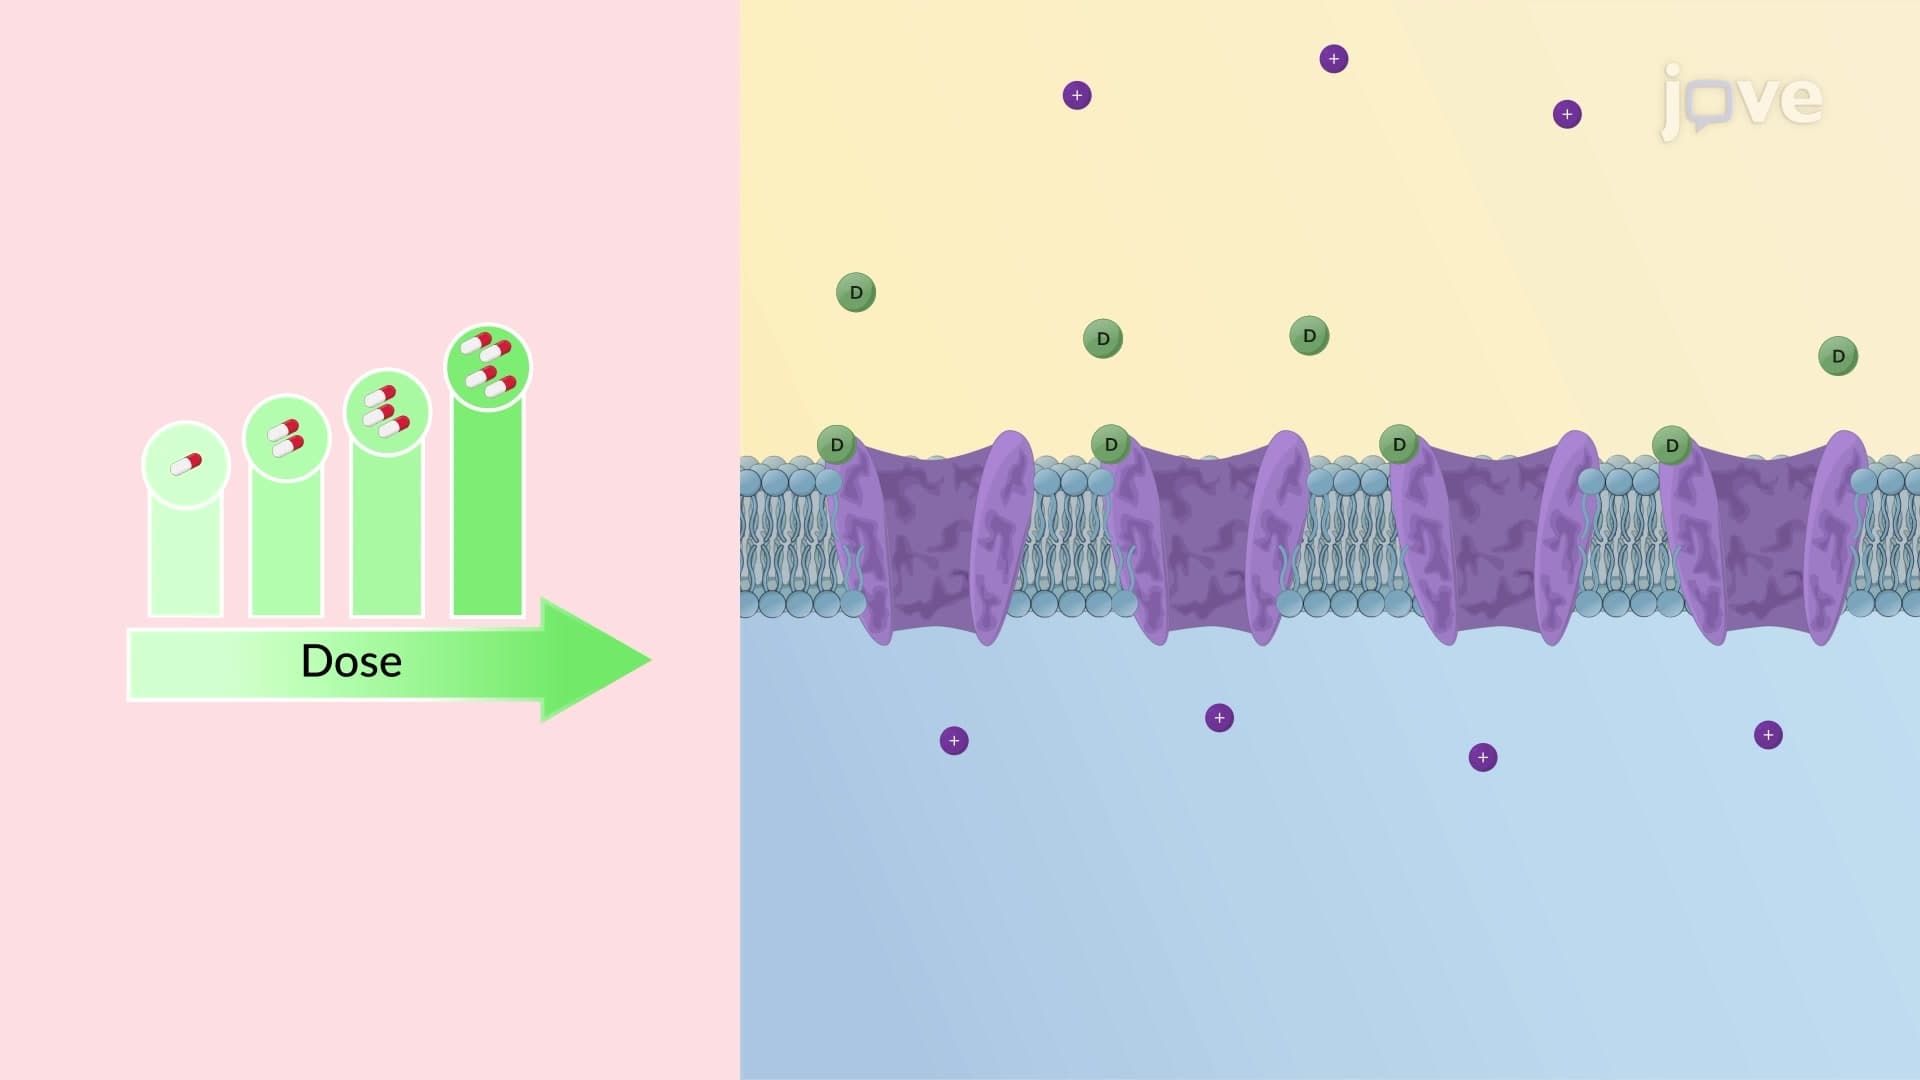
At the cellular level, drugs function as agonists that bind to specific receptor proteins, forming drug-receptor complexes. These complexes trigger biochemical cascades that ultimately produce observable therapeutic effects. The strength of response directly correlates with the fraction of receptors occupied-a principle that explains why doubling your allergy medication dose often provides significantly better symptom relief.
The mathematical relationship follows the law of mass action, where response intensity depends on both drug concentration at the target site and receptor affinity. When you take ibuprofen for inflammation, the drug molecules compete for binding sites on cyclooxygenase enzymes. Higher concentrations mean more binding events, translating to greater anti-inflammatory effects until receptor saturation occurs.
Interpreting Dose Response Curves for Clinical Applications
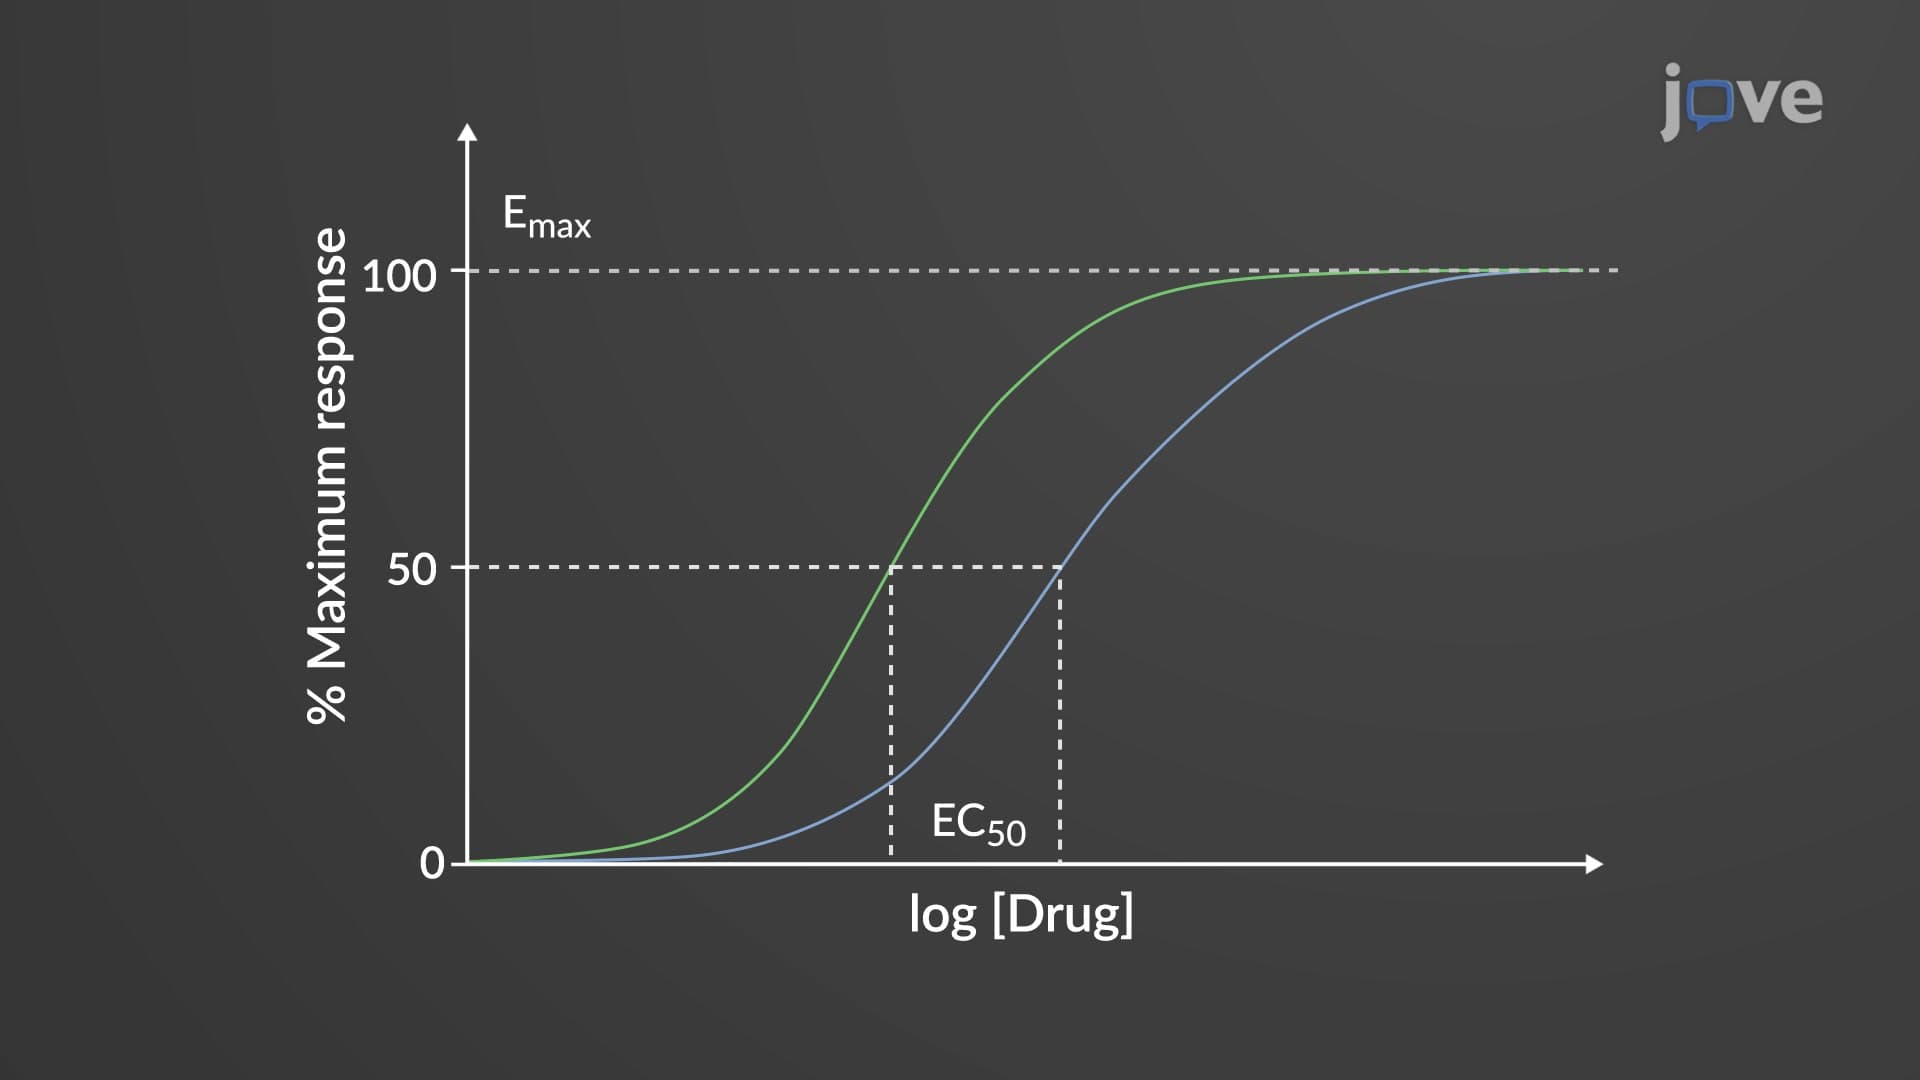
Graded dose response curves visually represent this relationship, typically displaying a hyperbolic shape when plotted on linear scales. However, pharmacologists prefer semi-logarithmic plotting because it transforms the hyperbolic curve into a characteristic S-shaped (sigmoidal) curve, making it easier to analyze drug properties.
Two critical parameters define every dose response relationship. The EC50 value represents the drug concentration producing 50% of the maximum response-essentially measuring drug potency. A medication with a lower EC50 is more potent, requiring smaller doses to achieve the same effect. The Emax value indicates maximum achievable response, representing drug efficacy regardless of dose.
Real-World Applications in US Healthcare and Education
Understanding dose response relationships proves essential for students preparing for standardized exams like the MCAT, where pharmacology questions frequently test these concepts. AP Biology students encounter similar principles when studying enzyme kinetics and cellular signaling pathways.
In clinical practice, dose response curves guide critical medical decisions. Emergency room physicians at Mayo Clinic use these principles when administering epinephrine for severe allergic reactions-they know exactly how much drug produces optimal therapeutic effects without causing dangerous side effects. Similarly, anesthesiologists rely on dose response relationships to maintain appropriate sedation levels during surgical procedures, adjusting medication dosages based on patient response patterns.
Frequently Asked Questions
The dose response relationship describes how increasing drug amounts produce stronger biological effects. It's like a volume control-turning it up increases the sound, just as higher drug doses typically increase therapeutic effects. This fundamental pharmacology principle helps doctors determine optimal medication dosages for maximum benefit with minimal side effects.
These exams frequently test dose response concepts through graph interpretation questions and scenario-based problems. Students analyze EC50 values to compare drug potencies, interpret sigmoidal curves, and predict therapeutic outcomes. The MCAT particularly emphasizes clinical applications, while AP Biology focuses more on cellular receptor mechanisms and enzyme kinetics principles.
Potency refers to the drug amount needed to produce a specific effect (measured by EC50), while efficacy represents the maximum possible response (Emax value). A highly potent drug requires smaller doses but may have lower efficacy than a less potent drug requiring larger doses. Both parameters are crucial for clinical decision-making and pharmaceutical development.
Physicians at institutions like Cleveland Clinic use dose response principles daily when prescribing medications. They start with standard doses based on established dose response curves, then adjust based on individual patient responses. This approach optimizes therapeutic benefits while minimizing adverse effects, particularly important for medications with narrow therapeutic windows like warfarin or digoxin.
No advanced chemistry background is required to grasp basic dose response concepts. High school biology and introductory chemistry provide sufficient foundation. The key is understanding that more drug typically means stronger effects until receptors become saturated. Mathematical calculations involve basic algebra and graph interpretation skills taught in standard high school curricula.
Focus on interpreting dose response curves rather than memorizing formulas. Practice identifying EC50 and Emax values from graphs, comparing different drugs' potency and efficacy, and relating curve shapes to underlying biological mechanisms. Create flashcards with real drug examples and their clinical applications to reinforce conceptual understanding.
Semi-logarithmic plotting compresses the wide range of drug concentrations into a more manageable scale, transforming the hyperbolic relationship into a sigmoidal curve. This mathematical transformation makes it easier to identify key parameters like EC50 values and compare different drugs' properties. The S-shape reflects the underlying saturable nature of receptor binding processes.
When all available receptors are occupied by drug molecules, further dose increases cannot produce additional effects-this represents receptor saturation and defines the Emax value. Think of it like parking spaces: once all spots are filled, more cars cannot park regardless of how many arrive. This biological limitation explains why increasing drug doses beyond certain points provides no additional therapeutic benefit.
Consider studying competitive versus non-competitive inhibition, allosteric modulation effects, and pharmacokinetic influences on dose response relationships. Advanced topics include therapeutic drug monitoring, population pharmacokinetics, and personalized medicine approaches that modify standard dose response predictions based on individual patient characteristics and genetic factors.
Related Micro-courses


