Loading video…


 7 Concepts
 38.4K views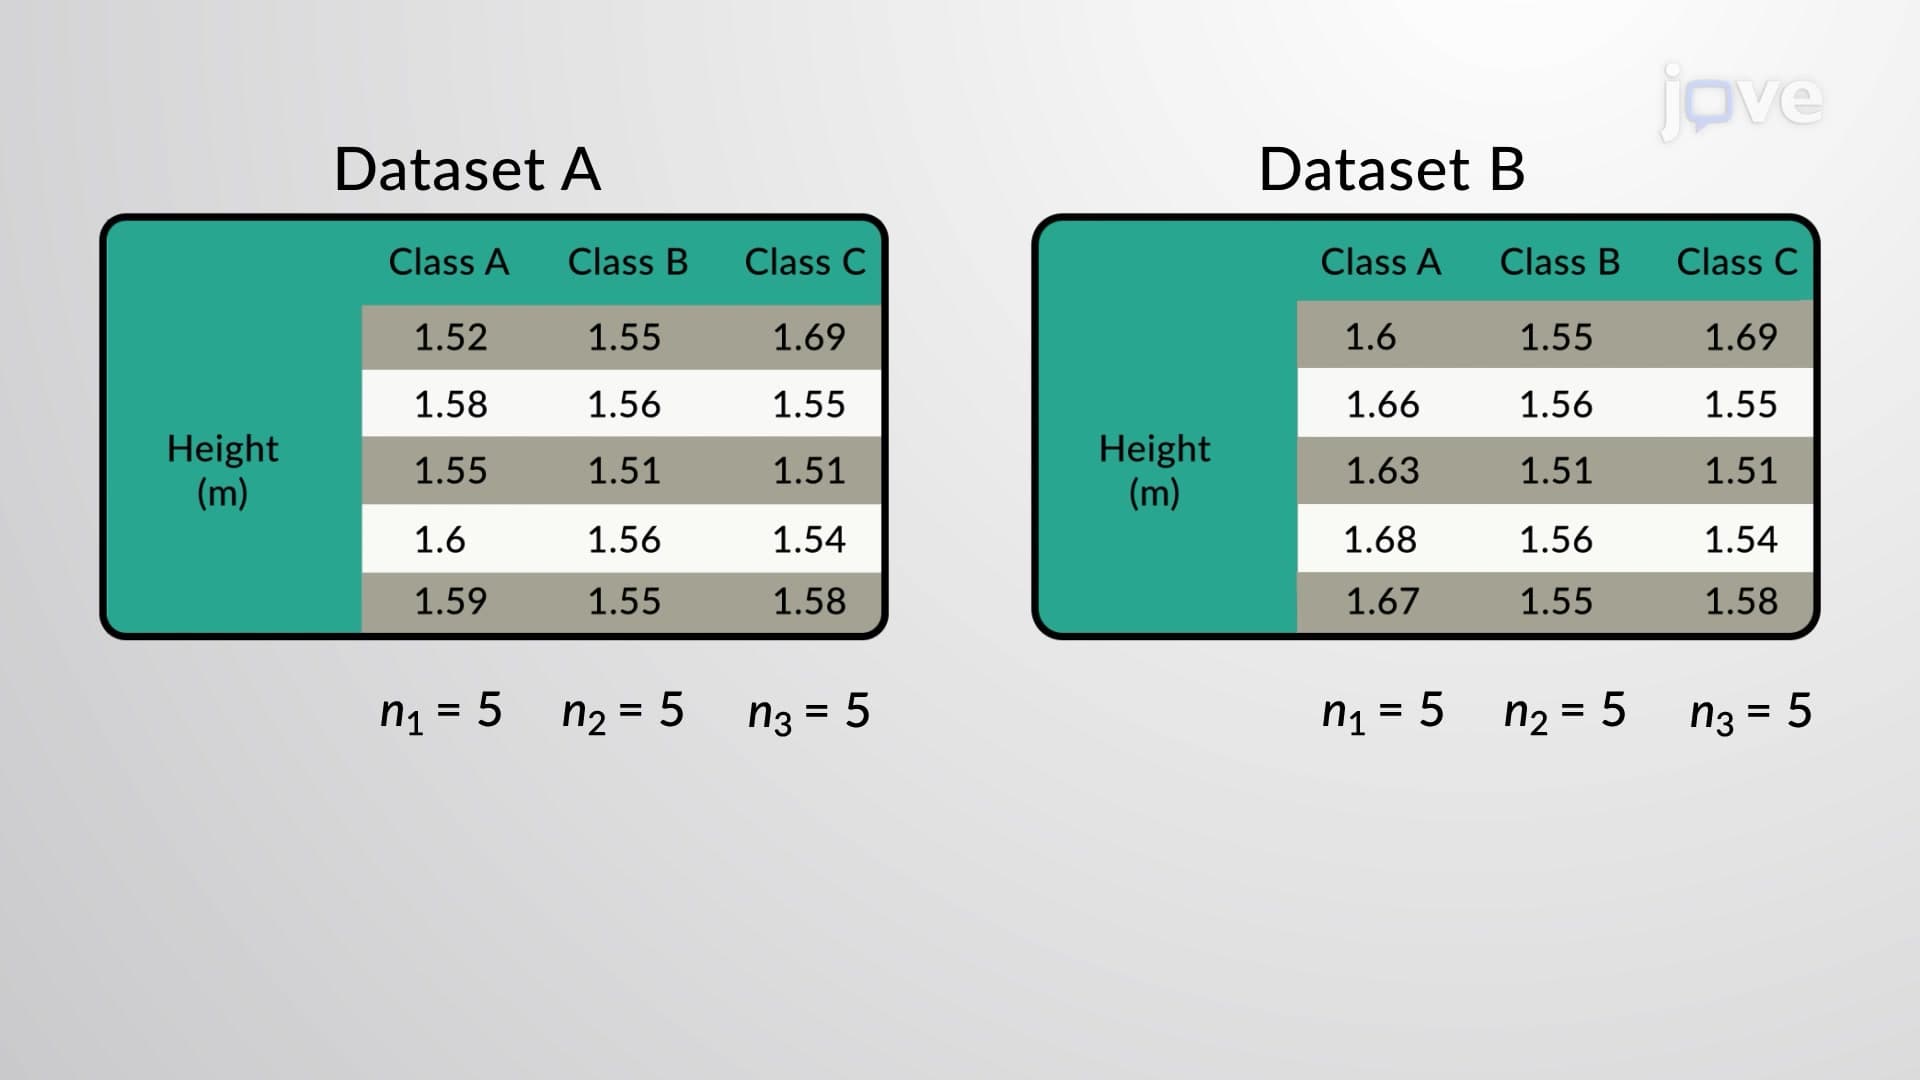

Video Summary: One Way Anova Equal Sample Sizes Explained
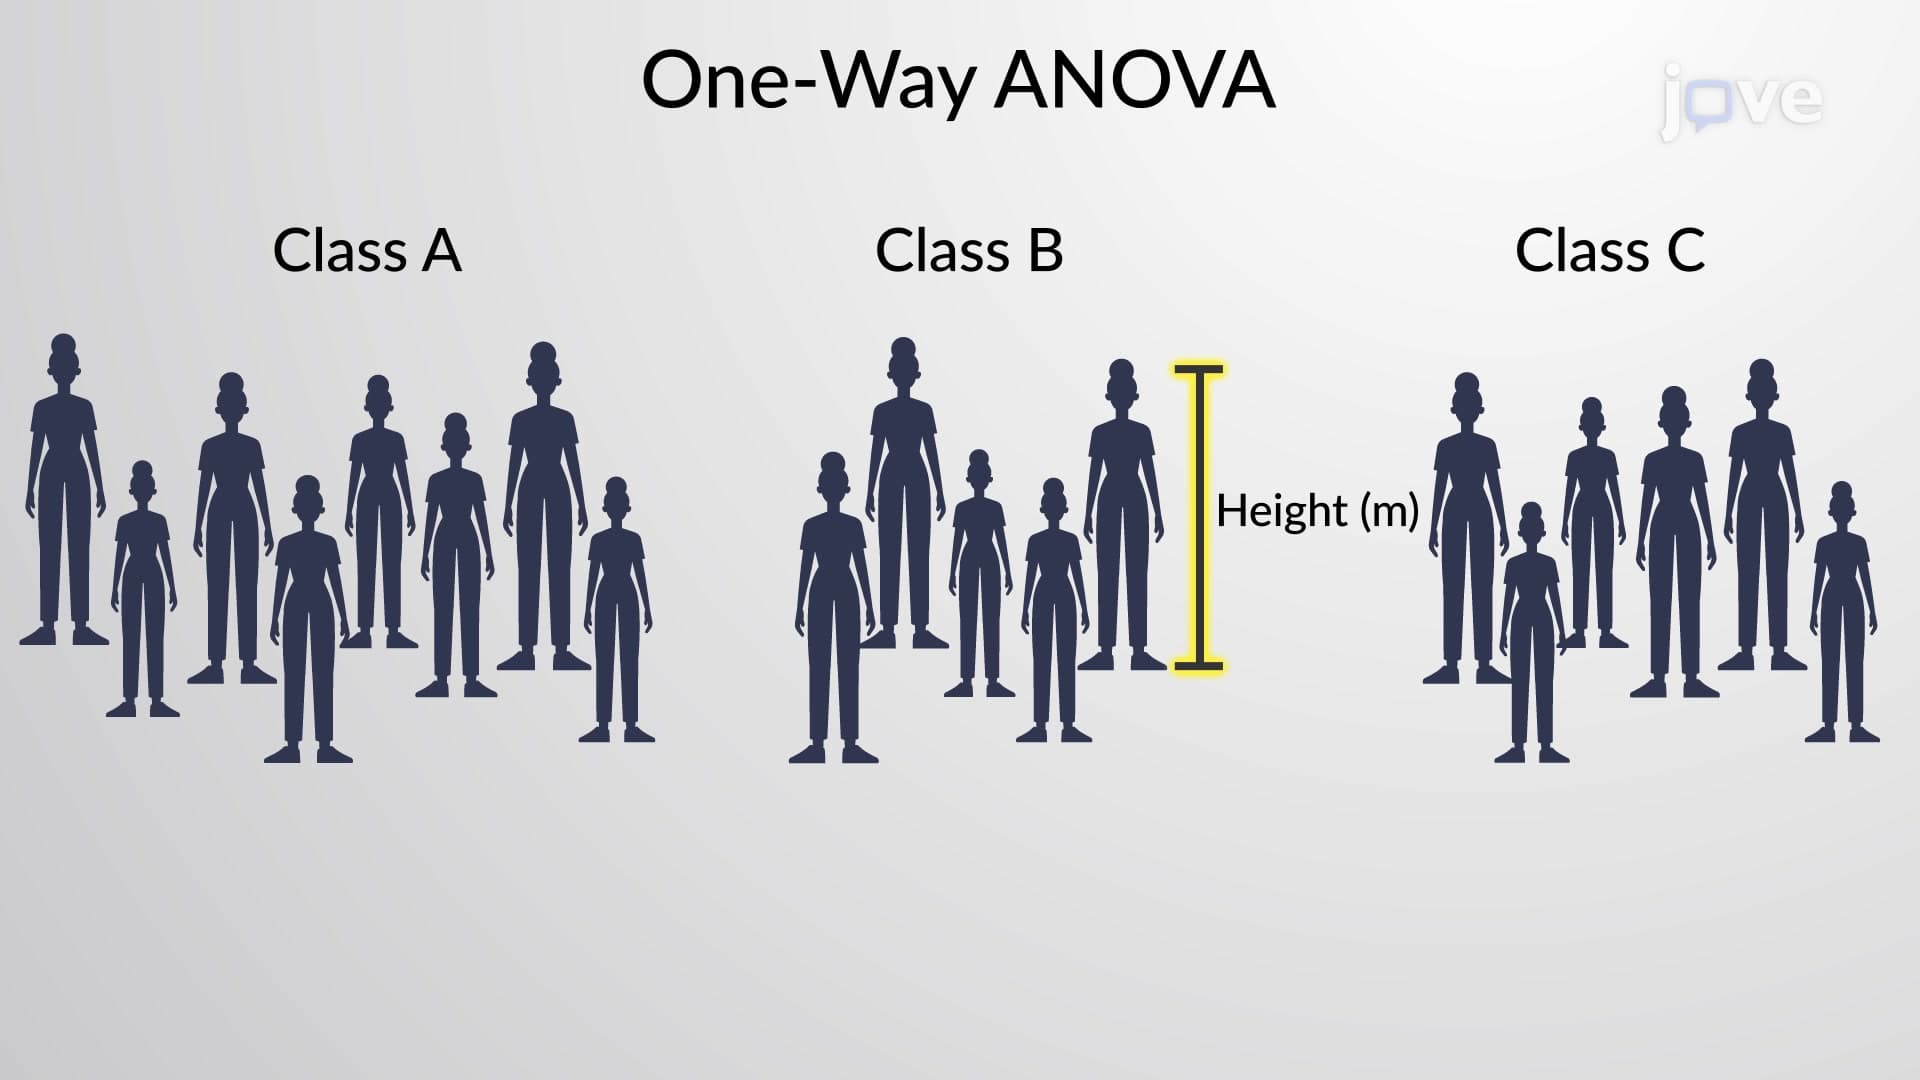
Did you know that comparing average heights between basketball, soccer, and tennis teams at your high school requires more than just looking at the means? One Way ANOVA equal sample sizes analysis reveals whether observed differences in group averages are statistically meaningful or just random variation. For instance, if each sports team has exactly 20 players, this balanced design provides maximum statistical power to detect true differences between groups. One Way ANOVA Equal Sample Sizes Explained demonstrates how identical group sizes strengthen your analysis by optimizing the F-statistic calculation. Watch the full video on JoVE Coach to master this concept with expert-led visuals and step-by-step explanations.
One Way ANOVA Equal Sample Sizes represents the gold standard for comparing means across multiple groups when each group contains the same number of observations. This balanced design approach maximizes statistical power while simplifying calculations and interpretations. In educational settings, you might encounter this when comparing test scores across different teaching methods, where each method is applied to exactly 30 students, or when analyzing reaction times across four different experimental conditions with 25 participants each.
The equal sample sizes design offers several critical advantages. First, it provides maximum statistical power for detecting true differences between groups. Second, it makes the analysis more robust against violations of assumptions like equal variances. Third, it simplifies the mathematical calculations and makes hand computations more manageable for learning purposes.
In one-way ANOVA with equal sample sizes, we establish clear hypotheses. The null hypothesis (H0) states that all population means are equal: μ1 = μ2 = μ3 = ... = μk. The alternative hypothesis (H1) indicates that at least one population mean differs from the others. This doesn't specify which means differ or by how much-just that not all means are equal.
For AP Statistics students, this concept frequently appears on exams where you must identify appropriate hypotheses for given scenarios. College-level courses in psychology, biology, and business statistics extensively use this framework. The beauty of equal sample sizes lies in how it affects the F-statistic calculation, making the analysis more sensitive to detecting true differences while maintaining control over Type I error rates.
The F-statistic in one-way ANOVA equal sample sizes compares two types of variance: between-group variance and within-group variance. Between-group variance measures how much the sample means differ from each other and the overall mean. Within-group variance measures the typical variation of individual observations around their respective group means.
When sample sizes are equal, the calculation becomes: F = (Between-group variance) / (Within-group variance). The between-group component increases when group means are more different from each other, while the within-group component remains relatively stable regardless of where the group means are located. This relationship explains why the F-statistic is "substantially affected by the sample mean"-larger differences between group means lead to larger F-statistics and stronger evidence against the null hypothesis.
Equal sample size ANOVA designs appear throughout academic research and standardized testing scenarios. In SAT prep courses, you might compare average score improvements across different tutoring methods, ensuring each method group contains exactly the same number of students. Medical school MCAT preparation programs often use this design to evaluate the effectiveness of different study strategies across balanced student groups.
Professional applications include quality control in manufacturing (comparing defect rates across equal-sized production batches), marketing research (testing consumer preferences across equally-sized demographic groups), and clinical trials (comparing treatment outcomes with equal numbers of patients in each treatment arm). Understanding these applications helps students connect statistical concepts to real-world decision-making processes.
Related Micro-courses