Loading subject page…

- Civil Engineering
- Aggregates and Water
- Sieve Analysis and Grading Curves
Micro-course: Aggregates and Water
8,112 views
Learn key concepts and earn your certificate.




Sieve Analysis and Grading Curves

00:00
01:19
Video Summary: Sieve Analysis and Grading Curves Explained
Did you know that the concrete in New York's One World Trade Center was engineered using precise particle size analysis? Sieve analysis and grading curves form the foundation of material testing in construction, determining whether aggregates meet specifications for everything from highway pavements to skyscrapers. This systematic process uses stacked sieves to separate particles by size, creating data that engineers plot as grading curves to visualize particle distribution. Watch the full video on JoVE Coach to master this concept with expert-led visuals and step-by-step explanations.
- Understand how sieve analysis and grading curves provide quantitative data about particle size distribution in construction materials
- Identify the correct sieve stack arrangement and recognize why sieves are ordered from largest to smallest aperture size
- Analyze cumulative passing percentages and interpret what these values reveal about aggregate quality
- Apply mechanical or manual sieving techniques following ASTM standards for accurate results
- Evaluate grading curves on semi-logarithmic graphs to determine if aggregates meet specification requirements
- Compare different aggregate samples using their respective grading curve profiles
- Recognize the relationship between sieve aperture sizes and retained particle fractions
- Explore how grading curve data influences concrete mix design and construction project success
Understanding Sieve Analysis And Grading Curves Fundamentals
Sieve analysis represents one of the most fundamental quality control methods in civil engineering and materials science. This standardized testing procedure quantifies the size distribution of granular materials like sand, gravel, and crushed stone-collectively known as aggregates. The American Society for Testing and Materials (ASTM) has established specific protocols, particularly ASTM C136, that govern how this analysis is conducted across the United States construction industry.
The Mechanical Process of Particle Separation
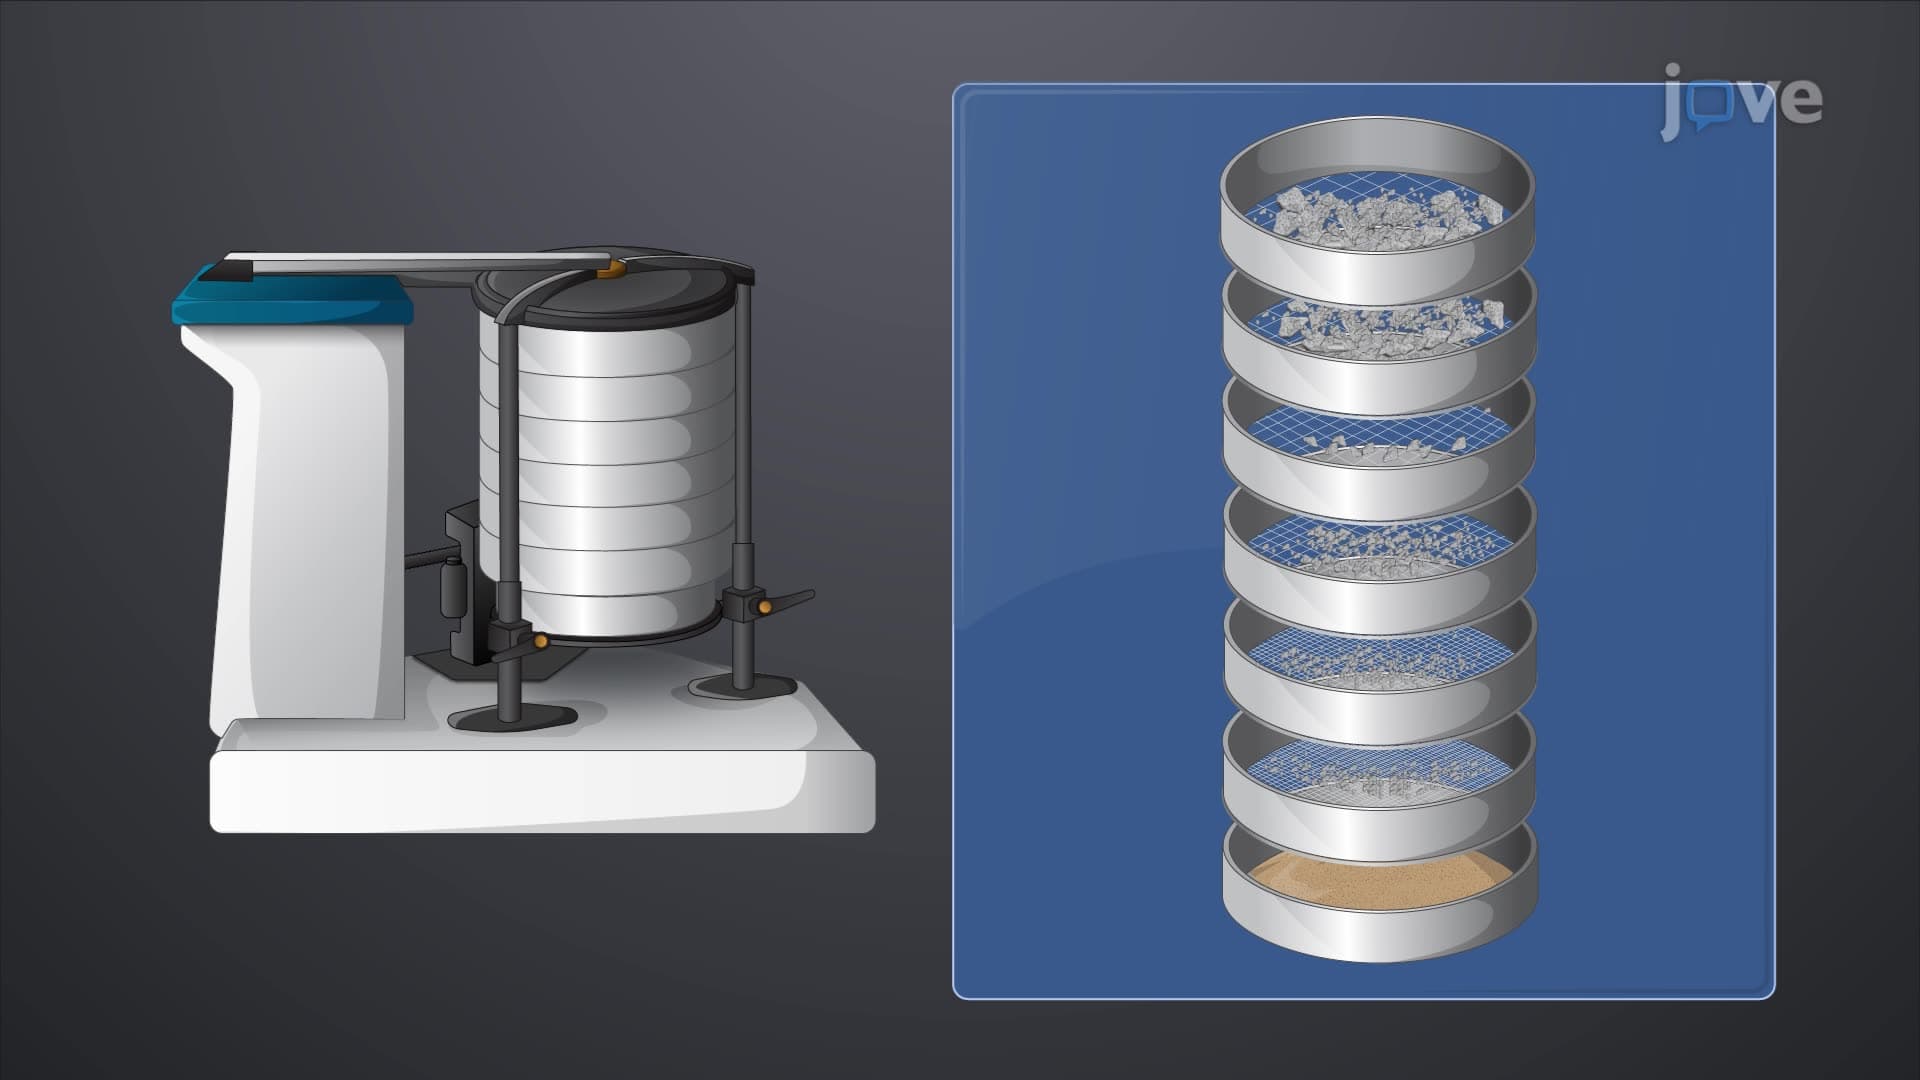
The sieving process begins with a carefully prepared sample of oven-dried aggregates, typically weighing between 500 grams for fine aggregates and up to 5 kilograms for coarse materials. Engineers stack a series of sieves in descending order of mesh aperture size, with the largest openings at the top. Common sieve sizes include 3 inches, 1.5 inches, 0.75 inches, and progressively smaller fractions down to the No. 200 sieve (0.075 mm opening).
During mechanical shaking-usually lasting 10-15 minutes for thorough separation-each sieve acts as a barrier that retains particles larger than its mesh opening while allowing smaller particles to pass through. This creates distinct size fractions, with each sieve collecting a specific range of particle sizes. The California Department of Transportation (Caltrans) and other state agencies rely heavily on this data for highway construction specifications.
Grading Curve Construction and Interpretation
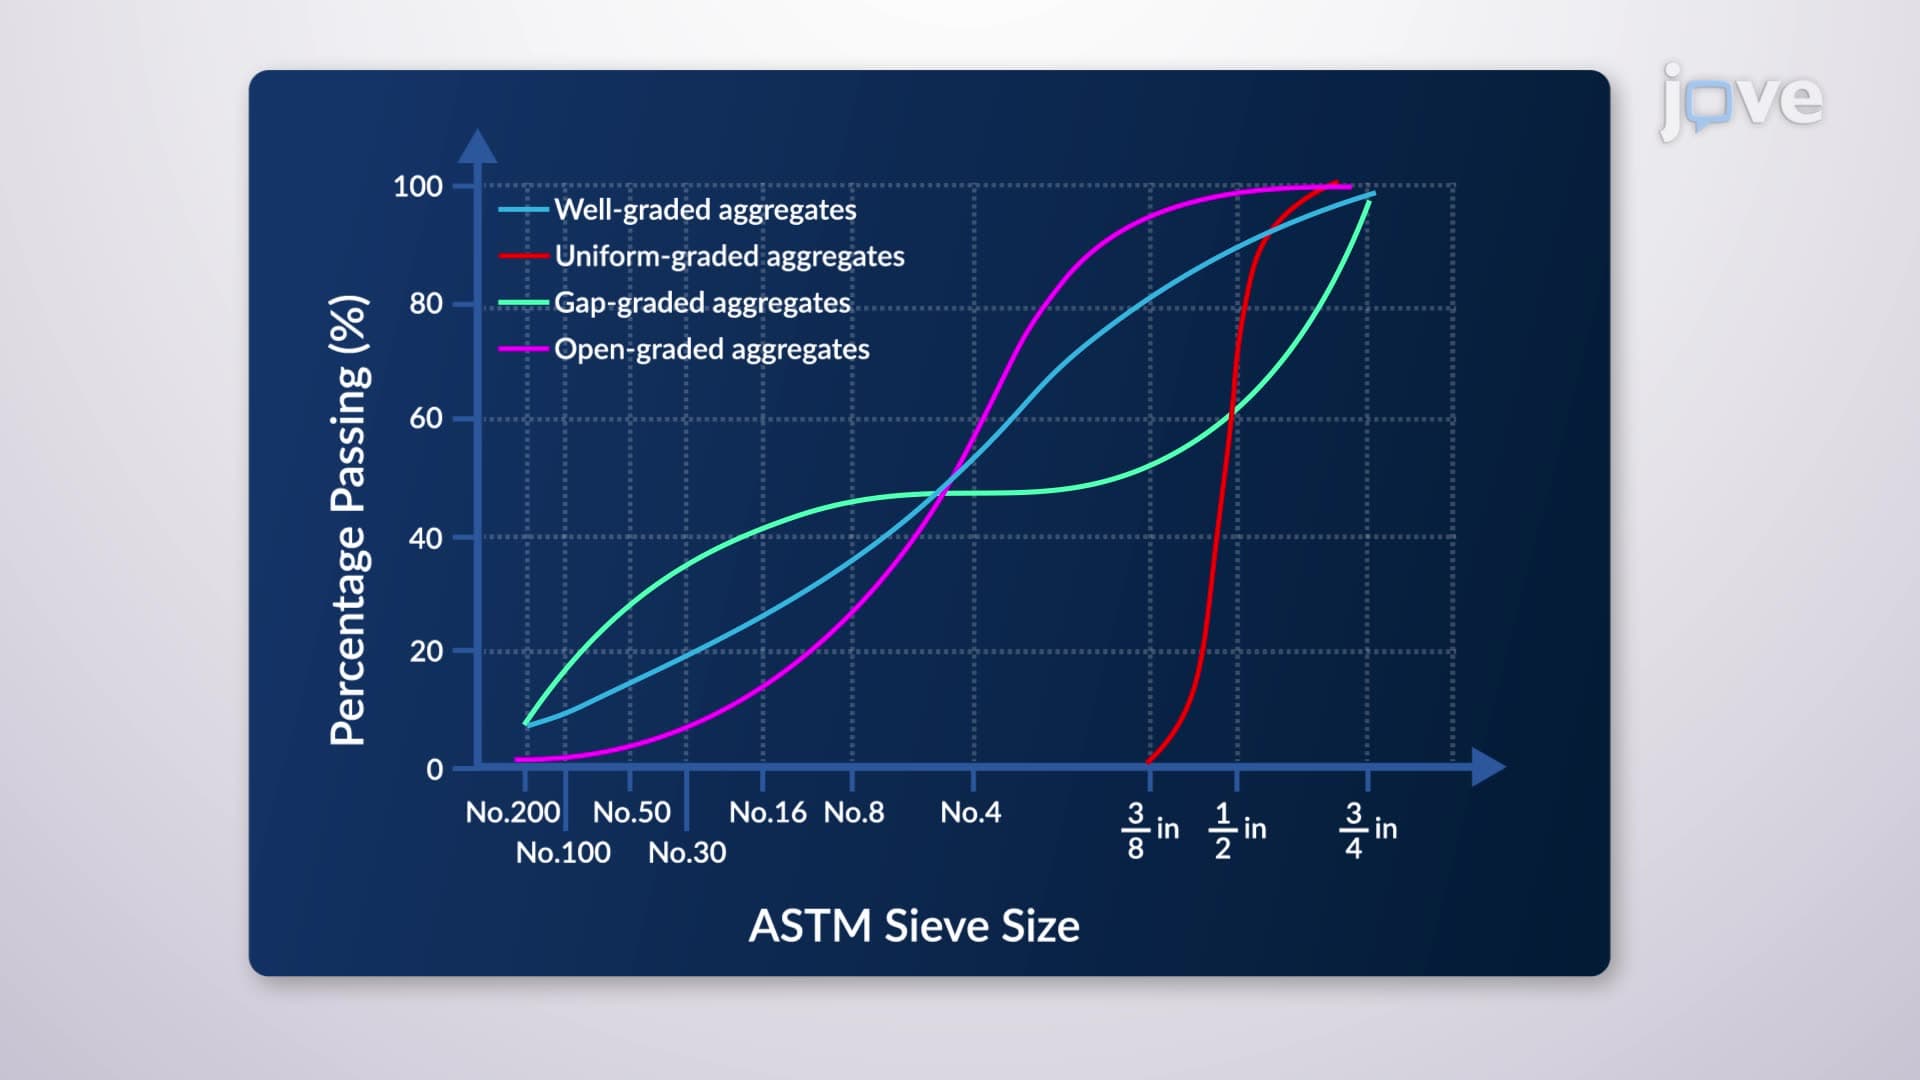
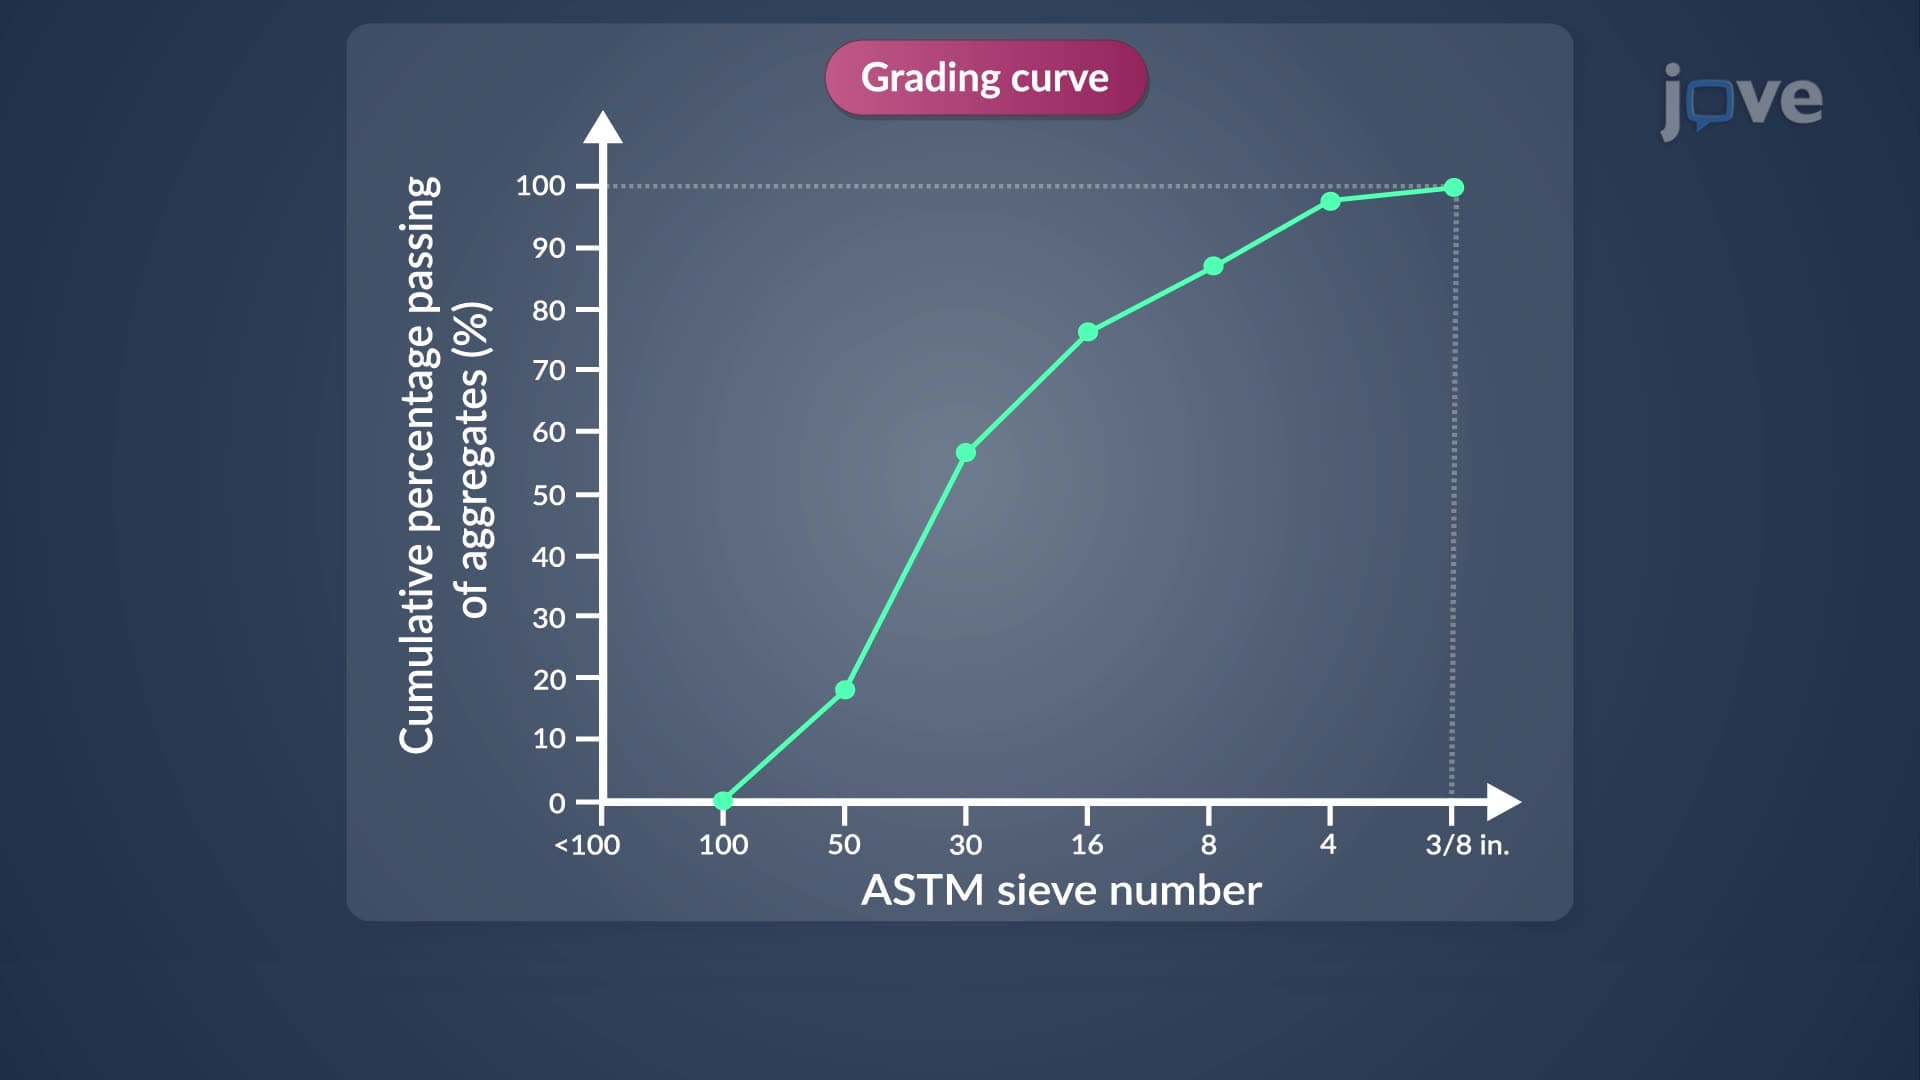
The mathematical analysis begins after weighing the retained material on each sieve. Engineers calculate the percentage of total mass retained on each sieve, then determine cumulative passing percentages by working from the finest sieve upward. These cumulative values are plotted on semi-logarithmic graph paper, with sieve aperture sizes on the logarithmic x-axis and passing percentages on the linear y-axis.
The resulting grading curve reveals critical information about aggregate suitability. A steep curve indicates uniform particle sizes (poorly graded), while a gradual slope suggests well-distributed sizes (well-graded). For instance, the Federal Highway Administration requires specific grading envelopes for different pavement layers, and contractors must demonstrate compliance through these curves.
Practical Applications in Engineering Practice
Construction projects across the United States depend on grading curve analysis for quality assurance. The concrete used in Boston's Big Dig tunnel project underwent extensive aggregate testing to ensure proper workability and strength. Similarly, AP Chemistry and college-level Materials Science courses frequently include sieve analysis as a laboratory exercise, helping students understand particle size effects on material properties.
Students preparing for the Fundamentals of Engineering (FE) exam encounter grading curve problems that test their ability to interpret particle size distributions and relate them to concrete mix design principles.
Frequently Asked Questions
Sieve analysis and grading curves represent a systematic method for measuring and visualizing the size distribution of particles in construction materials like sand and gravel. The process uses stacked mesh screens to separate particles by size, then plots the results on a graph called a grading curve. This data helps engineers determine if materials meet construction specifications and predict how they'll perform in concrete mixes or road construction.
AP Chemistry exams may include sieve analysis in the context of particle size effects on reaction rates or surface area calculations. College engineering courses frequently test students' ability to interpret grading curves, calculate cumulative passing percentages, and determine if aggregates meet ASTM specifications. Students might be asked to sketch grading curves from given data or identify whether materials are well-graded or poorly graded based on curve shape.
The Fundamentals of Engineering exam typically includes problems requiring interpretation of grading curves to classify soil or aggregate types, determine gradation coefficients, and assess material suitability for specific construction applications. Test-takers must understand the relationship between curve slope and particle size distribution, often calculating parameters like the coefficient of uniformity or coefficient of curvature from graphical data.
Highway construction requires aggregates that meet strict Federal Highway Administration and state DOT specifications for durability, drainage, and load-bearing capacity. Companies performing work on projects like I-95 reconstruction use sieve analysis to verify that their sand and gravel suppliers provide materials within required grading envelopes. This ensures proper concrete workability, adequate drainage in base layers, and long-term pavement performance under heavy traffic loads.
Basic algebra and percentage calculations are sufficient for understanding sieve analysis concepts. Students comfortable with plotting points on semi-logarithmic graph paper and calculating cumulative percentages can master this topic. High school students taking pre-calculus or AP Chemistry possess the necessary mathematical foundation, while the conceptual understanding requires no prerequisites beyond basic physical science knowledge.
Practice interpreting different curve shapes and their implications for material properties. Create flashcards linking curve characteristics to descriptive terms like "well-graded" or "gap-graded." Work through sample problems involving cumulative percentage calculations and ASTM specification limits. Focus on understanding why engineers care about particle size distribution rather than memorizing sieve sizes, as exam questions emphasize practical applications and interpretation skills.
Grading curve analysis provides the foundation for studying concrete mix design, soil mechanics, and advanced materials characterization techniques. Students planning careers in civil or materials engineering will encounter particle size analysis in graduate courses on composite materials, powder metallurgy, and geotechnical engineering. The statistical concepts underlying grading curves also appear in quality control methods used throughout manufacturing industries.
Related Micro-courses

8 Concepts
18 Concepts

12 Concepts