Loading subject page…

- Analytical Chemistry
- Electrochemical Analyses and Redox Titration
- End Point Prediction: Gran Plot
Micro-course: Electrochemical Analyses and Redox Titration
33,039 views
Learn key concepts and earn your certificate.












End Point Prediction: Gran Plot

00:00
01:07
Video Summary: End Point Prediction Gran Plot Explained
Ever wondered how pharmaceutical companies like Pfizer determine the exact concentration of drug solutions without waiting hours for complete titrations? Gran plot endpoint prediction revolutionizes analytical chemistry by predicting titration endpoints using only partial data. This powerful linearization technique converts curved titration data into straight lines, allowing chemists at FDA labs to extrapolate and find equivalence points with remarkable accuracy. The End Point Prediction Gran Plot Explained method saves time while maintaining precision in critical quality control processes. Watch the full video on JoVE Coach to master this concept with expert-led visuals and step-by-step explanations.
- Understand how End Point Prediction Gran Plot Explained transforms nonlinear titration curves into predictable linear relationships for accurate endpoint determination
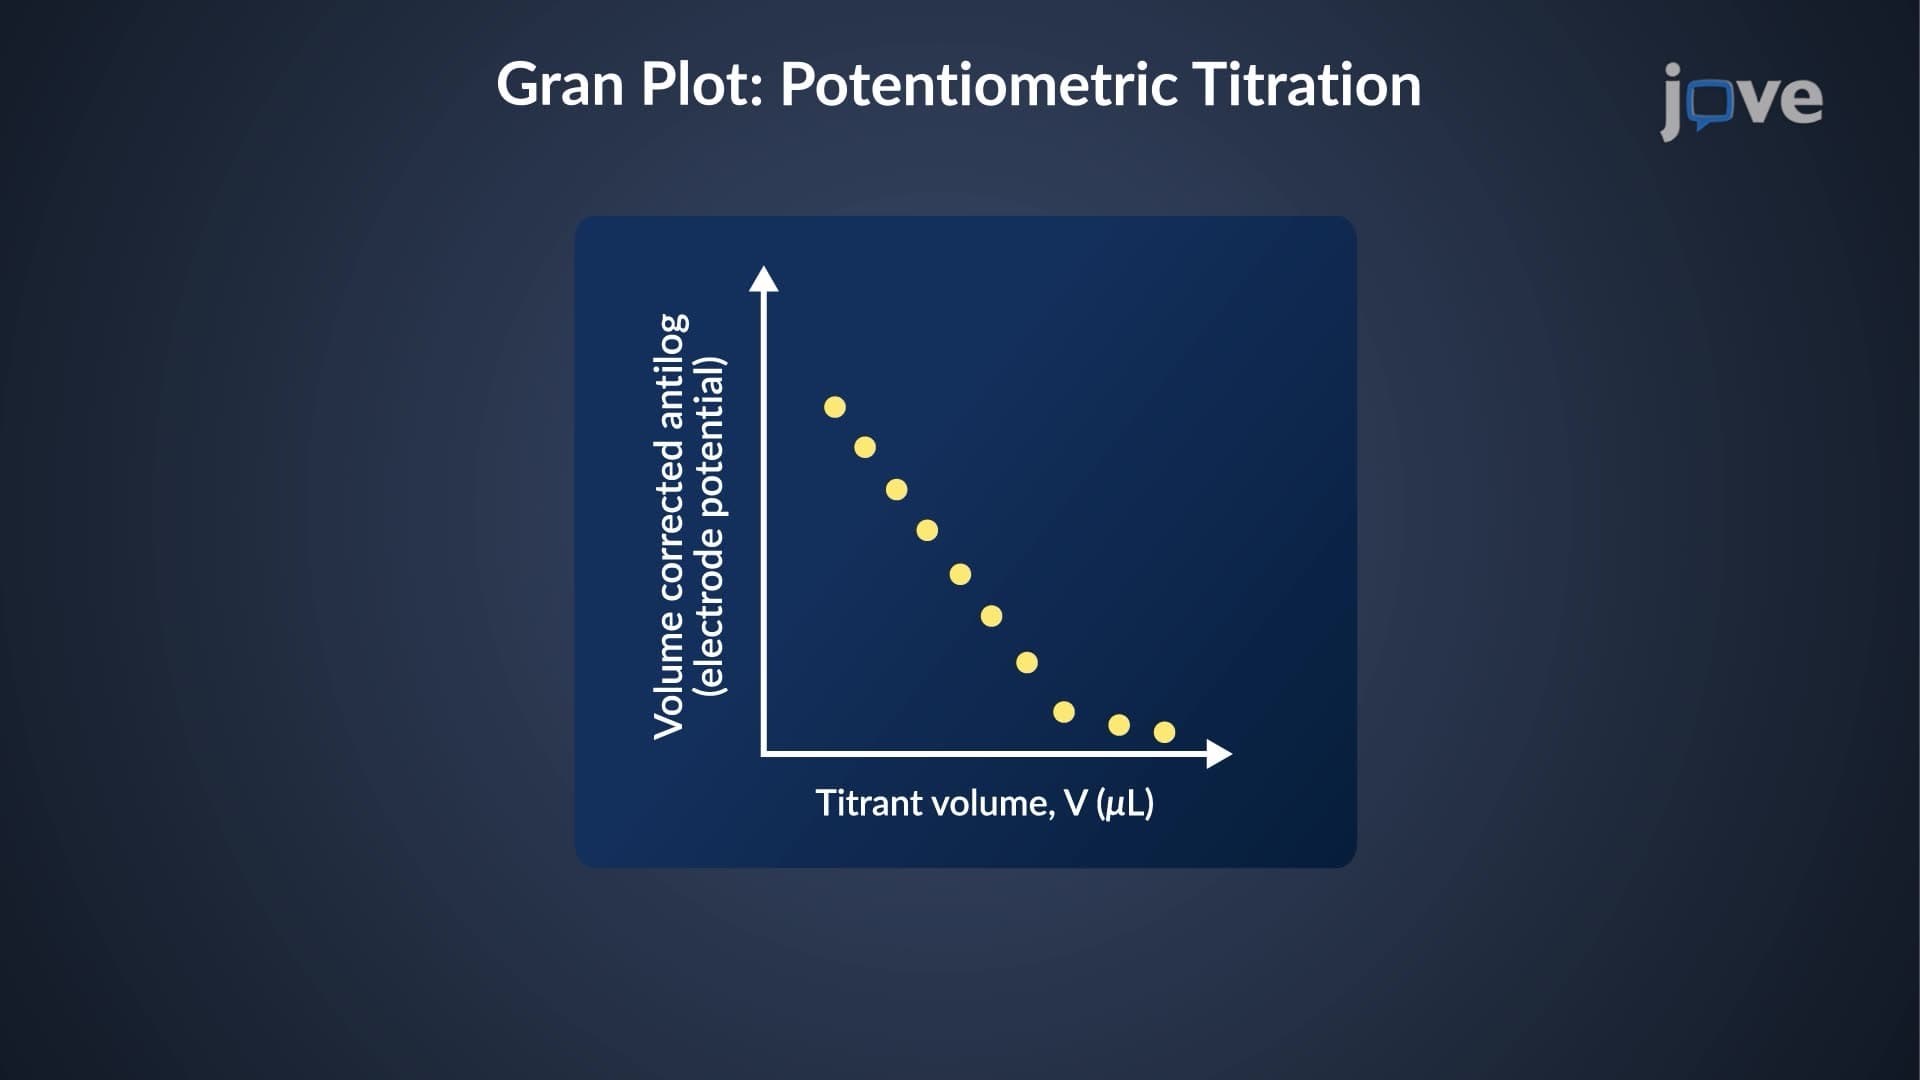
- Identify the mathematical relationship between volume-corrected antilogarithm values and titrant volume in potentiometric Gran plot applications
- Analyze pre-equivalence point data to construct linear Gran function plots that extrapolate to precise endpoint volumes
- Apply linearization titration curve techniques to both strong acid-strong base and weak acid-strong base titration systems
- Evaluate the advantages of Gran plot methods over traditional titration approaches in terms of time efficiency and accuracy
- Recognize the role of activity-corrected acid dissociation constants in determining Gran plot slopes for weak acid titrations
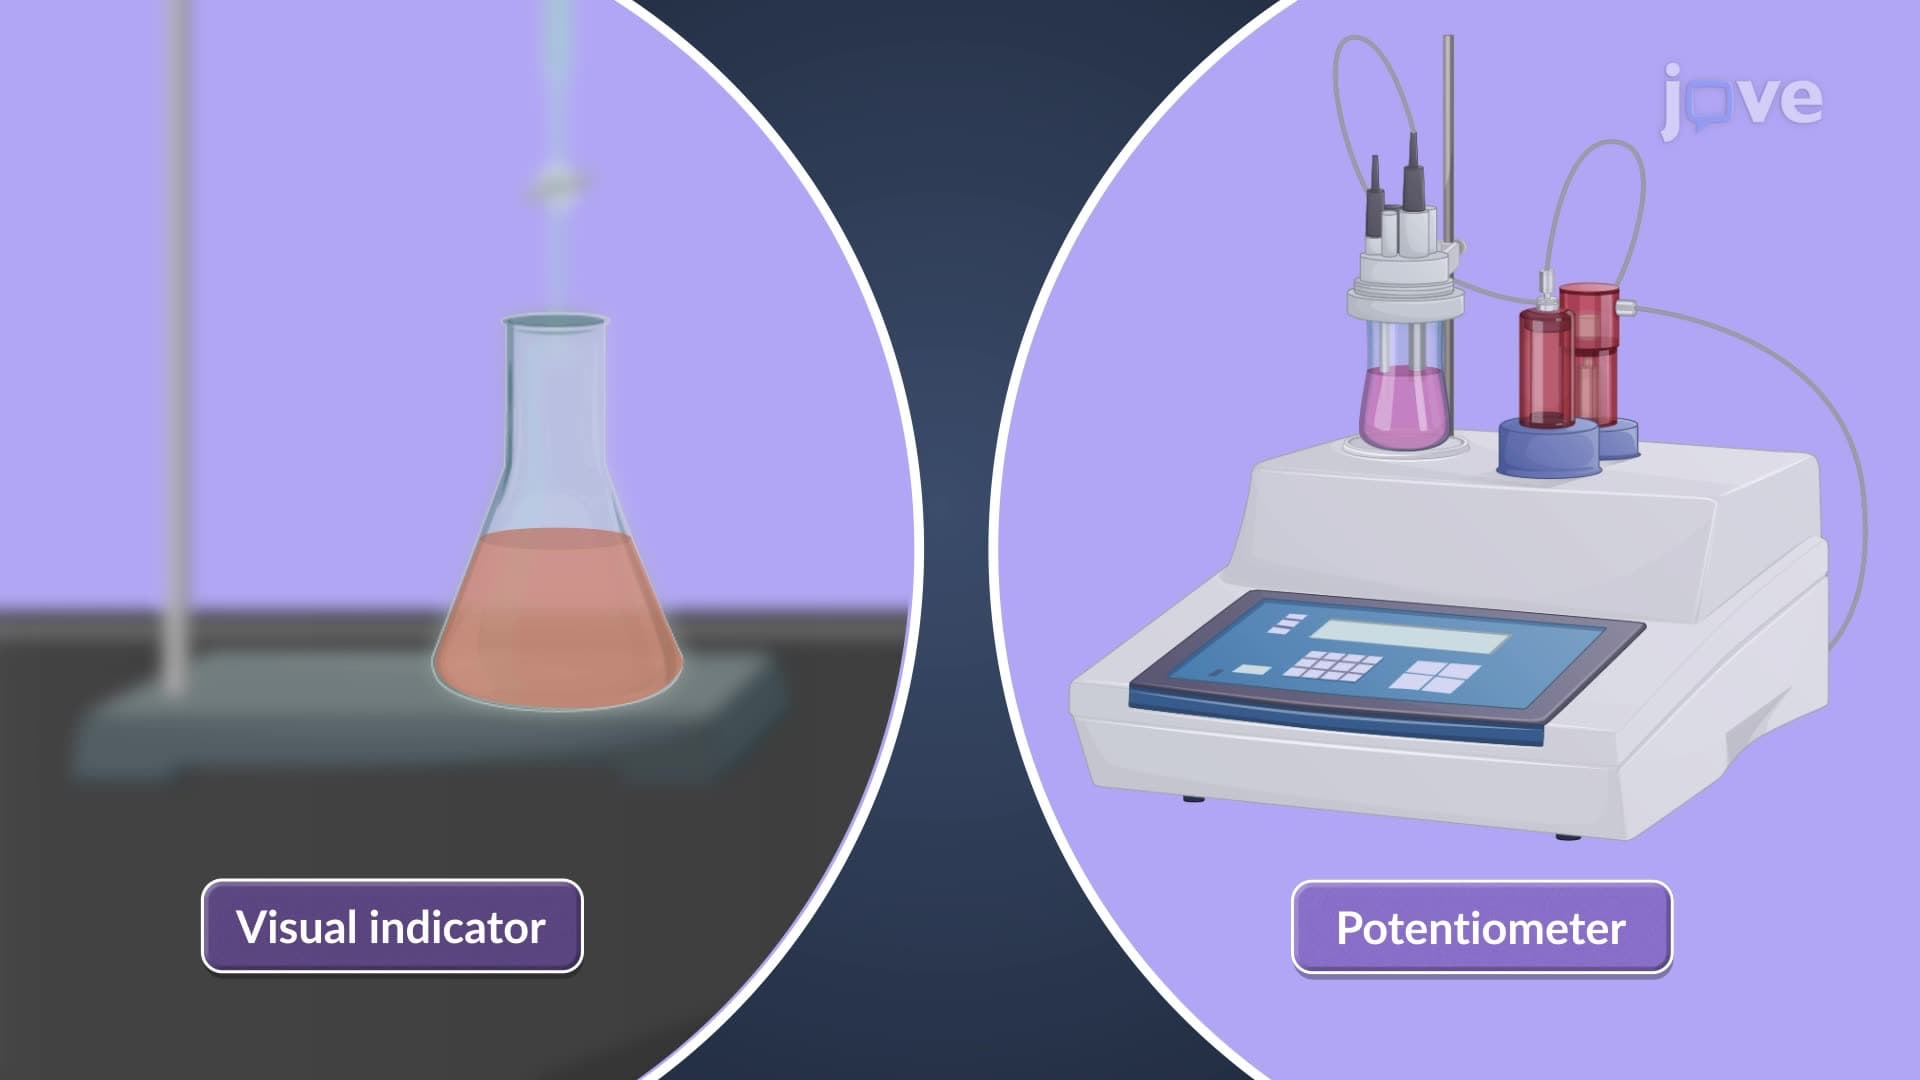
- Compare potentiometric Gran plot procedures with conventional endpoint detection methods used in analytical laboratories
- Explore practical applications of endpoint extrapolation Gran techniques in pharmaceutical quality control and environmental analysis
Understanding End Point Prediction Gran Plot Methodology
The End Point Prediction Gran Plot Explained technique represents a sophisticated analytical approach that transforms traditional titration methodology. Unlike conventional titrations that require complete reaction to identify endpoints, Gran plots utilize mathematical linearization to predict equivalence points using only partial titration data. This method proves invaluable in analytical laboratories across the United States, from EPA environmental testing facilities to pharmaceutical manufacturing plants.
Mathematical Foundation of Gran Function Titration
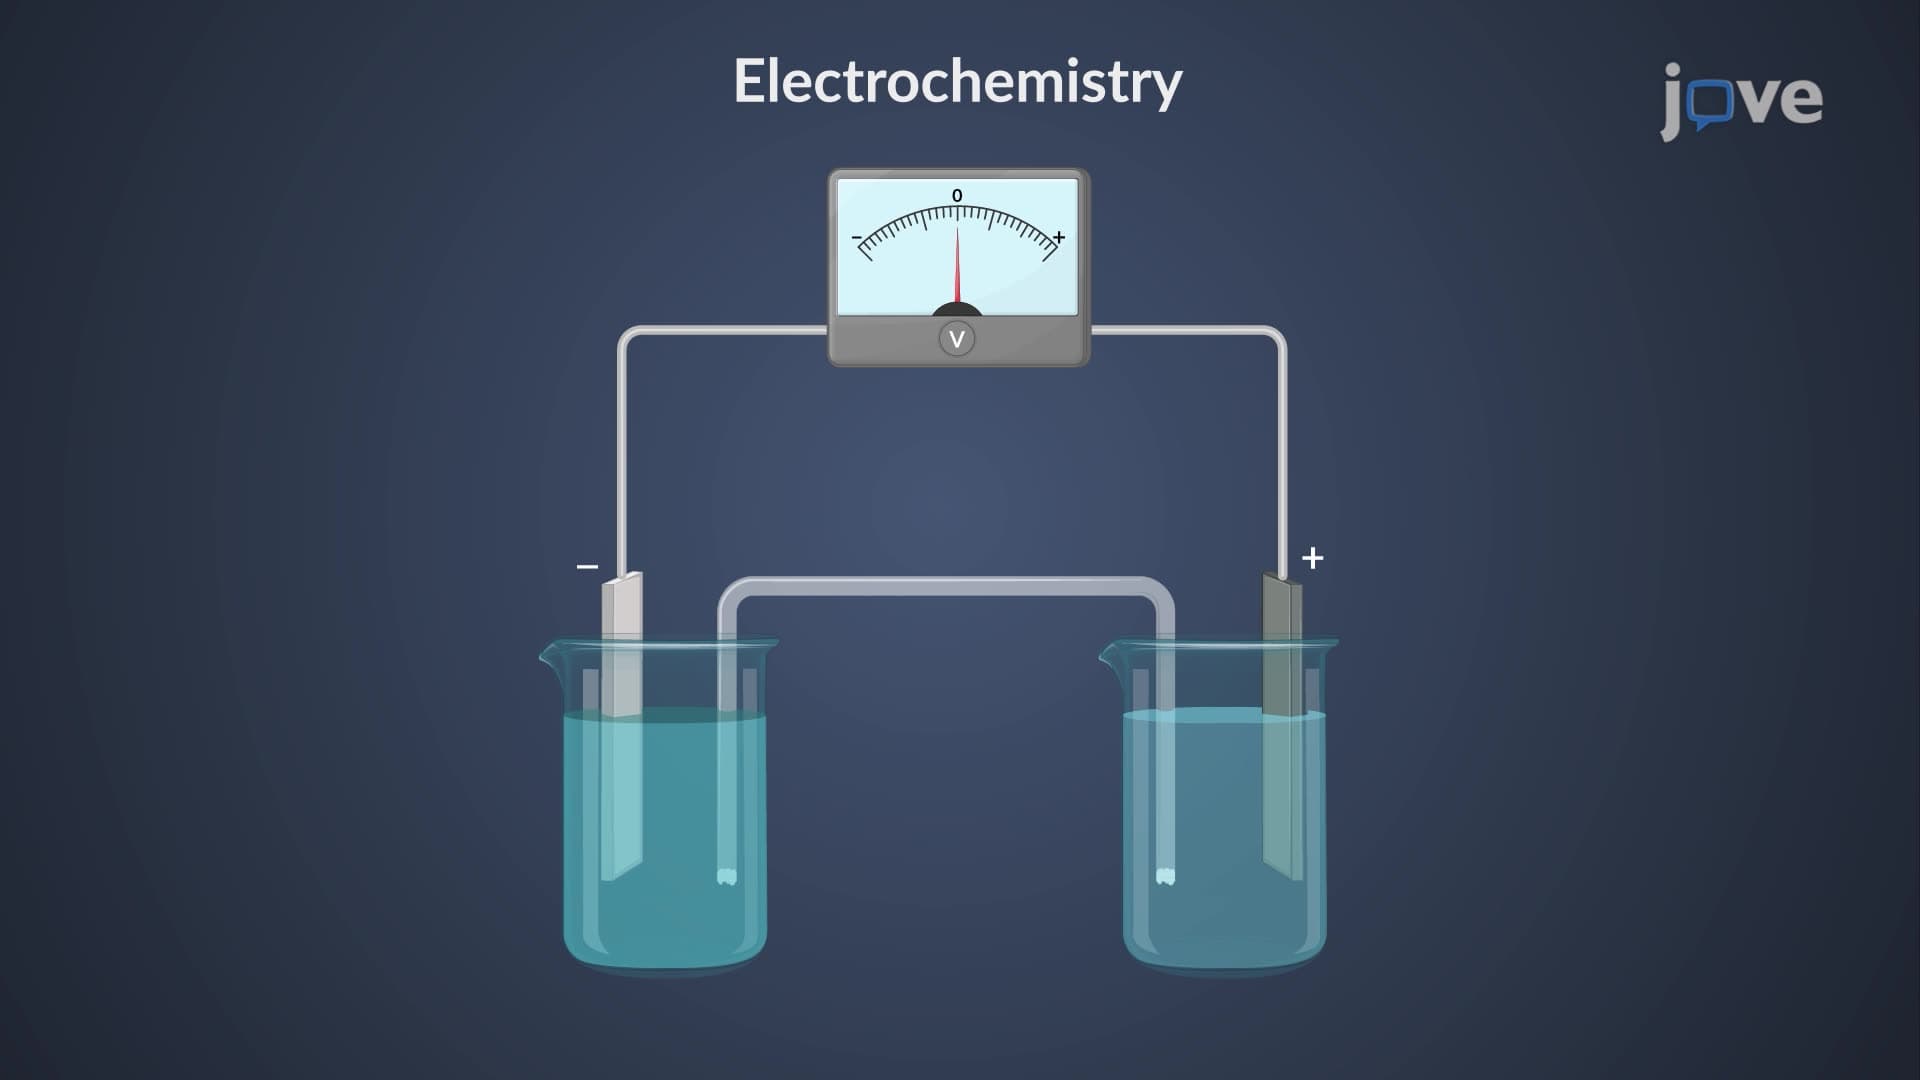
The core principle behind Gran plot potentiometric titration involves converting exponential electrode potential relationships into linear forms. For potentiometric titrations, analysts plot the volume-corrected base-10 antilogarithm of electrode potential against titrant volume. This transformation follows the equation: Gran function = (V + V0) × 10^(E/S), where V represents added titrant volume, V0 is initial sample volume, E is electrode potential, and S is electrode slope.
The linearization titration curve approach proves particularly powerful because it eliminates the subjective interpretation of traditional S-shaped titration curves. Students preparing for AP Chemistry exams or MCAT assessments benefit from understanding this quantitative approach, as it demonstrates the practical application of logarithmic functions and linear regression in analytical chemistry.
Pre-Equivalence Point Gran Analysis Applications
In weak acid-strong base titrations, the pre-equivalence point Gran method yields linear plots with slopes equal to the negative activity-corrected acid dissociation constant (Ka). This relationship provides dual analytical value: endpoint prediction and simultaneous determination of acid strength. Major pharmaceutical companies like Johnson & Johnson utilize these techniques for quality control of active pharmaceutical ingredients, where both concentration and purity must meet FDA specifications.
Practical Implementation and Advantages
Endpoint extrapolation Gran techniques offer significant advantages over traditional titration methods. Time savings prove substantial in high-throughput analytical laboratories, where hundreds of samples require daily analysis. The method's mathematical rigor eliminates human error in endpoint detection, particularly valuable when training new laboratory technicians or when working with colored solutions that obscure visual indicators.
Students encountering this concept in college analytical chemistry courses should recognize its connection to fundamental principles learned in high school chemistry. The Gran plot method builds upon acid-base equilibrium concepts, electrode potentials, and linear regression analysis - topics frequently tested on standardized exams like the SAT Subject Test in Chemistry.
Frequently Asked Questions
End Point Prediction Gran Plot is a mathematical technique that converts curved titration data into linear relationships, allowing chemists to predict equivalence points using only partial titration data. It works by plotting volume-corrected antilogarithm functions against titrant volume, creating straight lines that extrapolate to reveal precise endpoint volumes. This method saves time and improves accuracy in analytical laboratories nationwide.
AP Chemistry exams may test Gran plot concepts through data analysis questions involving linearization of experimental data and extrapolation techniques. MCAT passages frequently include Gran plot applications in analytical chemistry contexts, testing students' ability to interpret linear relationships and predict outcomes from partial data sets. College analytical chemistry courses extensively cover these methods for quantitative analysis applications.
Gran plot titration explained simplifies endpoint detection by converting complex S-shaped curves into straight lines that students can easily analyze using basic linear regression. Unlike traditional titration curves requiring subjective interpretation of inflection points, Gran plots provide objective mathematical endpoints through x-axis intercepts. This quantitative approach reduces errors and provides more reliable results for analytical determinations.
Pharmaceutical companies employ Gran plot techniques for rapid quality control analysis of drug formulations and active pharmaceutical ingredients. These methods enable precise concentration determinations without completing full titrations, saving valuable time in production environments. FDA-regulated manufacturing facilities rely on Gran plot accuracy for batch release testing and stability studies of critical medications.
Gran plot endpoint prediction builds naturally on fundamental concepts like acid-base equilibria and linear relationships that high school students already understand. While the mathematical treatment appears sophisticated, the underlying principles connect directly to familiar topics like pH calculations and graphing linear equations. Students with solid algebra and basic chemistry knowledge can successfully master these techniques.
Focus on understanding the linearization concept rather than memorizing complex equations - practice converting exponential relationships to linear forms using logarithmic transformations. Work through multiple example problems involving different titration types, and always verify your linear regression results make chemical sense. Create summary sheets connecting Gran plot slopes and intercepts to fundamental equilibrium constants.
Students should investigate other linearization techniques like Scatchard plots for binding studies, Lineweaver-Burk plots in enzyme kinetics, and Henderson-Hasselbalch applications in buffer systems. These methods share similar mathematical approaches and appear frequently in advanced biochemistry, physical chemistry, and clinical laboratory science programs. Understanding Gran plots provides an excellent foundation for these related analytical techniques.
Mastering Gran plot potentiometric titration develops critical analytical thinking skills and mathematical problem-solving abilities essential for laboratory work. Students learn to evaluate data quality, recognize systematic errors, and apply statistical analysis to experimental results. These transferable skills prove valuable across all laboratory sciences, from clinical diagnostics to environmental monitoring and quality control applications.
Related Micro-courses

27 Concepts

14 Concepts

19 Concepts