Loading subject page…


33,042 views

Video Summary: What Is Voltammetric Techniques Cyclic Voltammetry
Ever wondered how scientists at the FDA determine if a medication contains the right amount of active ingredient? Cyclic voltammetry explained reveals this powerful electrochemical technique that measures how substances gain or lose electrons, making it essential for drug testing, environmental monitoring, and battery research across US laboratories. This voltammetric method uses a triangular voltage pattern to create distinctive current peaks that identify and quantify chemical compounds. Watch the full video on JoVE Coach to master this concept with expert-led visuals and step-by-step explanations.
Cyclic voltammetry technique chemistry represents one of the most versatile analytical methods in modern electrochemistry. Unlike simple voltage measurements, CV actively controls the electrical potential while monitoring the resulting current, creating a dynamic picture of how molecules behave during electron transfer. This technique proves invaluable in US research institutions from MIT's Department of Chemical Engineering to Stanford's Materials Science programs, where scientists investigate everything from lithium-ion battery performance to biomarker detection.
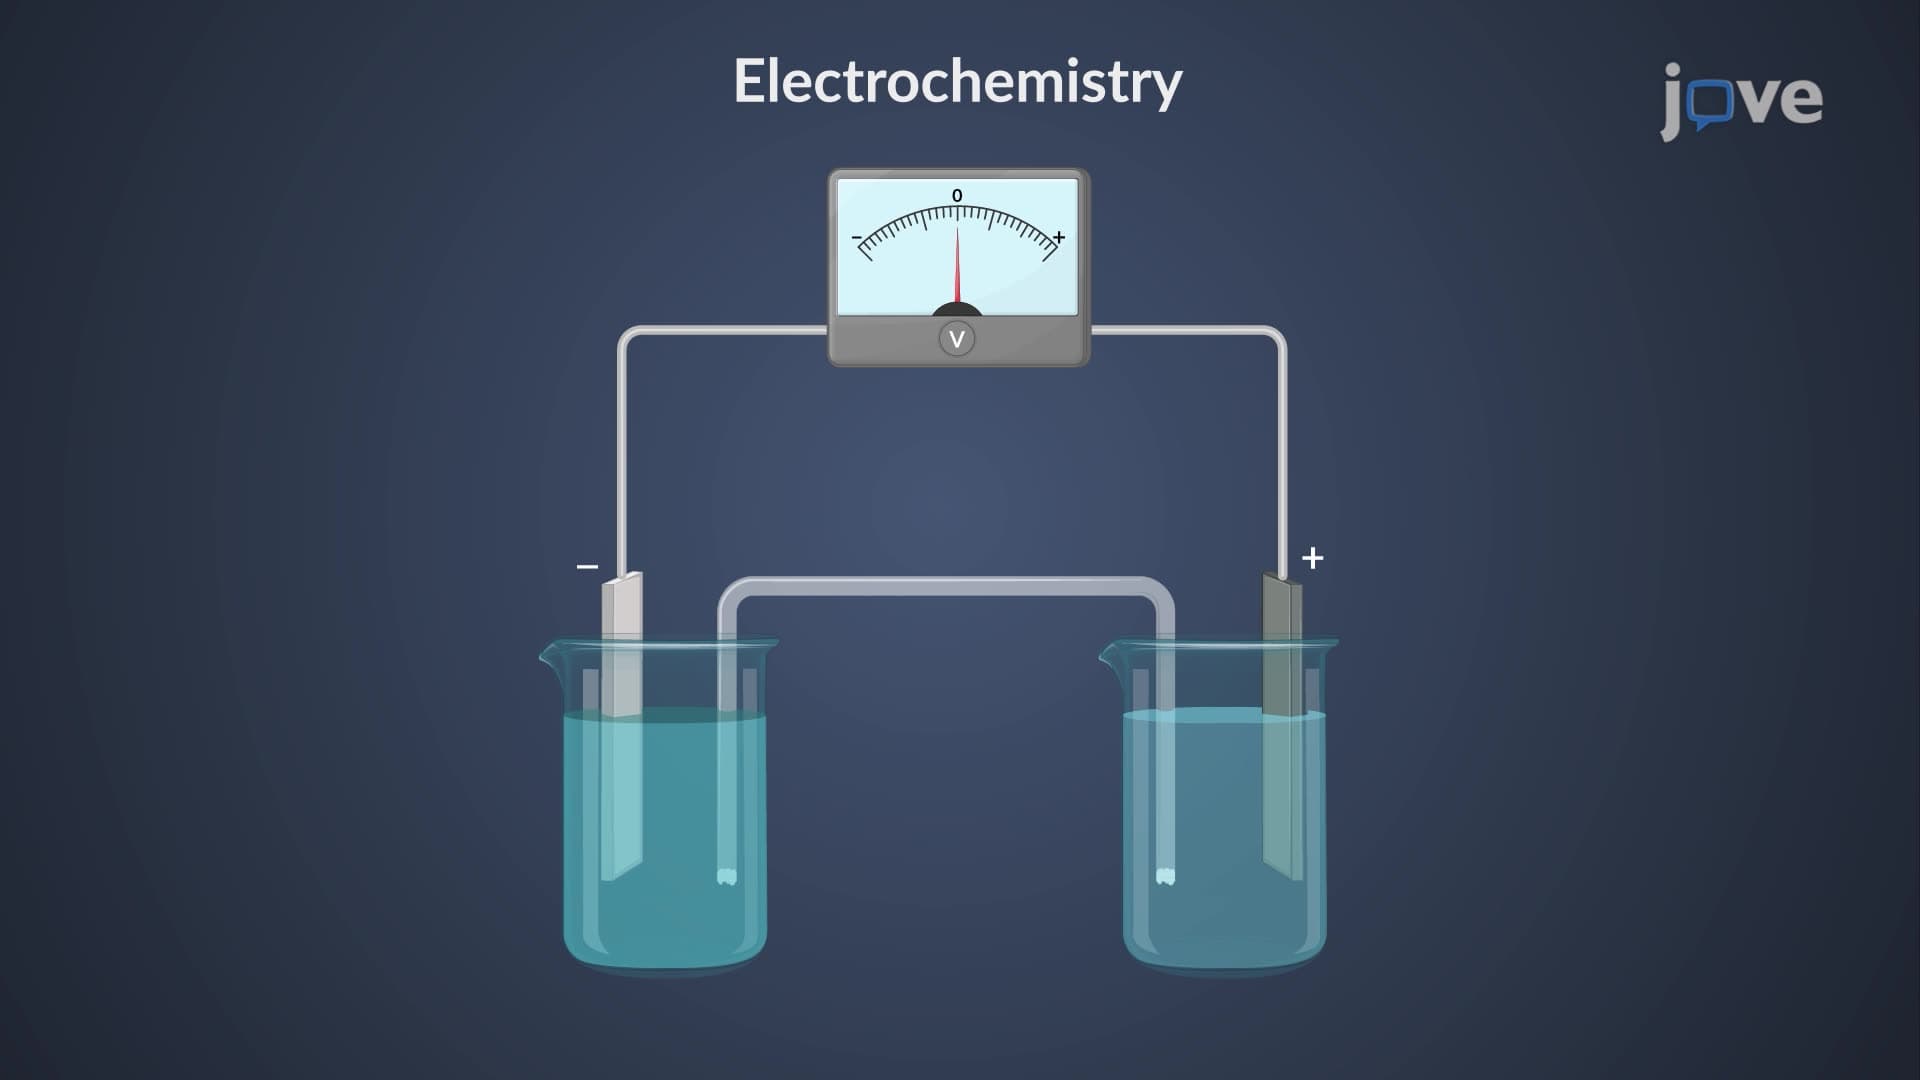
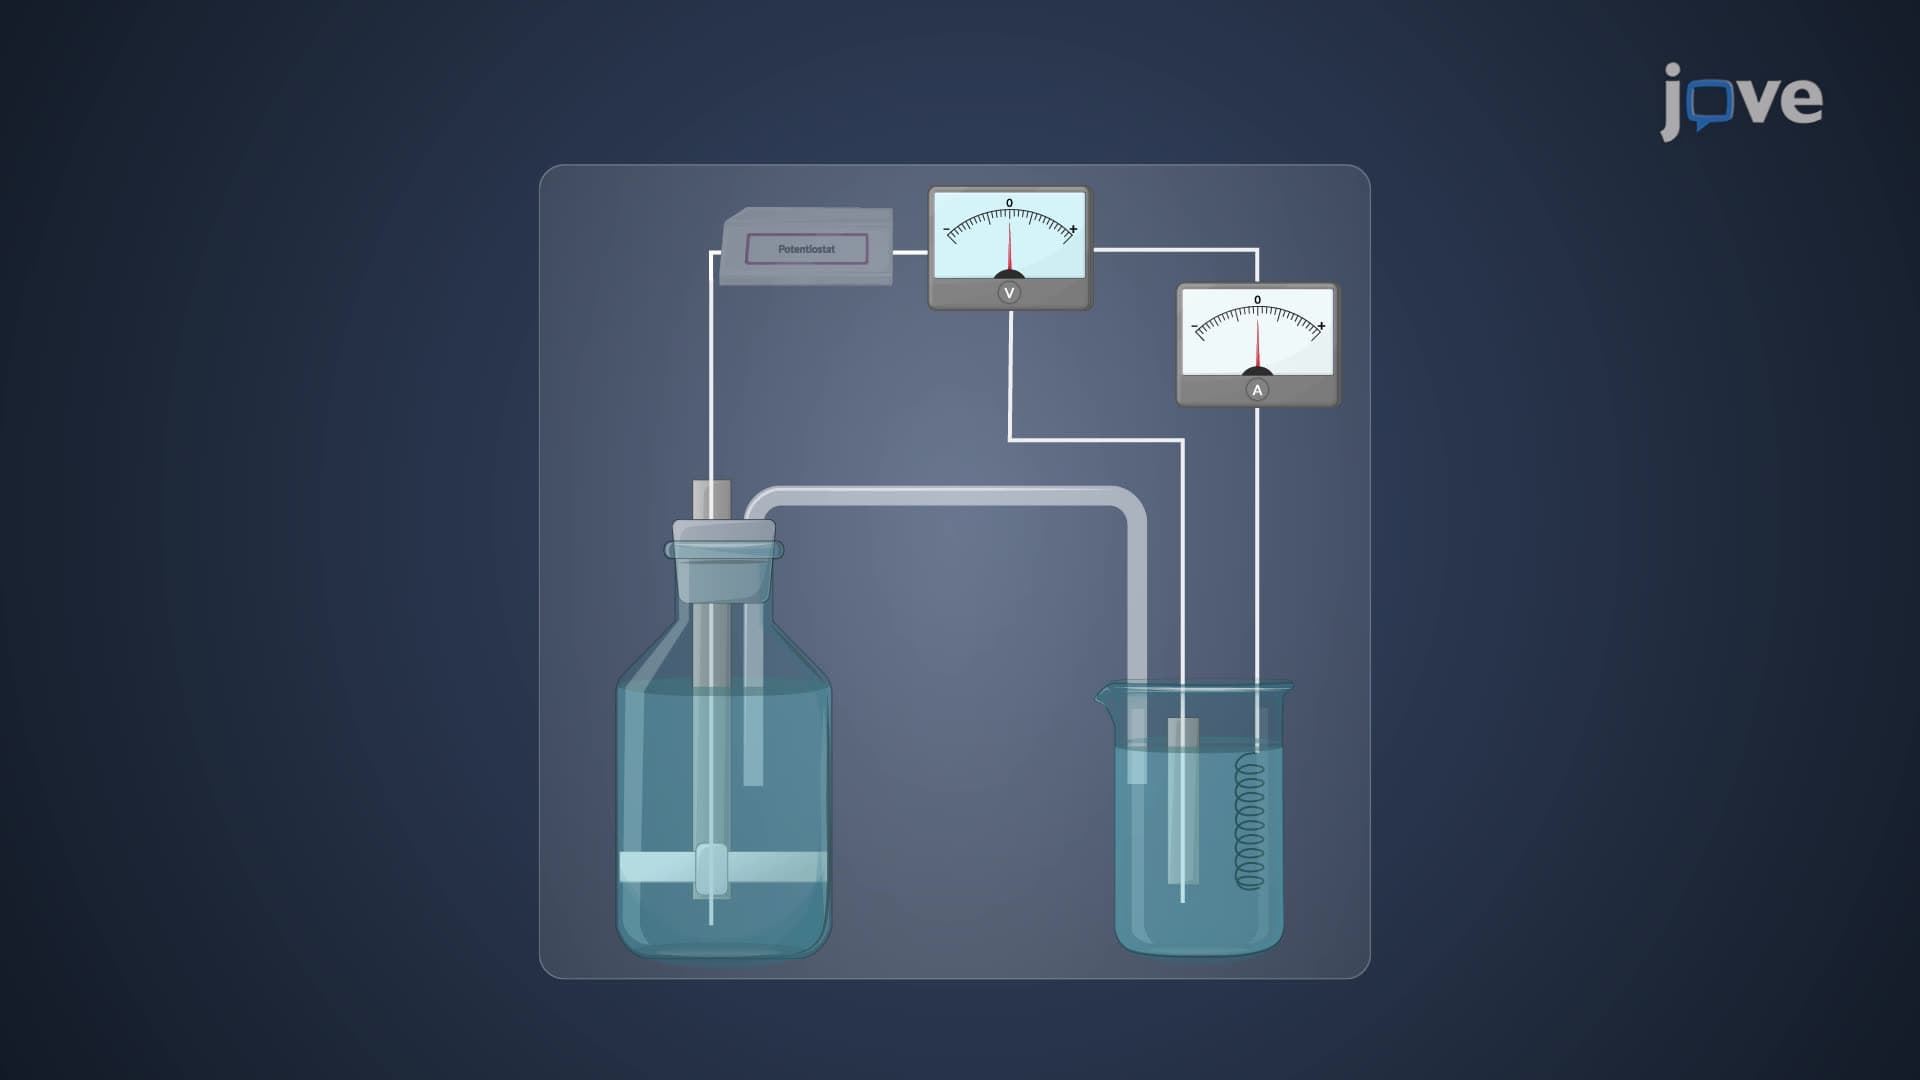
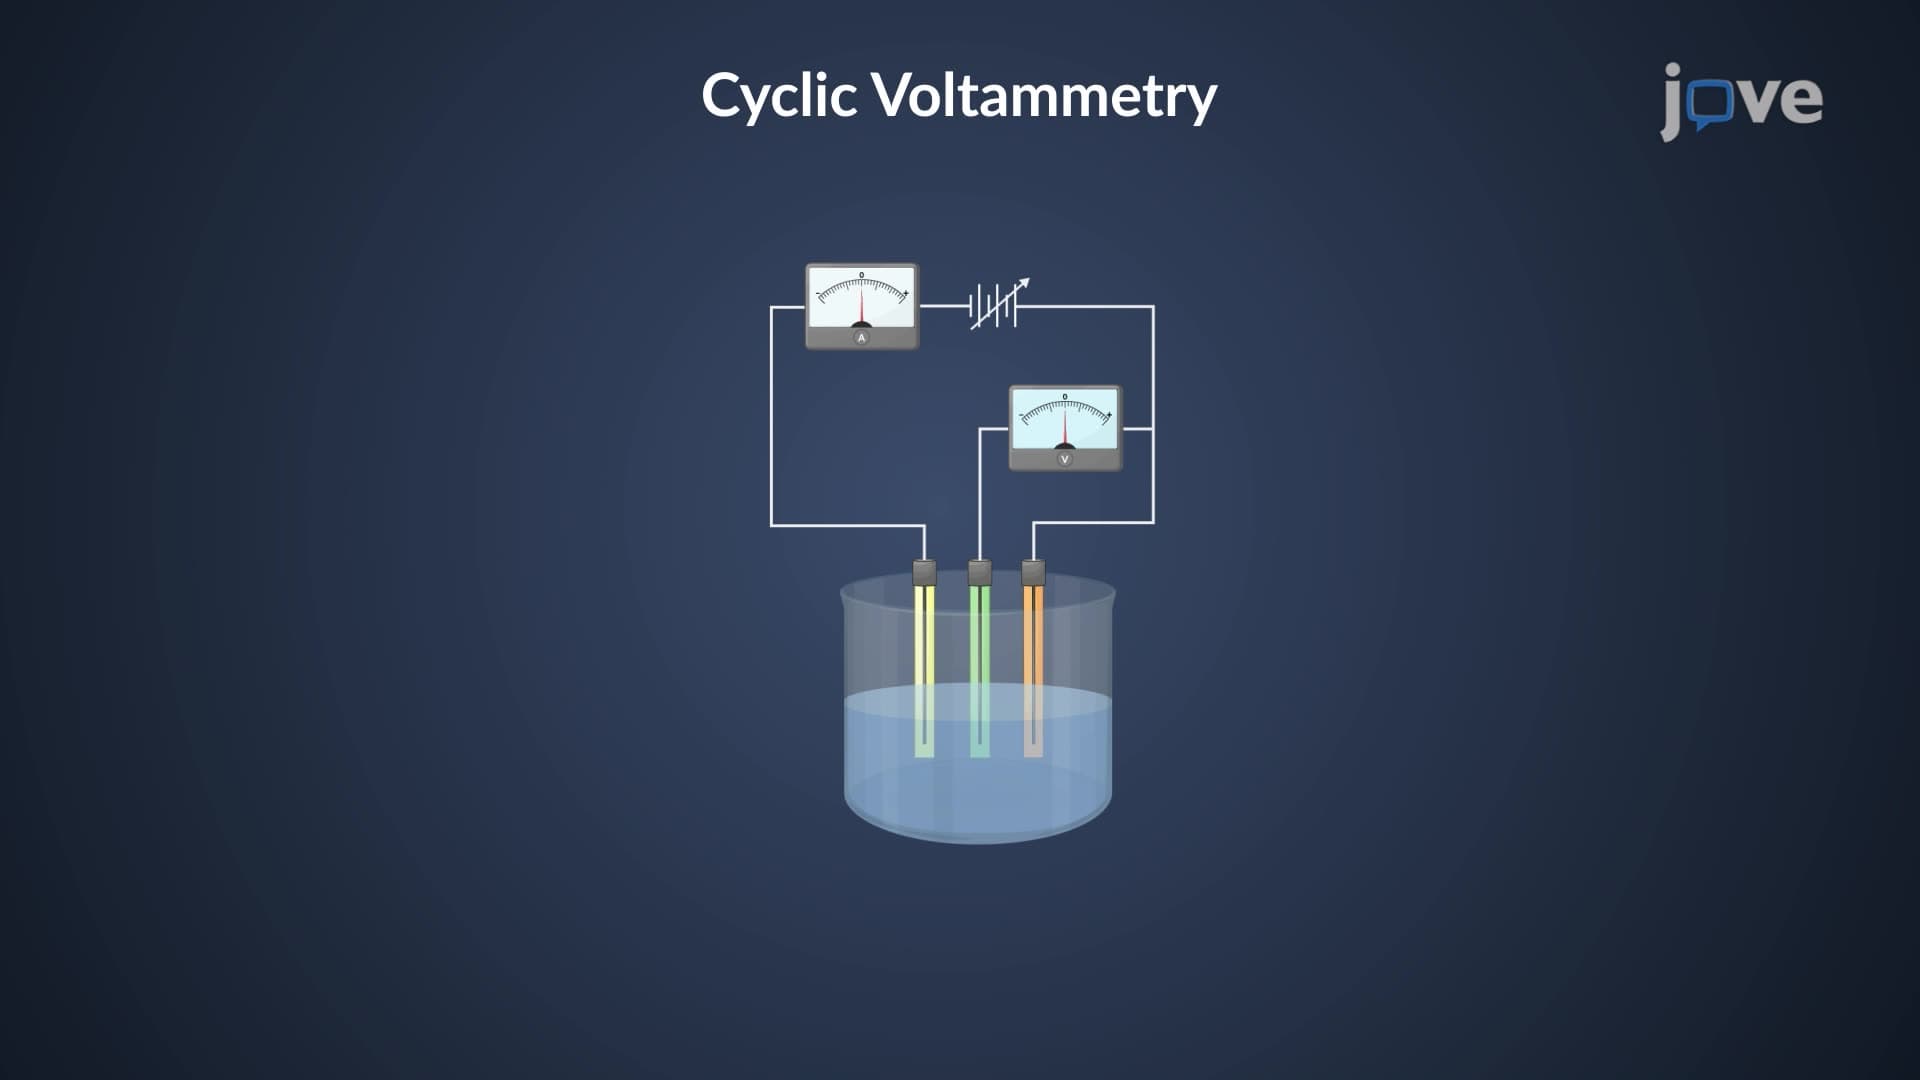
The experimental setup requires three distinct electrodes immersed in an electrolyte solution. The working electrode (typically glassy carbon or platinum) serves as the reaction site where your analyte undergoes oxidation or reduction. The reference electrode (commonly Ag/AgCl in US labs) maintains a stable potential reference point, while the counter electrode completes the electrical circuit. This configuration ensures precise potential control-critical when studying redox couple cyclic voltammetry behavior.
Students preparing for AP Chemistry or MCAT examinations should understand that the triangular waveform distinguishes CV from other electrochemical techniques. Starting at an initial potential where no reaction occurs, the voltage sweeps toward a vertex potential where electron transfer begins, then reverses direction. This back-and-forth motion creates the characteristic "cyclic" nature that reveals both forward and reverse reactions.
The resulting current-voltage plot displays two key features: anodic peaks (positive current, oxidation) and cathodic peaks (negative current, reduction). Peak position indicates the thermodynamic favorability of electron transfer, while peak height correlates with analyte concentration-following the Randles Sevcik equation CV relationship: peak current = constant × concentration × (scan rate)^0.5.
For reversible systems, the anodic and cathodic peaks appear symmetric with a separation of approximately 59 mV (at 25°C). Irreversible systems show larger peak separations and asymmetric shapes. These distinctions prove crucial for students tackling electrochemistry problems on standardized tests or college organic chemistry exams.
Scan rate dramatically influences voltammogram appearance. Faster scan rates increase peak currents but may shift peak potentials, while slower rates allow complete equilibration but reduce sensitivity. US pharmaceutical companies like Pfizer and Johnson & Johnson employ optimized scan rates when validating drug purity, ensuring accurate concentration measurements that meet FDA requirements.
Related Micro-courses