Loading subject page…

- Chemistry
- Chemical Kinetics
- Arrhenius Plots
Micro-course: Chemical Kinetics
561,000 views
Learn key concepts and earn your certificate.


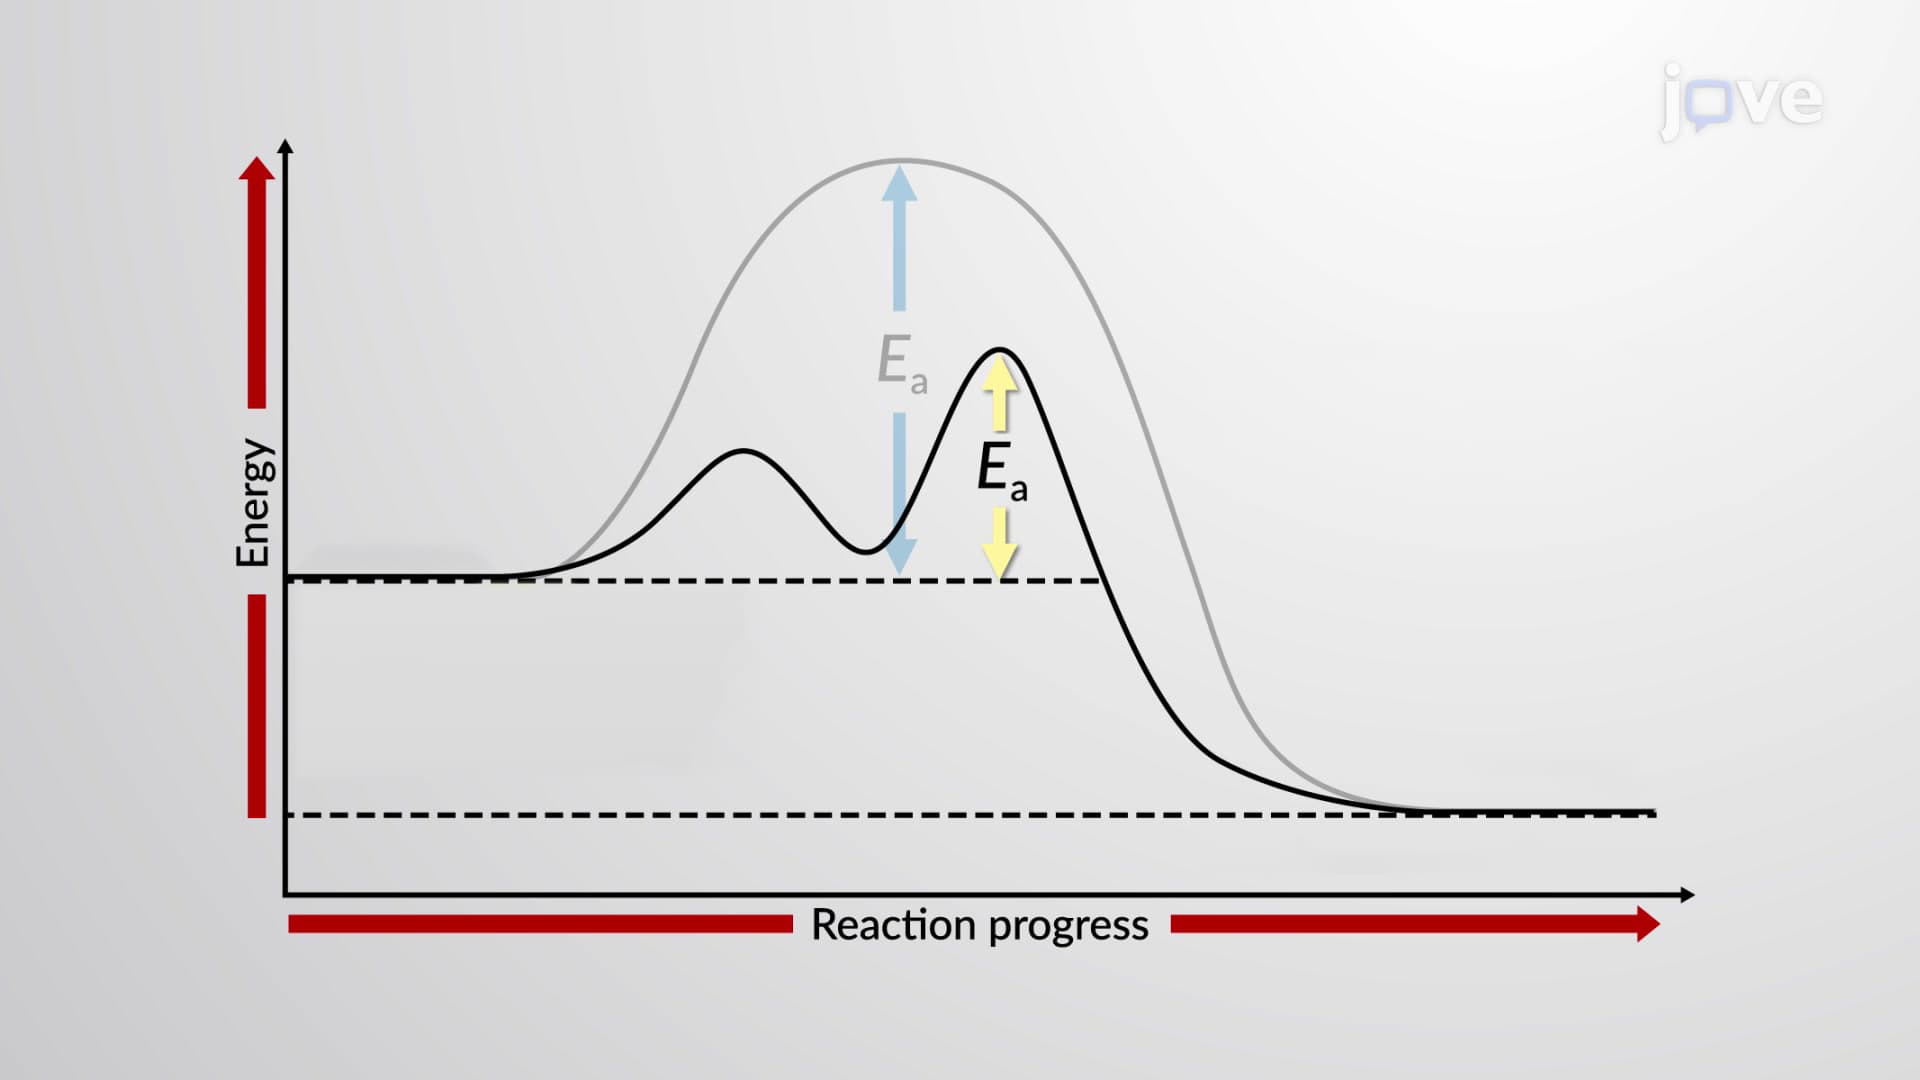

Arrhenius Plots

00:00
02:34
Video Summary: What Is Arrhenius Plots
Ever wonder why food spoils faster in summer heat or why industrial chemical processes require precise temperature control? Arrhenius plots provide the mathematical framework to understand how temperature dramatically affects reaction rates. For example, pharmaceutical companies use these plots to determine optimal storage temperatures for medications like insulin, ensuring they remain effective throughout their shelf life. These powerful graphical tools transform complex exponential relationships into simple linear equations, making it easier to calculate activation energies and predict reaction behavior. Watch the full video on JoVE Coach to master this concept with expert-led visuals and step-by-step explanations.
- Understand what Arrhenius plots are and how they graphically represent the relationship between reaction rate constants and temperature
- Identify the key components of an Arrhenius plot, including the natural logarithm of rate constant versus inverse temperature relationship
- Analyze the slope and y-intercept of Arrhenius plots to determine activation energy and frequency factor values
- Apply the linearized form of the Arrhenius equation to convert exponential data into manageable straight-line graphs
- Evaluate experimental kinetic data using both graphical Arrhenius plots and two-point calculation methods
- Recognize how activation energy calculations from Arrhenius plots inform real-world applications in pharmaceuticals and manufacturing
- Compare different approaches for determining activation energy when graphical methods are impractical
- Explore the connection between molecular collision theory and the mathematical parameters derived from Arrhenius analysis
Understanding Arrhenius Plots: The Foundation of Reaction Kinetics
Arrhenius plots serve as one of the most powerful tools in physical chemistry for understanding how temperature affects reaction rates. Named after Swedish chemist Svante Arrhenius, these graphs transform the complex exponential Arrhenius equation into a simple linear relationship that students and researchers can easily interpret and analyze.
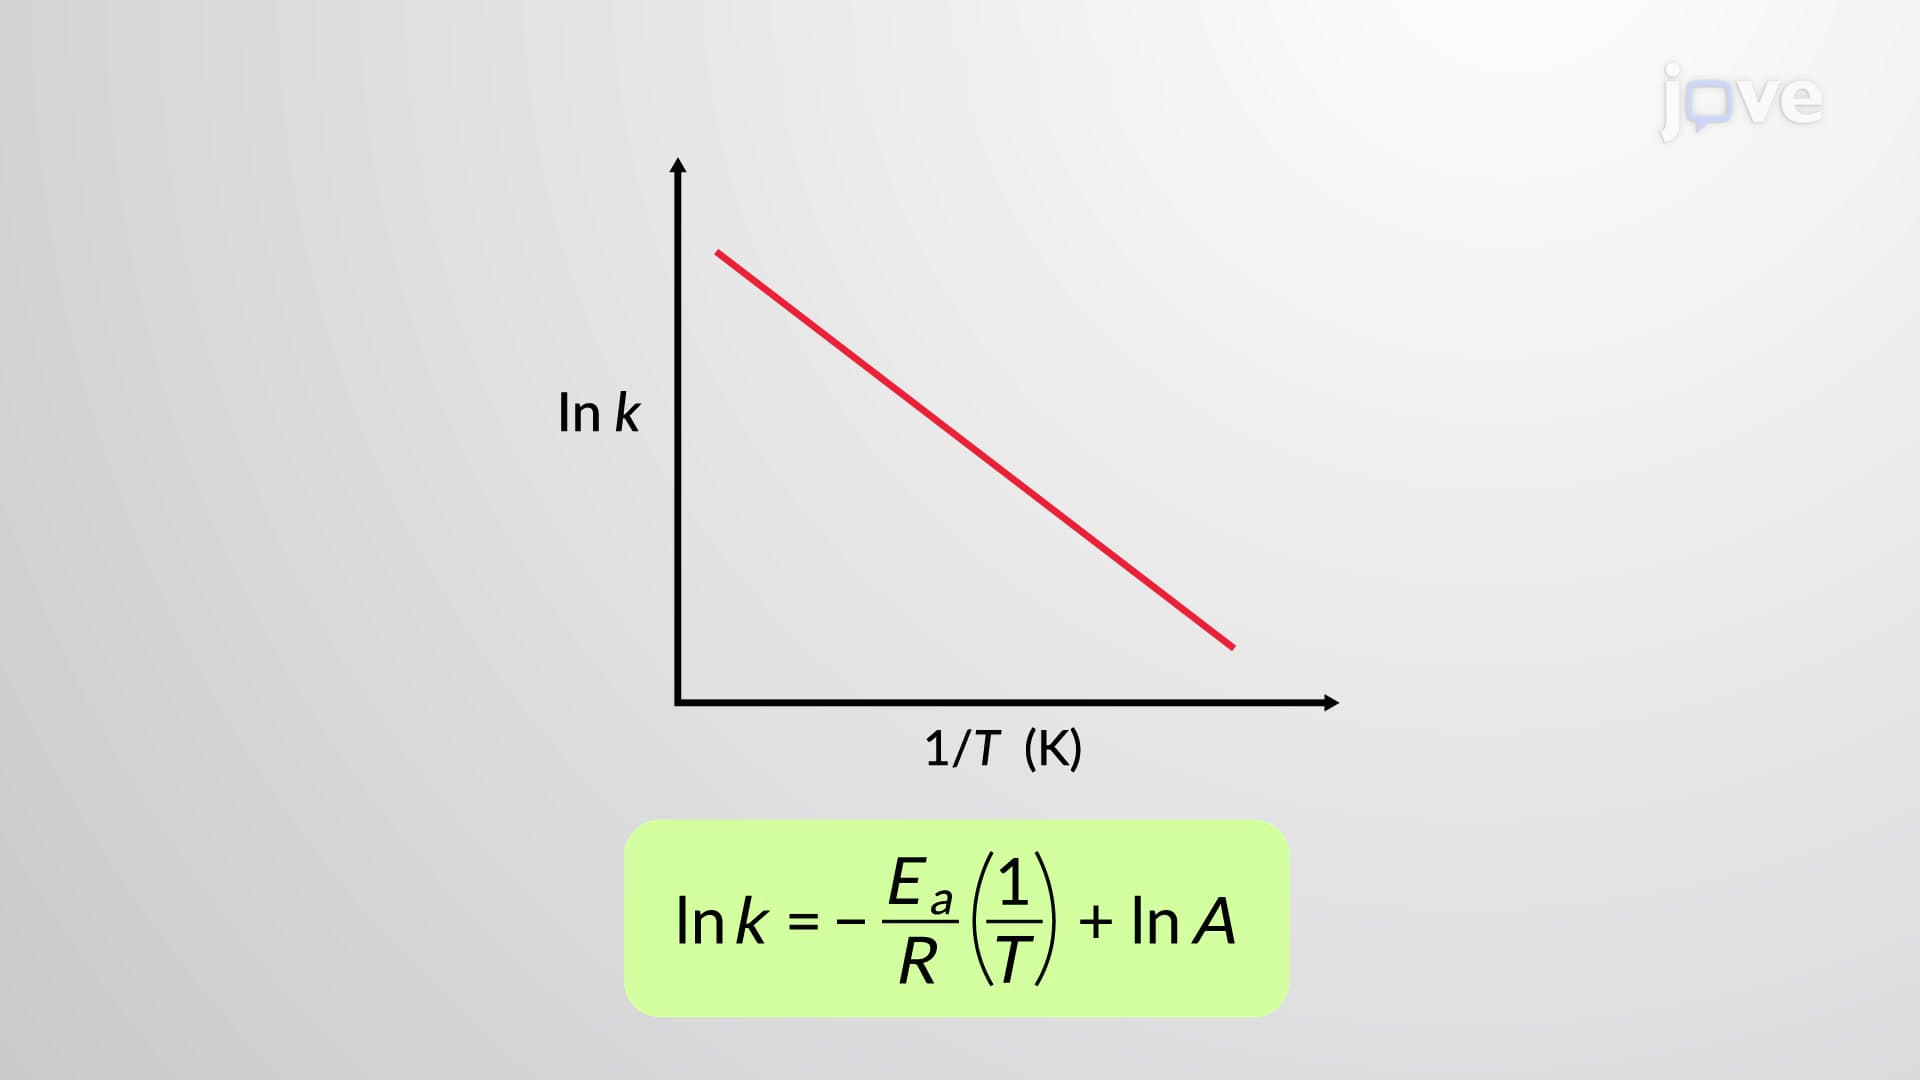
The beauty of Arrhenius plots lies in their mathematical elegance. By taking the natural logarithm of both sides of the Arrhenius equation, we convert the exponential form k = A·e^(-Ea/RT) into the linear equation ln(k) = ln(A) - Ea/RT. This transformation creates a straight line when plotting ln(k) versus 1/T, where the slope equals -Ea/R and the y-intercept equals ln(A).
Practical Applications in Industry and Research
American pharmaceutical companies like Pfizer and Merck routinely use Arrhenius plots to optimize drug manufacturing processes. For instance, when developing temperature-sensitive medications, chemists plot reaction rate data at various temperatures to determine the optimal synthesis conditions that maximize yield while minimizing unwanted side reactions. Similarly, food processing companies use these plots to establish pasteurization temperatures that effectively eliminate pathogens without destroying nutritional value.
Mastering the Calculations for Academic Success
For students preparing for AP Chemistry or college-level physical chemistry courses, understanding Arrhenius plots is crucial. The MCAT frequently tests this concept, particularly in passages involving enzyme kinetics or metabolic pathways. Students should practice identifying the slope and y-intercept from experimental data, then converting these values to activation energy (typically in kJ/mol) and frequency factor (with units matching the rate constant).
The two-point form of the Arrhenius equation becomes invaluable when graphical methods aren't feasible. This approach, ln(k2/k1) = (Ea/R)·(1/T1 - 1/T2), allows direct calculation of activation energy from just two data points, making it particularly useful for laboratory experiments with limited data or when precise graphing tools aren't available.
Common Pitfalls and Study Strategies
Students often struggle with unit conversions when working with Arrhenius plots. Remember that temperature must always be in Kelvin, the gas constant R equals 8.314 J/(mol·K), and activation energy should be reported in kJ/mol for consistency with thermodynamic conventions. Practice problems involving real-world scenarios, such as determining shelf-life stability of consumer products or optimizing industrial catalyst performance, help solidify these concepts for exam success.
Frequently Asked Questions
Arrhenius plots are graphs that show the relationship between reaction rate constants and temperature by plotting ln(k) versus 1/T. They're crucial because they allow chemists to determine activation energy and predict how reactions will behave at different temperatures. This information is essential for optimizing industrial processes, designing safer chemical procedures, and understanding biological systems.
AP Chemistry frequently tests Arrhenius plots through data analysis questions where students must interpret graphs, calculate activation energy from slope values, or predict rate constants at different temperatures. Expect to see these concepts integrated with equilibrium, thermodynamics, and kinetics free-response questions. Practice converting between different units and interpreting experimental data graphically.
MCAT passages often combine Arrhenius plots with enzyme kinetics or metabolic pathways, requiring students to connect temperature effects with biological processes. The key challenge is recognizing when to apply the Arrhenius equation versus other kinetic models. Focus on understanding how temperature affects enzyme activity and cellular metabolism, as these applications frequently appear in biological sciences sections.
Pharmaceutical companies like Johnson & Johnson use Arrhenius plots to determine optimal storage conditions for medications, predict shelf-life stability, and optimize synthesis reactions. For example, when developing temperature-sensitive vaccines, researchers plot degradation rates at various temperatures to establish cold-chain requirements. This ensures medications remain effective from manufacturing through patient administration.
No advanced mathematics beyond basic logarithms and linear equations is required for Arrhenius plots. If you can work with ln functions and understand slope-intercept form (y = mx + b), you have the necessary mathematical foundation. Most students successfully master this concept with practice, focusing on unit conversions and interpreting graphical data rather than complex mathematical derivations.
Practice with real experimental data sets, focusing on identifying correct units and converting between different temperature scales. Create summary sheets showing the relationship between slope, activation energy, and gas constant values. Work through problems that combine graphical interpretation with calculations, and always double-check that your final activation energy values are reasonable (typically 20-200 kJ/mol for most chemical reactions).
After mastering Arrhenius plots, explore transition state theory and collision theory to understand why activation energy barriers exist. Study enzyme kinetics, particularly Michaelis-Menten equations, to see how biological systems modify these relationships. Advanced topics include catalysis mechanisms and how different reaction pathways affect activation energy values.
Related Micro-courses

10 Concepts
14 Concepts

15 Concepts